In Part 5, we found that there are 6,435 possible outcomes for the complete characterization of a process of repeating three coin flips. This arises because a 3-flip sequence must be repeated eight times to allow for the possibility of all eight equally probable sequence results occurring. In this article, we calculate the probability of obtaining any individual outcome and also the probability of obtaining an outcome of each of the 22 outcome types.

Outcomes vs. Pathways
An outcome, say AABCDDEH, is the same for any ordering of the eight sequences consisting of 2As, 2Ds, 1B, 1C, 1E, and 1H. There are many different orderings of the eight sequence selections that will lead to that one outcome. We call these different orderings, pathways.
If we know the number of pathways for obtaining an outcome and the probability of obtaining each pathway, we can determine the probability of obtaining the outcome.
Probability of a Pathway
Each pathway has a specific sequence for each of the eight “boxes” in the outcome. This is different from the process we used in counting outcomes. In that exercise, the ordering of the sequences did not matter – only that the correct number of each sequence was obtained during the eight selections.
It should be obvious upon inspection that the probabilities of all pathways are identical. Each pathway has a specified sequence to be selected for each of the eight “boxes,” and each of the sequences has a probability of 1/8.
Probability for a pathway = P1 x P2 x P3 x P4 x P5 x P6 x P7 x P8
= 1/8 x 1/8 x 1/8 x 1/8 x 1/8 x 1/8 x 1/8 x 1/8
=1/88 =1/16,777,216 = 5.96046E-08 = 0.00000596%
Repeating from above: All pathways have identical probabilities.
Note: The total number of pathways is equal to the number of permutations of eight things taken eight at a time with replacement. (See Part 4.)
Total number of pathways for all 6,435 combinations = 8P8 = 88 = 16,777,216
Probability of an Outcome
The probability of any outcome is calculated from the number of pathways that produce that outcome.
Probability for an Outcome =
Probability for a Pathway x Number of Pathways for that Outcome
The number of pathways for each outcome is calculated using the permutation formula: (Ref.?)
Number of Permutations = n! / (n1! x n2! x … x nk!)
where n is the total number of elements (in our case, 8) and n1, n2, nk are the number of elements with repetitions.
Examples:
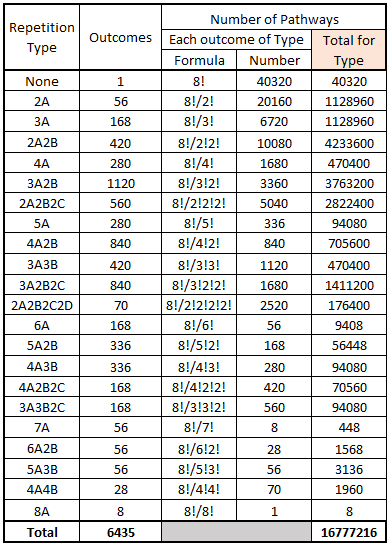
- For the type 2A2B, the number of pathways for each outcome is 8!/(2!2!) = 40320/4 = 10080.
- For the type 3A2B2C, the number of pathways for each outcome is 8!/(3!2!2!) = 40320/24 = 1680
The following table shows the number of pathways for each outcome of each type. The table also shows the total number of pathways for all the outcomes of each type combined. Note that the table shows the total of all outcomes to be 16,777,216. This is equal to 88, identical to the total calculated earlier in this section.

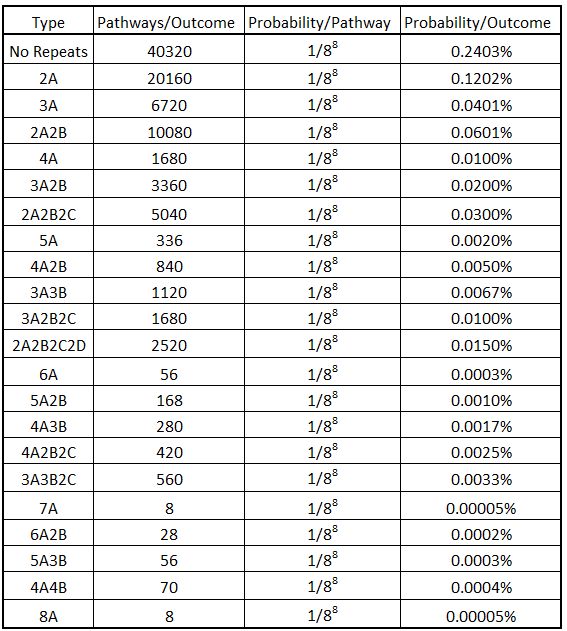
Using the number of pathways for each outcome of the specific types (column four in the table above), the probability of each outcome is calculated.
Probability/Outcome =
Probability/Pathway x Number of Pathways/Outcome
the following table shows the probability of an outcome of each type:

Probability of an Outcome Type
The following equation gives the probability that an outcome will fall into a given type:
Probability for typei =
Probability for an Outcome in typei x Number of Outcomes for typei
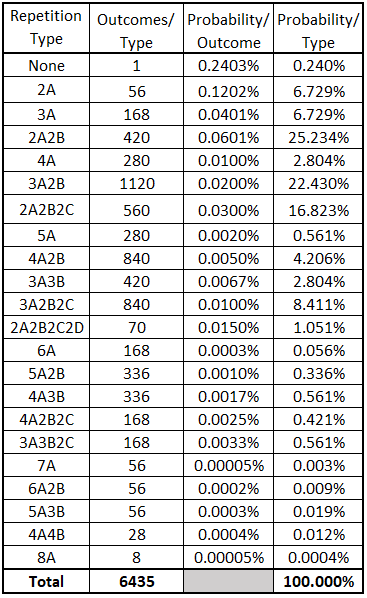
The preceding table gives the probability for an outcome of each type. The second table above gives the number of outcomes for each type.
The table below gives the resulting probability for each type. The total of all probabilities is the required 100%.

Certain types are far more probable than others.
- Three types (2A2B, 3A2B, and 2A2B2C) account for 64.5% of all outcome probability (32.6% of all outcomes).
- Six types (the three above plus 2A, 3A, and 3A2B2C) account for 86.4% of all outcome probability (49.2% of all outcomes).
- Ten types (the six above plus 4A, 4A2B, 3A3B, and 2A2B2C2D) account for 97.2% of all outcome probability (74.2% of all outcomes).
Looking at the remaining twelve types, we see the following:
- Six types (No Repeats, 5A, 5A2B, 4A3B, 4A2B2C, and A2B2C) account for 2.7% of all outcome probability (20.0% of all outcomes).
- Six types (6A, 7A, 6A2B, 5A3B, 4A4B, and 8A) account for 0.1% of all outcome probability (5.8% of all outcomes).
Remember, we started in Part 1 with the eight-sequence probability array for the outcome of three coin flips. That array is the No Repeats outcome among all the outcomes. In Part 3, we saw that consideration of the initial probability array was a misleading guide to the real experience of an individual flipping coins. We see in this analysis that it is also insufficient for understanding the distributions for many outcomes.
Conclusion
This exercise shows that understanding the simple process of flipping a coin three times leads to a very complicated analysis. There is not one simple probability array for the eight possible sequences controlling the analysis. Instead, there are 6,435 8-sequence arrays involved. Going deeper down the rabbit hole, we find that there are more than 16.7 million pathways to get the 6,435 arrays.
Each array of eight 3-flip sequences involves 24 coin flips. That means that the definition of the 16.7 million pathways infers 16.7 m x 24 = 400.8 million coin flips. As we have seen in this study, because the probability of each element step (coin-flip) result is known, we can use combinatoric calculations to determine what to expect for large numbers of coin-flip sequences. We get a clear understanding of why the large sample sizes found by Blair Fix’s simulations are necessary to approach ultimate probability levels. (Part 1 and Part 2.)
There will be one more part to this series. In it, we will try to generalize what the complexity seen here means for the analysis of complex processes in general. We will discuss the challenges faced in attempting to model complex systems related to what is found in this simple process.
Previous Articles in the Series
Part 1: The Gamblers’ Paradox.
… Lounsbury, John, “Adventures With 3 Coin Flips. Part 1: The Gamblers’ Paradox,” EconCurrents, May 21, 2023, https://econcurrents.com/2023/05/21/adventures-with-3-coin-flips-part-1-the-gamblers-paradox/
Part 2: Connecting the Micro to the Macro.
… Lounsbury, John, “Adventures With 3 Coin Flips. Part 2: Connecting the Micro to the Macro,” EconCurrents, May 28, 2023, https://econcurrents.com/2023/05/28/adventures-with-3-coin-flips-part-2-connecting-the-micro-to-the-macro/
Part 3: Possibilities vs. Realities.
… Lounsbury, John, “Adventures With 3 Coin Flips. Part 3: Possibilities vs. Realities,” EconCurrents, November 19, 2023, https://econcurrents.com/2023/11/19/adventures-with-3-coin-flips-part-3-possibilities-vs-realities/
Part 4: Learning to Count at an Advanced Age.
… Lounsbury, John, “Adventures With 3 Coin Flips. Part 4: Learning to Count at an Advanced Age,” EconCurrents, November 26, 2023, https://econcurrents.com/2023/11/26/adventures-with-3-coin-flips-part-4-learning-to-count-at-an-advanced-age/.
Part 5: Identifying and Counting Outcomes.
… Lounsbury, John, “Adventures with 3 Coin Flips. Part 5: Identifying and Counting Outcomes,” EconCurrents, December 3, 2023, https://econcurrents.com/2023/12/03/adventures-with-3-coin-flips-part-5-identifying-and-counting-outcomes/.