Many gambling activities involve betting on events for which the outcomes obey rigid, specified odds. When there is no mechanical bias, roulette wheels have fixed odds, including some that are binary (50:50) such as red vs. black. Betting on the flip of a coin is likewise a binary 50:50 proposition: heads or tails. Why is it then that there is a propensity for some gamblers to place wagers in a pattern conflicting with the known 50:50 odds? For example, after a string of blacks on a roulette wheel, why do some gamblers keep increasing the amounts bet on red with each succeeding black?

Such behavior is related to the concept that if some process deviates from a known probability for a period of time future events will counter that deviation in what is called “reversion to the mean”. But the expectation that such a process will start with the next process event cannot have a probability different from the known odds. If someone flips 10 heads in a row, the next coin flip still has even odds of heads or tails.
Reversion to the Mean
However, the reversion-to-the-mean bias does exist and is reinforced by the way a gambler may look at things. Australian economist Jason Collins has considered a coin-flipping problem involving 3 flips per sequence. He considers all the 8 possible outcomes and presents the following table:
8 possible combinations of heads and tails across three flips
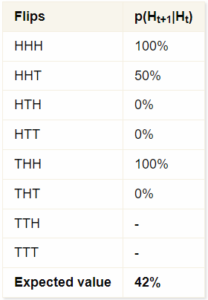
Collins provides the following comments:
That doesn’t seem right. If we count across all the sequences, we see that there are 8 flips of heads that are followed by another flip. Of the subsequent flips, 4 are heads and 4 are tails, spot on the 50% you expect.
By looking at these short sequences, we are introducing a bias. The cases of heads following heads tend to cluster together, such as in the first sequence which has two cases of a heads following a heads. Yet the sequence THT, which has only one shot occurring after a heads, is equally likely to occur. The reason a tails appears more likely to follow a heads is because of this bias whereby the streaks tend to cluster together. The expected value I get when taking a series of three flips is 42%, when in fact the actual probability of a heads following a heads is 50%. As the sequence of flips gets longer, the size of the bias is reduced, although it is increased if we examine longer streaks, such as the probability of a heads after three previous heads.
The net of the above comments is that the sampling process can introduce bias. Collins does not explore this in more detail. That has been done by Blair Fix and we go to that work next.
Is Human Probability Intuition Actually Biased?
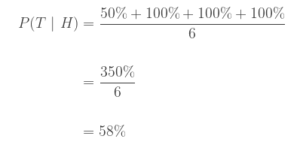
In his piece Is Human Probability Intuition Actually ‘Biased’? Blair Fix expanded the 3-flip analysis of Collins. Fix considered the inverse relationship compared to Collins. He set the problem up to consider the probability that tails would follow heads. The result is 58%, complementary to Collins 42% for heads following heads.
The probability of tails after heads when tossing a coin 3 times
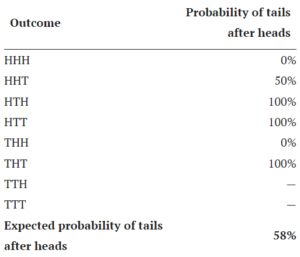
Modeled after Jason Collins’ table in Aren’t we smart, fellow behavioural scientists.
Fix provided additional details:
To understand the numbers, let’s work through some examples:
- In the first row of Table 2 we have HHH. There are no tails, so the probability of tails after heads is 0%.
- In the second row we have HHT. One of the heads is proceeded by a tails, the other is not. So the probability of tails after heads 50%.
We keep going like this until we’ve covered all possible outcomes.
To find the expected probability of tails after heads, we average over all the outcomes where heads occurred in the first two flips. (That means we exclude the last two outcomes.) The resulting probability of tails after heads is:
The last two sequences (TTH and TTT) are not included in the average because there was no opportunity for heads to be followed by another flip.
Sample Size
Fix expanded the investigation into the “memory” bias in two ways:
- He used a random number generator to show how the bias could vary as results were accumulated over increasing numbers of 3-flip sequences.
- The nature of the bias when a greater number of consecutive flips resulted in repeated heads.
In this section, we take a look at increasing numbers of 3-flip sequences.
A small sample size of 3-flip iterations produced widely varying observed probabilities. Increasing the number of iterations for the 3-flip sequence produced a result near 58% after a few hundred iterations. The result converged ever closer to 58% as the number of iterations was continued to many 10s of thousands.
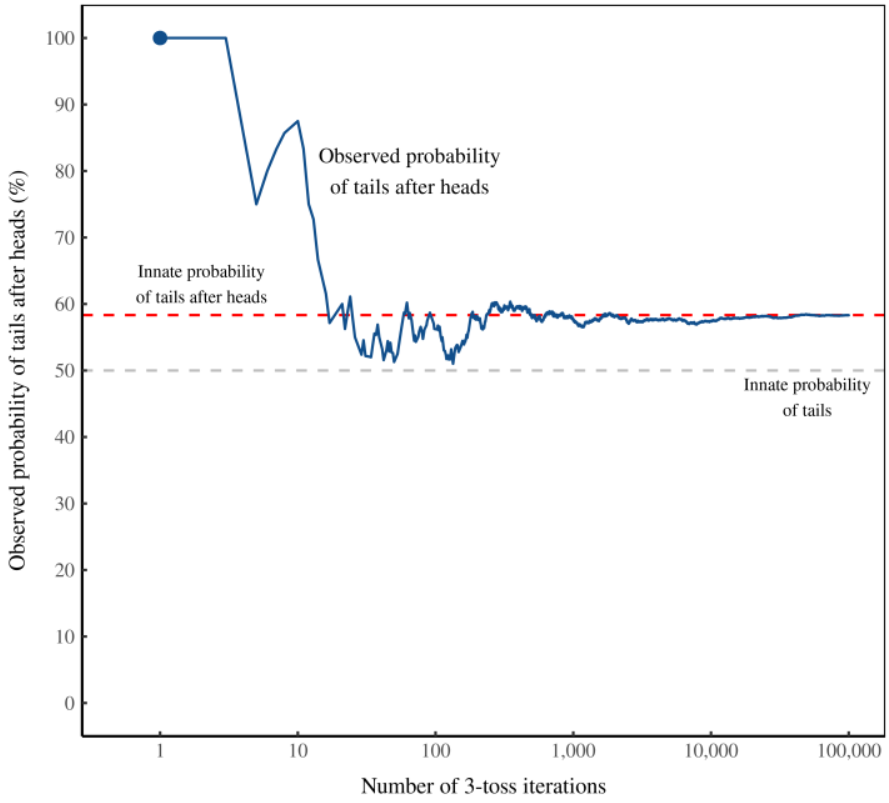
Figure 2: When tossed 3 times, a simulated coin favors tails after heads.
I’ve plotted data from a simulation in which I repeatedly toss a balanced coin 3 times. The blue line shows the observed probability that tails follows heads. The horizontal axis shows the number of times I’ve repeated the experiment.
Increasing the Observation Window
Fix increased the length of the observation window from 3 flips in a few increments up to 100 flips and obtained the following results:
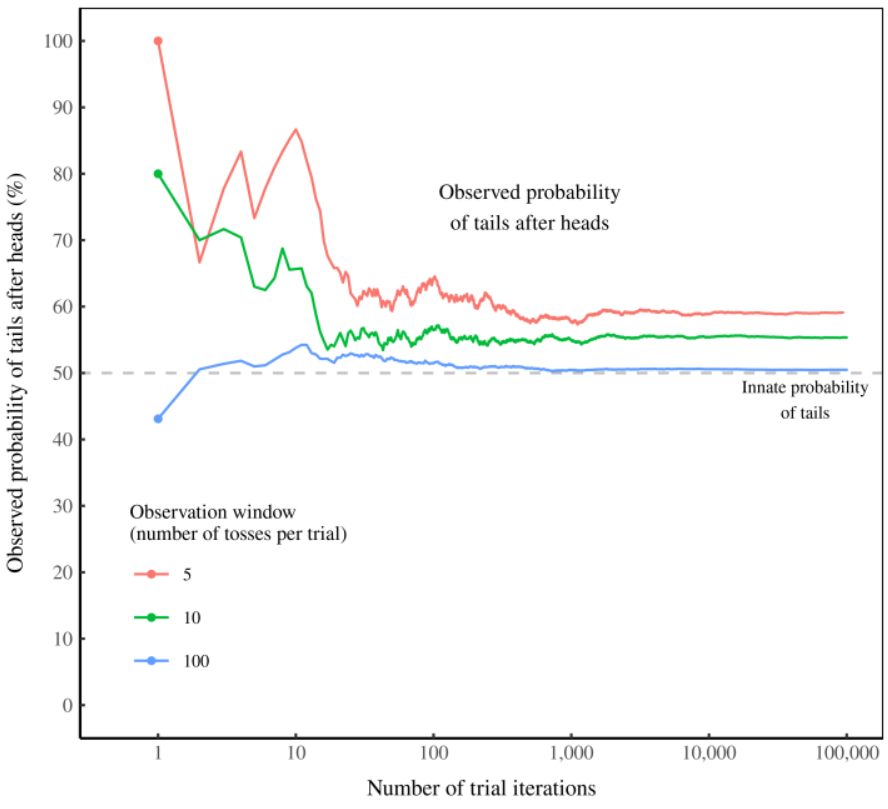
Figure 3: Favoratism for tails (after heads) disappears as the observation window lengthens.
The coin’s apparent ‘memory’ is actually an artifact of our observation window of 3 tosses. As we lengthen this window, the coin’s memory disappears. Figure 3 shows what the evidence would look like. Here I again observe the probability of tails after heads during a simulated coin toss. But this time I change how many times I flip the coin. For an observation window of 5 tosses (red), tails bias remains strong. But when I increase the observation window to 10 tosses (green), tails bias decreases. And for a window of 100 tosses (blue), the coin’s ‘memory’ is all but gone.
Increased Number of Consecutive Heads
Fix next examined what happens if we look for the probability of tails after longer consecutively repeated heads.
The example above shows the coin’s apparent memory after a single heads. But what if we lengthen the run of heads? Then the coin’s memory becomes more difficult to wipe. Figure 4 illustrates.
I’ve plotted here the results of a simulated coin toss in which I measure the probability of getting tails after a run of heads. Each panel shows a different sized run (from top to bottom: 3, 5, 10, and 15 heads in a row). The vertical axis shows the observed probability of tails after the run. The colored lines indicate how this probability varies as we increase the number of tosses in our observation window (horizontal axis).
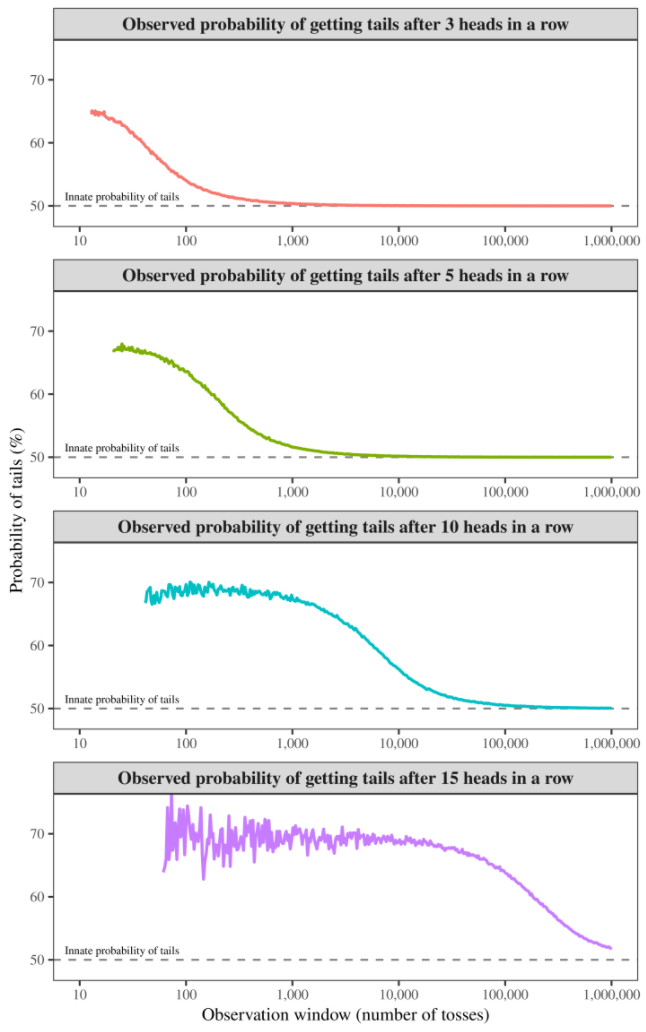
Figure 4: Wiping a coin’s ‘memory’.
I’ve plotted here the results of a simulated coin toss in which I measure the probability of getting tails after a run of heads. Each panel shows a different sized run (from top to bottom: 3, 5, 10, and 15 heads in a row). The horizontal axis shows the number of tosses observed. The vertical axis shows the observed probability (the average outcome over many iterations) of getting tails after the corresponding run of heads. The longer the run of heads, the more tosses you need to remove the coin’s apparent preference for tails.
Summary
The added work by Fix illustrated the conclusions of Collins. I summarize the conclusions illustrated by Fix as:
- With some data samples, it can appear that a coin has a bias deviating from the established 50:50 heads:tails probability.
- Short sampling windows are associated with the expression of an apparent bias.
- The bias is strengthened for a flip following a longer sequence of identical results.
Fix offers the following interpretation of his results:
Yes, we tend to project ‘memory’ onto random events that are actually independent. And yet when the sample size is small, projecting memory on these events is actually a good way to make predictions. I’ve used the example of a coin’s apparent ‘memory’ after a run of heads. But the same principle holds for any independent random event. If the observation window is small, the random process will appear to have a memory.
Fix suggests the possibility that human observation is biased only when compared to innate probability over a large scale of data. When a small sample of observations is involved, as is often the case for humans in gaming (gambling) situations, human intuition is correctly predicting the probability actually experienced.
When behavioral economists conclude that our probability intuition is ‘biased’, they assume that its purpose is to understand the god’s eye view of innate probability — the behavior that emerges after a large number of observations. But that’s not the case. Our intuition, I argue, is designed to predict probability as we observe it … in small samples.
Further Work
I had discussions with Blair Fix following the posting of Is Human Probability Intuition Actually ‘Biased’? I asked if he had considered examining questions involving:
- Confusion of possibility with reality.
- Understanding why such a simple process as making 3 coin flips produced such wild “volatility”.
- How this coin flipping exercise might relate to rational expectations.
- Does the example relate to difficulties in establishing the “macro” based on the “micro”.
- The mental conflation of alternate universes.
- Recognizing how ergodicity (or lack thereof) might relate to his observations.
He said that the complexity of such questions had put him off looking at those issues. He suggested I have a look at them. The following articles in this series recount what happened when I went down the ensuing rabbit hole. I found some rather beastly bunnies down there which gave me a frustrating battle for more than four months.
Next article:
Part 2. From the Micro to the Macro
Caption graphic credit: Image by ChrisV-ESL from Pixabay.
Pingback: Adventures With 3 Coin Flips. Part 2: Connecting the Micro to the Macro - EconCurrents