15 Apr 2023 Market Close & Major Financial Headlines: After A Weekend Of Negative World News, Wall Street Opened Sharply Higher, Then began Trading Lower, Closing Moderately Down In The Red At Session Lows

Summary Of the Markets Today:

  • The Dow closed down 248 points or 0.65%,
  • Nasdaq closed down 1.79%,
  • S&P 500 closed down 1.20%,
  • Gold $2,4021 up $28.30,
  • WTI crude oil settled at $86 down $0.13,
  • 10-year U.S. Treasury 4.616% up 0.056 points,
  • USD index $106.19 up $0.117,
  • Bitcoin $63,512 down $658 (1.05%)

*Stock data, cryptocurrency, and commodity prices at the market closing.


Click here to read our current Economic Forecast – April 2024 Economic Forecast: Economy Marginally Improving But Growth Will Be Weak


Today’s Economic Releases Compiled by Steven Hansen, Publisher:

Advance estimates of U.S. retail and food services sales for March 2024 was up 2.4% above March 2023 (not seasonally adjusted as it is a year-over-year calculation)  – and up 0.1% inflation adjusted. The headline numbers which showed a +0.7% month-over-month growth distorts the true growth picture when in fact retail sales is not growing year-over-year when inflation is considered.

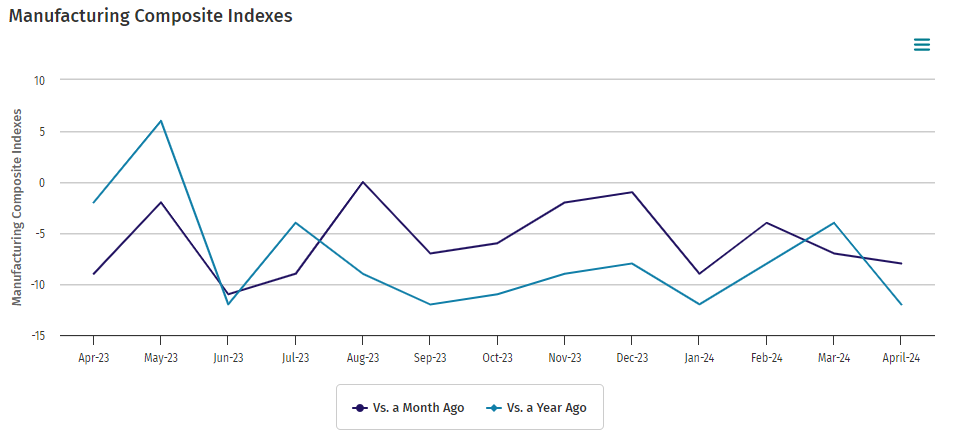
The New York Fed’s Empire State Manufacturing Survey Business activity continued to decline in April 2024. The headline general business conditions index rose seven points but remained below zero at -14.3. New orders and shipments both declined significantly, and unfilled orders continued to shrink. My position is that manufacturing in the U.S. remains in a recession.


Here is a summary of headlines we are reading today:

Click on the “Read More” below to access these, other headlines, and the associated news summaries moving the markets today.

World Agriculture Production – El Nino Impacts Discussed – April 15, 2024

Once a month USDA issues two reports on World Agriculture Production. Saturday I published the summary of the World Agriculture Supply and Demand (WASDE) situation. My article on this can be accessed HERE.  The USDA report on supply and demand includes information on production but does not provide as much information on production as this report but the production information in this USDA Report is is taken from the USDA report on Supply and Demand. Production is part of Supply because Supply is current Production plus changes in inventory. It is confusing with two parts of USDA publishing information on the same topic but you need to look at both reports to get the complete picture.

Production is useful when we are looking at trends. That information is provided in this USDA Report and I am providing the part of the report that contains maps and text.The second part of the report contains detailed tables covering a large number of nations and crops. At the end of the article I provide the link to the full report. I think that each month USDA focuses on certain countries and crops. If they did that each month their report would be way too large and they probably do not have the staff to create that kind of report each month.

Remember: The U.S. is part of the World so reports about World Production also contain information on U.S. Production. All of these reports are complicated by the time of the year the report is produced. The stage of production varies a lot from the Northern Hemisphere to the Southern Hemisphere and also by crop and species of animal. I have reorganized the report a bit to keep all the information for the same country together and to start with the EU as I thought that would be of most interest to readers.

There is also a U.S. version of this report but there are only so many hours in the day for me to write and readers to read my articles.

The Production report is useful for understanding of:

A. How it might be impacted by Global Warming and

B. The impact on the World Geo-political situation.

C. The impact of ENSO. For the U.S. El Nino tends to be wet. For much of the World, El Nino tends to be dry. So we see both impacts in what I will now present.

Let’s get started. Where I have comments the are provided in a box so that you can tell that is from USDA and what are my mostly explanatory comments. At the end of the article there is a conversion table from metric to English Units e.g.  hectares versus acres.

It is easy to get confused with what is being presented in the above graphics.  In some cases they are talking about yield. In other cases the number of Hectares planted.  I think the abbreviation MY means market year which varies by crop and location.  Also the maps show the EU so they do not include the UK or Ukraine.

NDVI (Normalized Difference Vegetation Index) is used to quantify vegetation greenness and is useful in understanding vegetation density and assessing changes in plant health. NDVI is calculated as a ratio between the red (R) and near infrared (NIR) values in traditional fashion: (NIR – R) / (NIR + R).  The NDVI does not show the cause of something but the result of something. One can surmise that it was wet in Nov – Dec which was good for plant growth and then dry through to March. I am not exactly sure why USDA included that graphic but it is a common measure so I thought I would explain it.

Some will have to click on “Read More” to access the remainder of this article. There is a lot more.

Today Through the Fourth Friday (22 to 28 days) Weather Outlook for the U.S. and a Six-Day Forecast for the World: posted April 15, 2024

It is difficult to find a more comprehensive Weather Outlook anywhere else with the ability to get a local 10-day Forecast also.

This article focuses on what we are paying attention to in the next 48 to 72 hours. The article also includes weather maps for longer-term U.S. outlooks and a six-day World weather outlook which can be very useful for travelers.

First the NWS Short Range Forecast. The afternoon NWS text update can be found here but it is unlikely to have changed very much. The images in this article automatically update.

Short Range Forecast Discussion
NWS Weather Prediction Center College Park MD
Mon Apr 15 2024
Valid 12Z Mon Apr 15 2024 – 12Z Wed Apr 17 2024

…Intensifying storm system to bring the threat of severe weather and
isolated flash flooding to the Plains Monday, followed by the Mississippi
Valley on Tuesday…

…Scattered thunderstorms, including the threat for some severe weather,
from the Upper Ohio Valley east through the Mid-Atlantic Monday…

…Moderate to locally heavy snowfall expected over the next couple of
days for higher elevations of the northern Cascades, northern/central
Rockies, and eastern Great Basin…

…Well above average temperatures across the Central/Eastern U.S;
Critical Risk of Fire Weather for the central/southern High Plains
Monday….

A deep, upper-level low and associated low pressure/frontal system over
the West will begin to push into the Plains Monday. The accompanying
height falls will help lead to lee cyclogenesis, rapidly
deepening/organizing the low pressure system over the central High Plains.
Gulf moisture return aided by intensifying southerly flow will eventually
lead to increasing shower and thunderstorm chances by Monday evening to
the northwest of the low over the central/northern High Plains, along a
warm front slowly lifting northward through the Missouri and Middle
Mississippi Valleys, and southward ahead of a dry line/rapidly approaching
cold front through the central and southern Plains. An Enhanced Risk of
severe thunderstorms (level 3/5) has been issued by the Storm Prediction
Center from the low pressure center in western Nebraska/South Dakota
arcing southward ahead of the approaching dry line/cold front across
portions of the central Plains. Some more robust, supercell thunderstorms
are expected to produce instances of very large hail, damaging winds, and
a few tornadoes. A Slight Risk (level 2/5) extends southward into the
southern Plains where storm coverage is more uncertain, but any storms
that do develop will still pose the same threat. Additionally, there will
be a conditional threat for some isolated instances of flash flooding,
both along and north of the warm front from the Northern Plains into the
Missouri Valley where widespread, but not quite as potent storms will
exist, and south into portions of the central/southern Plains where more
potent storms will exist, but drier antecedent conditions will limit the
risk.

The storms will progress eastward with the frontal system through the
overnight hours Monday and into the day Tuesday, spreading into the
Mississippi Valley, Great Lakes, and Ohio Valley. Areas where residual
storms from the night before clear, most likely through the Middle
Mississippi Valley southwestward into the Ark-La-Tex, will see a renewed
threat for severe thunderstorms. Another Enhanced Risk has been issued for
portions of southern Iowa, northern Missouri, and western Illinois near
the track of the low pressure center where favorable wind fields will lead
to a locally greater threat of very large hail, damaging winds, and
tornadoes, including the potential for a strong tornado. A Slight Risk
once again extends further south towards the Ark-La-Tex where storms will
likely be more isolated, but still pose a threat for all hazards. A broad
threat for isolated flash flooding will exist over the region very similar
to Monday, with more widespread storms to the north and more isolated but
potent downpours possible to the south.

Further east, another round of storms is expected Monday along and ahead
of a cold front sagging southward through the Upper Ohio/Tennessee Valleys
eastward through the southern Mid-Atlantic. There is a Slight Risk of
severe weather centered around the Tidewater region of Virginia where
enough CAPE for some stronger updrafts will exist, posing a threat for a
few instances of large hail and damaging winds. In the West,
winter-weather related advisories/warnings are in place for higher
elevations of the mountains of the eastern Great Basin and central Rockies
where remaining moisture under the influence of the upper-low is forecast
to lead to snow accumulations of 6-12″+. Another upper-level wave and
accompanying surface frontal system pushing southeastward through the
Cascades Monday and northern Rockies Tuesday will bring a similar chance
for moderate to locally heavy snowfall for higher mountain elevations.

Warmer than average temperatures will continue Monday for most areas of
the central/eastern U.S. as upper-level ridging precedes the system over
the West. Highs generally in the 80s are expected across the
central/southern Plains east through the Mississippi Valley and into the
Mid-Atlantic/Southeast. A few 90s will even be possible over the
central/southern High Plains. These hot temperatures and dry conditions,
along with intensifying winds due to the deepening low pressure system,
have prompted a Critical Risk (level 2/3) of Fire Weather from the Storm
Prediction Center Monday. Warm, similarly above average highs are also
expected across the northern tier, with most locations outside of the
Upper Great Lakes/Interior Northeast forecast to be in the 60s and 70s.
Temperatures will slip a few degrees in general Tuesday, but still remain
above average for most locations. Cooler temperatures will continue Monday
across southern portions of the West under the influence of the upper-low,
with 50s and 60s across California and the Great Basin and 70s in the
Desert Southwest. Conditions will rebound by about 10 degrees on Tuesday
as the upper-low moves eastward over the Plains.

To get your local forecast plus active alerts and warnings click HERE and enter your city, state or zip code.

Above is a 72 hour animation of the forecast. Learn about wave patterns HERE.

Then, looking at the world and of course, the U.S. shows here also. Today we are looking at precipitation.

Please click on “Read More” below to access the full Daily Report issued today.

Federal Deficit Spending (Quarterly) and Inflation. Part 2

The full data sets for the 56 years from 1966 to 2022 show no discernable association patterns (correlations) for U.S. federal deficit spending growth and inflation changes.1  This post continues that analysis by looking specifically at the various regimes of inflation change during the 56-year timeline.


From a photo by Giorgio Trovato on Unsplash

Today Through the Fourth Friday (22 to 28 days) Weather Outlook for the U.S. and a Six-Day Forecast for the World: posted April 14, 2024

It is difficult to find a more comprehensive Weather Outlook anywhere else with the ability to get a local 10-day Forecast also.

This article focuses on what we are paying attention to in the next 48 to 72 hours. The article also includes weather maps for longer-term U.S. outlooks and a six-day World weather outlook which can be very useful for travelers.

First the NWS Short Range Forecast. The afternoon NWS text update can be found here but it is unlikely to have changed very much. The images in this article automatically update.

Short Range Forecast Discussion
NWS Weather Prediction Center College Park MD
Sun Apr 14 2024
Valid 12Z Sun Apr 14 2024 – 12Z Tue Apr 16 2024

…Severe thunderstorms possible over interior portions of the Northeast
on Sunday…

…Lingering locally heavy showers and moderate to heavy snow in
California Sunday…

…Intensifying storm system over the Plains to bring the threat of severe
weather Monday…

…Well above average temperatures across the central/eastern U.S;
Critical Risk of Fire Weather for the central/southern High Plains
Monday….

An upper-level shortwave/surface frontal system dropping southeast through
the Great Lakes into the Upper Ohio Valley/Interior Northeast Sunday will
bring a renewed chance for showers and thunderstorms. Strong wind fields
overlapping a southward moving cold front from central Ohio east into
Pennsylvania will lead to some supercell structures and potentially a
developing line of more intense thunderstorms. The Storm Prediction Center
has issued an Enhanced Risk of Severe Weather (level 3/5) for the threat
of some damaging wind gusts with these storms, along with a few instances
of large hail and perhaps a tornado or two. Some locally heavy downpours
will also be possible, and wet antecedent conditions through the terrain
of the Appalachians could lead to an isolated risk of some flash flooding
across this region as well. Storm chances should quickly diminish
overnight Monday as the frontal system pushes southeastward off the East
Coast.

A deep upper-level low and associated surface frontal system over the West
will continue to progress eastward during the day Sunday. A few areas of
heightened precipitation will continue under the influence of the low,
particularly for portions of southern Oregon/northern California and
southern California. Moderate to locally heavy lower elevation
coastal/valley rain showers, including some thunderstorms, are expected.
Moist onshore/upslope flow along the Transverse Ranges of southern
California may lead to a couple inches of rain on top of wet antecedent
soils from Saturday’s rainfall, with an isolated threat for flooding.
Higher elevation mountain snow will also continue in California, with a
few more inches of accumulations forecast for the Sierra Nevada.
Precipiation chances will spread further inland with the system with some
lower elevation valley rain and higher elevation snow possible for the
northern Rockies and central Great Basin Sunday evening, continuing into
Monday for the Great Basin and spreading into the central Rockies. Some
moderate snow accumulations will be possible for the higher mountain
elevations here as well.

As the system spreads into the Plains, lee cyclogenesis will help to
deepen the surface low pressure system, with intensifying moist southerly
flow from the Gulf leading to widespread shower and thunderstorm
development by Monday evening. This will be most likely for upslope
portions of the northern/central High Plains northwest of the low, along
the arcing cold front south across the central/southern Plains, and
eastward along a warm front into the Middle Mississippi Valley. Strong
buoyancy and strengthening low to upper-level flow will lead to the threat
of severe thunderstorms. The Storm Prediction Center has outlined a broad
Slight Risk of Severe Weather (level 2/5) across the central/Southern
Plains for the threat of large hail, damaging winds, and a few tornadoes.
An Enhanced Risk (level 3/5) has been included over western
Oklahoma/northwest Texas where a locally higher risk for very large hail
exists. While storms will tend to be rather progressive, especially with
southern extent along the cold front, the influx of higher moisture may be
enough for some locally heavier downpours and an attendant isolated risk
for flash flooding. The storms will continue to progress eastward into the
Midwest and Mississippi Valley overnight Monday and into the day Tuesday,
just beyond the current forecast period.

A broad area of well above average temperatures will continue across the
central/eastern U.S. Sunday and Monday as ridging leads the approaching
system over the West. Highs from the central/southern Plains through the
Mississippi Valley and into the Mid-Atlantic/Southeast will be into the
80s. Some 90s will even be possible Sunday over the central/southern High
Plains. Unfortunately, strengthening winds with the intensifying system
over the Plains on top of dry conditions behind a surface dryline through
the central/southern Plains has prompted a Critical Risk of Fire Weather
(level 2/3) from the Storm Prediction Center for portions of the
central/southern High Plains Monday. Conditions will also be warm along
the northern tier as well, with 60s and 70s from the Northern Plains to
the Great Lakes. Cooler temperatures will prevail over most of the West
under the influence of the upper-low and following cold frontal passage,
with 50s and 60s over California Sunday spreading further into the Great
Basin Monday. Highs in the Desert Southwest will generally be in the 70s.
Warmer temperatures will arc northwest into the Pacific Northwest/Northern
Rockies Sunday, with highs in the 60s and 70s, though cooler temperatures
will also follow here Monday.

To get your local forecast plus active alerts and warnings click HERE and enter your city, state or zip code.

Above is a 72 hour animation of the forecast. Learn about wave patterns HERE.

Then, looking at the world and of course, the U.S. shows here also. Today we are looking at precipitation.

Please click on “Read More” below to access the full Daily Report issued today.

WASDE – World Agricultural Supply and Demand Estimates – April 13, 2024.


Once a month USDA issues two reports on World Agriculture: One on Supply and Demand and one on Production.  USDA does not make it easy to find these reports. It is probably because they are produced by two different parts of USDA and the arrangement may change a bit from time to time.

I do not publish this article every month since it is difficult to prepare but this is a time of the year when the information is very relevant and important in terms of:

A. How production may have been impacted by El Nino which is wet for the U.S. but dry for many parts of the World.

B. How Supply and Demand might be impacted by Global Warming and

C. The impact from and on the World GeoPolitical situation.

In this article, I am presenting the summary of the World Supply and Demand Estimates.  In a few days, I will publish an article on production which is a component of Supply. Supply takes into account changes in inventory. It is like the difference between a P&L and a balance sheet or as economists express it flows and stocks.  People who rely on these reports understand the nuances. In this article, I am simply providing the summary of the WASDE report for April of this year.

Some will need to click on “Read More” to access the full article.

Today Through the Fourth Friday (22 to 28 days) Weather Outlook for the U.S. and a Six-Day Forecast for the World: posted April 13, 2024

It is difficult to find a more comprehensive Weather Outlook anywhere else with the ability to get a local 10-day Forecast also.

This article focuses on what we are paying attention to in the next 48 to 72 hours. The article also includes weather maps for longer-term U.S. outlooks and a six-day World weather outlook which can be very useful for travelers.

First the NWS Short Range Forecast. The afternoon NWS text update can be found here but it is unlikely to have changed very much. The images in this article automatically update.

Short Range Forecast Discussion
NWS Weather Prediction Center College Park MD
Sat Apr 13 2024
Valid 12Z Sat Apr 13 2024 – 12Z Mon Apr 15 2024

…Heavy lower elevation rain, mountain snow, and gusty winds forecast for
California…

…Shower and thunderstorm chances from the Great Lakes into the Northeast
this weekend, with a threat for some severe weather in the Upper Ohio
Valley/central Appalachians Sunday…

…Well above average temperatures across the Interior West/central U.S.
Saturday expand to the East Coast Sunday…

A deep upper-level closed low and associated surface frontal system
approaching the California coast this morning will be the dominant driver
of hazardous weather for the country for at least the next several days.
Pacific moisture flowing inland will bring moderate to locally heavy lower
elevation coastal/valley rain showers and thunderstorms to portions of the
Pacific Northwest and California Saturday. The heaviest rain totals are
expected where the moist flow intersects favorable upslope regions along
the central Coastal Ranges into the Transverse Ranges and northern/central
Sierra, and some isolated instances of flooding could occur. Rainfall
amounts overall should come down into the day Sunday as the system moves
further inland and the influx of moisture from the ocean decreases.
However, some locally heavy amounts are once again possible, particularly
for the Transverse Ranges where wet antecedent conditions from the prior
days rainfall will bring another risk of some isolated flooding. In
addition to rainfall, higher elevations in the northern Coastal Ranges,
Klamath Mountains, and Sierra Nevada will see some moderate snowfall
accumulations, with Winter Weather Advisories in place. Much cooler air
settling in following the passage of the cold front and with the deep
upper-low overhead will even lead to some snow for higher elevations in
the mountains around greater Los Angeles. Some light to moderate lower
elevation rain showers and higher elevation snow will also spread into the
Great Basin Saturday and northern Great Basin/Rockies Sunday. Otherwise,
conditions in vicinity of the system will be rather dry as it pushes
through the Rockies and into the Plains by Monday morning, with a renewed
threat for more widespread showers and thunderstorms, including some
severe weather, later Monday just beyond the current forecast period.
Winds will also be rather gusty as the system passes through the West.

Some lingering areas of light to moderate showers continue this morning
across portions of the Great Lakes/Interior Northeast, rotating around a
deep cyclone located in southeastern Canada. Some higher elevations of the
Appalachians may see some snow mix in. Gusty winds will remain in place as
well. Shower chances should taper off into the day as the cyclone moves
away from the U.S. However, a clipper-like system dropping southeast from
Canada will bring a renewed chance of moderate showers and thunderstorms
Sunday to the Interior Northeast, Lower Great Lakes, Upper Ohio Valley,
and central/northern Appalachians. A strengthening upper-level wind field
will overlap enough surface moisture/buoyancy to lead to the threat of
some severe thunderstorms, with a Slight Risk (level 2/5) from the Storm
Prediction Center from eastern Ohio into central Pennsylvania. Damaging
winds will be the main threat, though some large hail and a tornado or two
will be possible as well.

A broad area of high temperatures 10-20 degrees above average will expand
from the Interior West/Plains into the eastern U.S. this weekend as an
upper-level trough departs the East Coast. Some of the greatest anomalies
will be over portions of the northern/central Plains on Saturday, where
highs into the 80s are upwards of 20-30 degrees above average. A few near
record-tying/breaking highs will be possible Sunday across parts of the
central/southern Plains into the Middle Mississippi Valley as highs reach
into the mid-80s to low 90s. The combination of warmer temperatures as
well as dry antecedent conditions and gusty winds have prompted an
Elevated Risk of Fire Weather (level 1/3) from the Storm Prediction Center
for portions of the central/southern High Plains Saturday and Sunday. In
contrast, highs will be cool and well below average in California
Saturday, spreading into portions of the central Great Basin and Desert
Southwest Sunday, as the Pacific system pushes inland.

To get your local forecast plus active alerts and warnings click HERE and enter your city, state or zip code.

Above is a 72 hour animation of the forecast. Learn about wave patterns HERE.

Then, looking at the world and of course, the U.S. shows here also. Today we are looking at precipitation.

Please click on “Read More” below to access the full Daily Report issued today.

12 Apr 2023 Market Close & Major Financial Headlines: The Markets Gapped Sharply Down At The Opening Bell, Continued To Trend Lower, Finally Closing Near Session Lows

Summary Of the Markets Today:

  • The Dow closed down 476 points or 1.24%,
  • Nasdaq closed down 1.62%,
  • S&P 500 closed down 1.46%,
  • Gold $2,361 down $11.90,
  • WTI crude oil settled at $86 up $0.48,
  • 10-year U.S. Treasury 4.520% down 0.056 points,
  • USD index $106.03 up $0.750,
  • Bitcoin $66,994 down $3,333 (4.84%), – Historic high 73,798.25
  • Baker Hughes Rig Count: U.S. -3 to 617 Canada +5 to 141

*Stock data, cryptocurrency, and commodity prices at the market closing.


Click here to read our current Economic Forecast – April 2024 Economic Forecast: Economy Marginally Improving But Growth Will Be Weak


Today’s Economic Releases Compiled by Steven Hansen, Publisher:

I continue to suggest that inflationary pressures are not abating despite the spin from pundits who want the Fed to cut the federal funds rate. I study forces which cause inflation, and part of my reasoning in contained in my economic forecasts. Today, export and import price indices were released – and the disinflation in import prices has disappeared with growth now 0.4% year-over-year. The disinflation in import prices began over one year ago. 15% GDP in the US are imported goods and services – and 49% of all goods sold in the US are imported. One can now expect not only downward pressure on GDP (as imports are subtracted from GDP), but upward pressure from imports on inflation

University of Michigan Consumer Sentiment moved sideways for the fourth straight month, as consumers perceived few meaningful developments in the economy. Since January, sentiment has remained remarkably steady within a very narrow 2.5 index point range, well under the 5 points necessary for a statistically significant difference in readings. Consumers perceived little change in the state of the economy since the start of the new year. Expectations over personal finances, business conditions, and labor markets have all been stable over the last four months. However, a slight uptick in inflation expectations in April reflects some frustration that the inflation slowdown may have stalled. Overall, consumers are reserving judgment about the economy in light of the upcoming election, which, in the view of many consumers, could have a substantial impact on the trajectory of the economy.

Here is a summary of headlines we are reading today:

Click on the “Read More” below to access these, other headlines, and the associated news summaries moving the markets today.

NOAA Updates its ENSO Alert on April 11, 2024 – The El Nino Advisory/La Nina Watch Continues. Not Much Change on the Timing – Published April 11, 2024

On the second Thursday of every month, NOAA (really their Climate Prediction Center CPC) issues its analysis of the status of ENSO. This includes determining the Alert System Status.  NOAA again describes their conclusion as “ENSO Alert System Status: El Nino Advisory La Nino Watch”

The exact timing of the transition is not very clear which will impact the reliability of the Seasonal Outlook to be issued next Thursday.

We have included an ENSO Blog article by Emily Becker that includes two very interesting animations. .


CLIMATE PREDICTION CENTER ENSO DISCUSSION

The second paragraph is what is important:

“The most recent IRI plume indicates a transition to ENSO-neutral during spring 2024, with La Niña potentially developing during late summer 2024.  The forecast team continues to favor the dynamical model guidance, which is slightly more accurate than statistical models during this time of year.  La Niña tends to follow strong El Niño events, which also provides added confidence in the model guidance favoring La Niña.  In summary, a transition from El Niño to ENSO-neutral is likely by April-June 2024 (85% chance), with the odds of La Niña developing by June-August 2024 (60% chance).”

Below is the middle paragraph from the discussion last month.

“The most recent IRI plume indicates a transition to ENSO-neutral during spring 2024, with La Niña potentially developing during summer 2024 .  While different types of models suggest La Niña will develop, the forecast team favors the dynamical model guidance, which is slightly more accurate for forecasts made during this time of year.  Even though forecasts made through the spring season tend to be less reliable, there is a historical tendency for La Niña to follow strong El Niño events.  In summary, a transition from El Niño to ENSO-neutral is likely by April-June 2024 (83% chance), with the odds of La Niña developing by June-August 2024 (62% chance).”

We now provide additional details.  The level of uncertainty with respect to how this El Nino will play out has changed a bit. NOAA is not quite as confident that we will have a LaNina. It is a slight change.

CPC Probability Distribution

Here are the new forecast probabilities. The probabilities are for three-month periods e.g. MAM stands for March/April/May.

Here is the current release of the probabilities:

This chart shows the forecasted progression of the evolution of ENSO from the current El Nino State to Neutral and by the summer to La Nina.  This kind of bar chart is not very good at showing uncertainty.

Here is the forecast from last month.

The analysis this month and last month are not very different.
Click on “Read More” to read the rest of this article.

Today Through the Fourth Friday (22 to 28 days) Weather Outlook for the U.S. and a Six-Day Forecast for the World: posted April 12, 2024

It is difficult to find a more comprehensive Weather Outlook anywhere else with the ability to get a local 10-day Forecast also.

This article focuses on what we are paying attention to in the next 48 to 72 hours. The article also includes weather maps for longer-term U.S. outlooks and a six-day World weather outlook which can be very useful for travelers.

First the NWS Short Range Forecast. The afternoon NWS text update can be found here but it is unlikely to have changed very much. The images in this article automatically update.

Short Range Forecast Discussion
NWS Weather Prediction Center College Park MD
356 AM EDT Fri Apr 12 2024

Valid 12Z Fri Apr 12 2024 – 12Z Sun Apr 14 2024

…Powerful low pressure system to produce gusty winds and heavy rain
across parts of the Great Lakes, Ohio Valley, and Northeast through
Friday…

…Lower elevation rain and mountain snow to enter California on
Saturday…

…Well above average temperatures forecast to surge into the
northern/central Plains this weekend…

A broad area of showers and thunderstorms across the Midwest and into the
Northeast will continue Friday as a deep cyclone over the Great Lakes
slowly shifts into Canada. Showers should taper off from west to east
across the Great Lakes/Ohio Valley as the low departs, with more moderate
to heavy rainfall most likely along the Appalachians into the Lower Great
Lakes. The heaviest rainfall is expected ahead of a trailing cold front
through New England where an influx of moist southeasterly flow off the
Atlantic along upslope portions of the northern Appalachians contributes
to some more potent storms and rain totals. A Slight Risk of Excessive
Rainfall (level 2/4) has been issued for portions of New Hampshire and
Maine along and ahead of the White Mountains where the combination of
heavy rain and snowmelt could lead to some instances of flooding. Some
lighter lingering showers will last into Saturday, particularly for
interior portions of the Northeast. Conditions will also remain breezy
across the region with Wind Advisories in place for portions of the Great
Lakes, Appalachians, and New England.

In the West, some light lower elevation rain showers and higher
elevation/mountain snow showers will be possible along a frontal system
pushing southward through portions of the northern Great Basin and Pacific
Northwest Friday. An approaching Pacific system will bring higher
precipitation chances spreading southward into California later Friday and
into the day Saturday. Some moderate to locally heavy showers will be
possible along the coast, with accumulating snowfall expected for the
Northern Coastal Ranges, Klamath Mountains, and Sierra Nevada. A Winter
Weather Advisory has been issued for southern portions of the Sierra where
6-12 inches of snow is forecast. Gusty winds are expected here as well,
especially along the area mountain ranges.

Cooler, below average temperatures will spread eastward from the Lower
Great Lakes/Ohio Valley/Tennessee Valley Friday into the
Northeast/Mid-Atlantic Saturday following recent cold front passage. Highs
will tend to be at or just below average further south into the Southeast
and Florida. A broad area of much above average temperatures across the
West/Plains Friday will expand into the Mississippi Valley Saturday as
upper-level ridging shifts eastward over the central U.S. The greatest
anomalies will reside over the northern and central Plains Saturday, where
highs into the 80s are upwards of 20-25 degrees above normal. Much cooler
temperatures will arrive in California Saturday as the Pacific system
begins to move inland.

To get your local forecast plus active alerts and warnings click HERE and enter your city, state or zip code.

Above is a 72 hour animation of the forecast. Learn about wave patterns HERE.

Then, looking at the world and of course, the U.S. shows here also. Today we are looking at precipitation.

Please click on “Read More” below to access the full Daily Report issued today.