Authored by Steven Hansen
EconCurrent‘s Economic Index again modestly improved and is slightly in positive territory. This does not mean the economy is going gangbusters but is continuing to plod along. There remain three major indicators that suggest a recession is coming. Read on to understand the currents affecting our economic growth.

Analyst Summary of this Economic Forecast
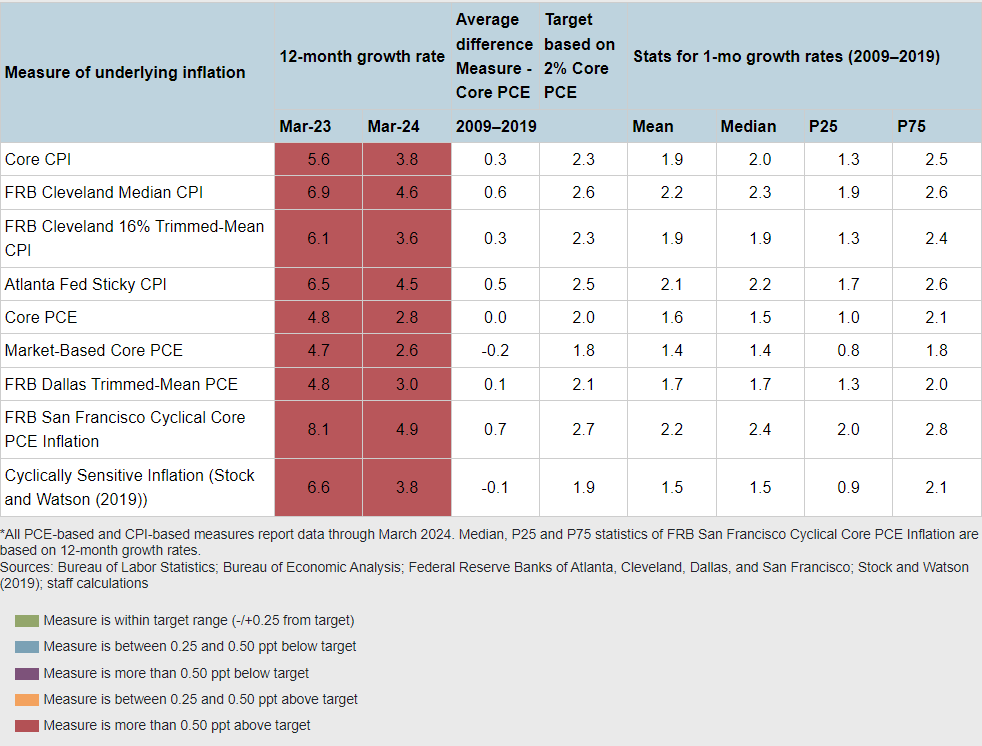
It now seems the Federal Reserve is done raising the federal funds rate. The movement (or non-movement) of the federal funds rate will affect any economic forecast. It is inflation that causes the movement of the federal funds rate – as well as the rates on bonds and interest rates.
EconCurrents follows the Federal Reserve Bank of Atlanta’s Underlying Inflation Dashboard which uses data from the US Bureau of Economic Analysis, the Federal Reserve Bank of San Francisco, and the Federal Reserve Bank of Dallas. Inflation is little changed over the last 3 months. It is possible at this point that no further rate increases are needed as inflation may continue to slowly moderate – however, it is more likely that no further rate increases will delay the Fed’s ability to begin moderating the federal funds rate as inflationary pressures remain high.
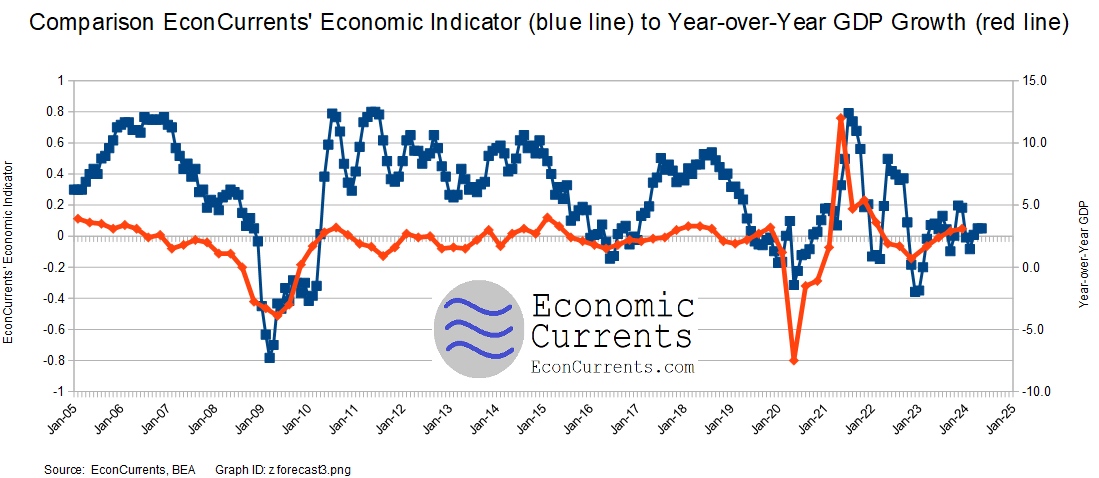
Our index’s design is to forecast Main Street growth, whilst Gross Domestic Product (GDP) is not designed to focus on the economy at the Main Street level. At this point, I expect the Main Street economy to be little changed in the second quarter of 2024 and the weak growth seen in 1Q2024 will continue.
There are several flags indicating a recession – a yield curve inversion, U.S. tax receipts, and truck transport employment. I do not write these flags off – but at this point, the vast abundance of forward-looking and coincident data are not recessionary.
Note that the quantitative analysis that builds our model of the economy does not include housing, personal income, or expenditures data sets.
Note that many graphs auto-update so the words used in this forecast may not match the graphics. The Richmond Fed produces a PDF file with a current set of the US National Economic Indicators [click here to view this PDF].
This post will summarize the:
- special indicators,
- leading indicators,
- predictive portions of coincident indicators,
- review of the technical recession indicators, and
- interpretation of our index – EconCurrents Economic Index (EEI) – which is built of mostly non-monetary “things” that are indicative of the direction of the Main Street economy at least 30 days in advance.
Special Indicators:
The consumer is spending a historically high proportion of their income. This does not leave much room for higher economic growth. Note that the spending ratio currently has changed little in the last 7 months but appears to be in a marginally worsening trend.
Seasonally Adjusted Spending’s Ratio to Income (an increasing ratio means the Consumer is spending more of Income)
if the above graph does not appear [click here] to view
The St. Louis Fed produces a Smoothed U.S. Recession Probabilities Chart that currently does not indicate an oncoming recession.
Smoothed recession probabilities for the United States are obtained from a dynamic-factor markov-switching model applied to four monthly coincident variables: non-farm payroll employment, the index of industrial production, real personal income excluding transfer payments, and real manufacturing and trade sales. This model was originally developed in Chauvet, M., “An Economic Characterization of Business Cycle Dynamics with Factor Structure and Regime Switching,” International Economic Review, 1998, 39, 969-996. (http://faculty.ucr.edu/~chauvet/ier.pdf)
if the above graph does not appear [click here] to view
Sahm Recession Indicator signals the start of a recession when the three-month moving average of the national unemployment rate (U3) rises by 0.50 percentage points or more relative to its low during the previous 12 months. This index remains higher than normal for a period of economic expansion.
if the above graph does not appear [click here] to view
EconCurrents reviews the relationship between the year-over-year growth rate of non-farm private employment and the year-over-year real growth rate of retail sales. This index remains deep in negative territory. When retail sales grow faster than the rate of employment gains (above zero on the below graph) – a recession is not imminent. However, this index has many false alarms
Growth Relationship Between Retail Sales and Non-Farm Private Employment – Above zero suggests economic expansion
if the above graph does not appear [click here] to view
The growth rate of real gross domestic product (GDP) is the headline view of economic activity, but the official estimate is released with a delay. Atlanta’s Fed GDPNow forecasting model provides a “nowcast” of the official estimate before its release. EconCurrents does not believe GDP is a good tool to view what is happening at the Main Street level – but there are correlations.
Latest estimate: 2.3 percent — March 29, 2024
The GDPNow model estimate for real GDP growth (seasonally adjusted annual rate) in the first quarter of 2024 is 2.3 percent on March 29, up from 2.1 percent on March 26. After recent releases from the US Census Bureau and the US Bureau of Economic Analysis, the nowcast of first-quarter real personal consumption expenditures growth increased from 1.9 percent to 2.6 percent, while the nowcast of the contribution of the change in real net exports to first-quarter real GDP growth decreased from -0.16 percentage points to -0.47 percentage points.
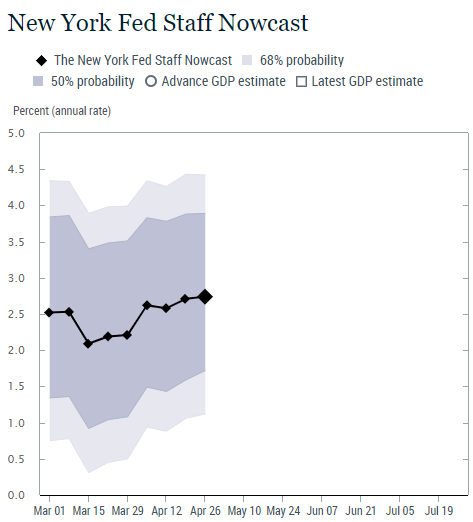
The New York Fed also publishes a real-time GDP estimate called Nowcast. The black line in the chart below represents the evolution of the Staff Nowcast, with the diamonds indicating the point estimate at each update, based on information available at that time.
- The New York Fed Staff Nowcast for 2024:Q1 is 1.9%, with the 50% probability interval at [0.8, 2.9] and the 68% interval at [0.3, 3.4]. The Staff Nowcast stands at 2.2% for 2024:Q2.
- News from this week’s data releases left the estimates for both 2024:Q1 and 2024:Q2 largely unchanged.
- A small positive surprise from personal consumption data was offset by a negative impact from data revisions in both quarters.
A yield curve inversion historically has been an accurate predictor of an impending recession. A yield curve inversion is where short-term bonds have a higher yield than longer-term bonds. The graph below shows inversions before the US recessions. EconCurrents does not believe the yield curve is a reliable indicator of recessions in the New Normal where monetary policy uses extraordinary tools – but like a stopped clock, it can be correct at times. But note that a recession normally begins after the yield curve recovers into positive territory. Note that the yield curve remains deep in inversion.
if the above graph does not appear [click here] to view
Asset prices have been driven by liquidity. Measuring liquidity (blue line on the graph below) should be a good indicator of inflation. This graph currently indicates that the Consumer Price Index (CPI) rate of moderation should continue to be little changed (red line on the graph below). The bottom line here is that liquidity (blue line on the graph below) remains elevated and this puts upward pressure on inflation.
if the above graph does not appear [click here] to view
Continuing the discussion on inflation, it is now beginning to take up a sizeable chunk of the federal budget. Unfortunately, the graph below is updated only quarterly – and is now complete through 4Q2023. It does show that in 4Q2023, 15.9% of federal expenditure went to interest payments on debt – up from 15.4% in 3Q2023. It is not a major deal yet but could be if it starts approaching the previous high of 23.5% in 1Q1991.
if the above graph does not appear [click here] to view
Special Indicators Conclusion:
Most economic releases are based on seasonally adjusted data that are revised for months after issuance. The real trends in a particular release may not be obvious for many months due to data gathering and seasonality-adjusting methodologies. The special indicators generally show forces that restrain economic growth. This should be balanced against both the GDP forecasting models which show modest economic growth.
The Leading Indicators:
The leading indicators are for the most part monetary-based. EconCurrents’ primary worry in using monetary-based methodologies to forecast the economy is that monetary policy is affecting historical relationships. EconCurrents does not use data from any leading indicator in its economic index. Leading indices in this post look ahead six months – and are all subject to backward revision.
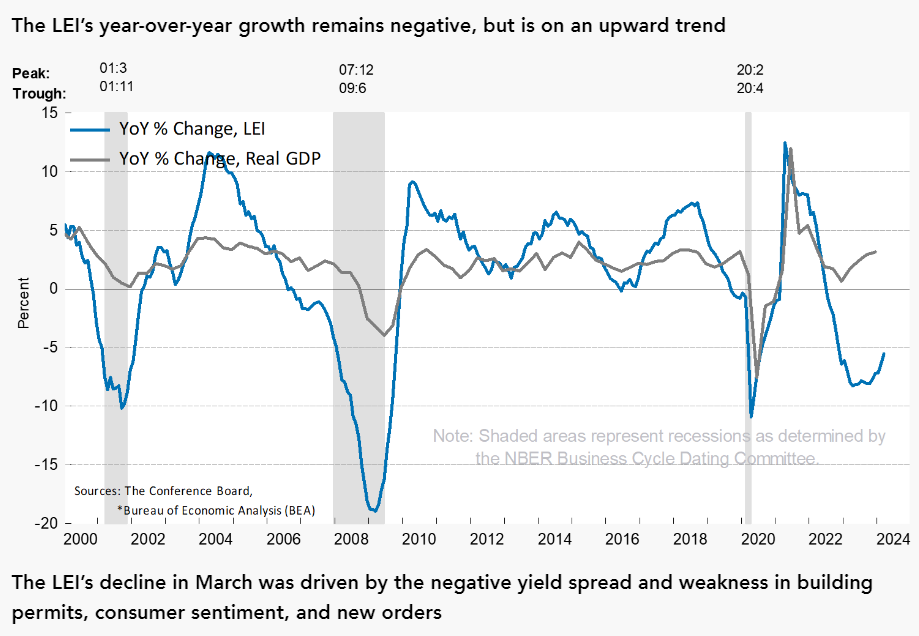
The Conference Board’s Leading Economic Indicator (LEI) – the LEI has historically begun contracting well before a recession but has had many false contractions. What The Conference Board states: “Despite February’s increase, the Index still suggests some headwinds to growth going forward. The Conference Board expects annualized US GDP growth to slow over the Q2 to Q3 2024 period, as rising consumer debt and elevated interest rates weigh on consumer spending“.
File: lei1.png
The nonfinancial leverage subindex of the National Financial Conditions Index – a weekly index produced by the Chicago Fed signals both the onset and duration of financial crises and their accompanying recessions. EconCurrents now believe this index may be worthless in real-time as the amount of backward revision is excessive – so we present this index for information only. This index was designed to forecast the economy six months in advance. The chart below shows the current index values and a recession usually occurs months to years after the trend line changes from negative to positive.
if the above graph does not appear [click here] to view
Leading Indicators Conclusion: The takeaway is mixed.
- The Conference Board (LEI) expects the economy to weaken.
- The nonfinancial leverage subindex of the National Financial Conditions Index is not in a territory associated with recessions. However, current monetary policy is likely preventing this index from rising above zero.
Predictive Coincident and Lagging Indicators
Here is a run-through of the most economically predictive coincident indices which EconCurrents believes can give up to a six-month warning of an impending recession – and do not have a history of producing many false warnings. EconCurrents does not use any of these indicators in its economic forecast. Consider that every recession has different characteristics and dynamics – and a particular index may not contract during a recession, or start contracting after the recession is already underway.
Truck transport portion of employment – to search for impending recessions. Look at the year-over-year zero growth line. For the last two recessions, it has offered a six-month warning of an impending recession with only one false warning. Transport is an economic warning indicator because it moves goods well before final retail sales occur. Until people stop eating or buying goods, transport will remain one of the primary economic pulse points. When this sector turns robotic in the coming years – this measure will become useless – but currently, the shift from box stores to e-commerce is creating much more employment in this sector. Either way – this index may not be capable of alerting the next recession. Transport employment growth is now below the zero growth line. As transport provides a six-month recession warning – the implication is that any possible recession would have began in the first quarter of 2024.
if the above graph does not appear [click here] to view
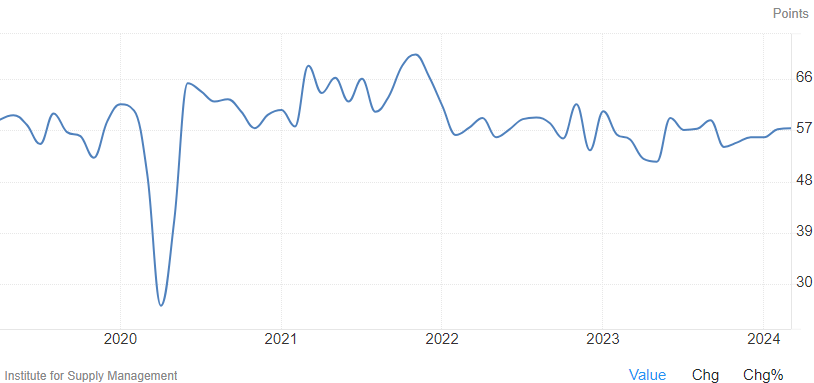
Business Activity ISM US Services Activity Index – This index is noisy. The index remains slightly above 55 (below 55 is a warning that a recession might occur, whilst below 50 is almost proof a recession is underway). This index may not provide timely warnings of recessions.
File: ism.png source: https://tradingeconomics.com/united-states/ism-non-manufacturing-business-activity
US Treasury Tax Receipts – Tax receipts’ year-over-year growth generally goes negative during a recession. Currently, tax receipts’ year-over-year growth continues in negative territory.
if the above graph does not appear [click here] to view
Census Bureau Index of Economic Activity – The U.S. Census Bureau Index of Economic Activity (IDEA) is an aggregation of 15 of the Census Bureau’s primary economic data series that provides a single time series constructed as a weighted average. The current value is negative which indicates the economy is growing slightly above the historical rate of growth.

idea.png
My favorite coincident indicator is the Chicago Fed National Activity Index (CFNAI) – a monthly index designed to gauge overall economic activity and related inflationary pressure. The index is a weighted average of 85 indicators of growth in national economic activity drawn from four broad categories of data: 1) production and income; 2) employment, unemployment, and hours; 3) personal consumption and housing; and 4) sales, orders, and inventories. Economic forecasting uses the 3-month moving average (blue line on the graph below). GDP is the red line on the graph below. A recession is likely to occur if the 3-month moving average falls below -0.7. This index is currently well above levels associated with recessions.
if the above graph does not appear [click here] to view
Predictive Coincident Index Conclusion:
The predictive indices indicate slow growth EXCEPT for truck transport employment and treasury tax receipts which are in territory associated with recessions.
Technical Requirements of a Recession
Sticking to the current technical recession criteria used by the NBER:
The NBER’s traditional definition of a recession is that it is a significant decline in economic activity that is spread across the economy and that lasts more than a few months. The committee’s view is that while each of the three criteria—depth, diffusion, and duration—needs to be met individually to some degree, extreme conditions revealed by one criterion may partially offset weaker indications from another. For example, in the case of the February 2020 peak in economic activity, we concluded that the drop in activity had been so great and so widely diffused throughout the economy that the downturn should be classified as a recession even if it proved to be quite brief. The committee subsequently determined that the trough occurred two months after the peak, in April 2020.
… The determination of the months of peaks and troughs is based on a range of monthly measures of aggregate real economic activity published by the federal statistical agencies. These include real personal income less transfers (PILT), nonfarm payroll employment, real personal consumption expenditures, wholesale-retail sales adjusted for price changes, employment as measured by the household survey, and industrial production. There is no fixed rule about what measures contribute information to the process or how they are weighted in our decisions.
Data for all indicators can be found and downloaded from FRED, the data website maintained by the Federal Reserve Bank of St. Louis. These data series have been collected on a single webpage. However, I have created a graph below looking at the month-over-month change (note that multipliers have been used to make changes more obvious).
Month-over-Month Growth Personal Income minus transfer payments (blue line), Employment (red line), Industrial Production (green line), Business Sales (orange line)
if the above graph does not appear [click here] to view
In the above graph, if a line falls below 0 (black line) – that sector is contracting from the previous month. Half of the four sectors are in positive territory – with personal income and retail sales in negative territory. Another way to look at the same data sets is in the graph below which uses indexed real values from the trough of the Great Recession.
Indexed Growth Personal Income minus transfer payments (red line), Employment (green line), Industrial Production (blue line), Business Sales (orange line)
if the above graph does not appear [click here] to view
NBER Recession Marker Bottom Line – only industrial production is insignificantly warning of a potential recession.
EconCurrents believes that the New Normal economy has different dynamics than most economic models are using.
Economic Forecast Data
The EconCurrents Economic Index (EEI) is designed to spot Main Street and business economic turning points. The three-month rolling index value is now a POSITIVE 0.05 – a modest improvement from last month’s +0.01. The economic forecast is based on the 3-month moving average as the monthly index is very noisy. A positive value of the index represents Main Street’s economic expansion. Readings below 0.4 indicate a weak economy, while readings below 0.0 indicate contraction. It is not unusual for a dip below zero as the Main Street economy is more volatile – and it would take several months of contraction or a significant contraction to signal a recession.
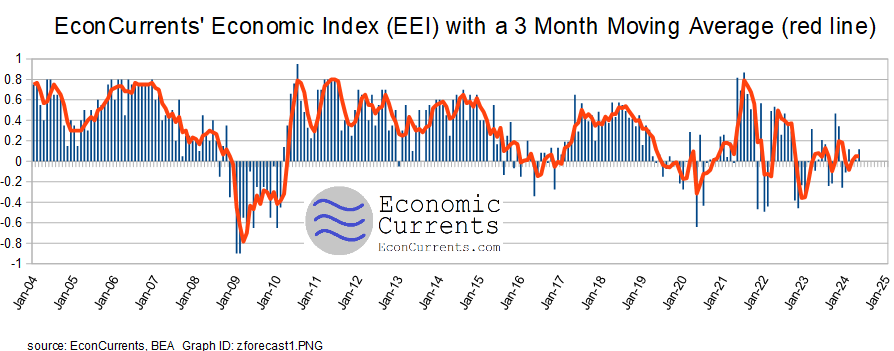
A summary of elements affecting our economic index:
- The government portion relating to business and Main Street was little changed.
- The business portion’s rate of growth modestly improved.
- The consumer portion rate of growth was little changed.
The EEI is a non-monetary-based economic index that counts “things” that are indicative of the direction of the Main Street economy. Note that the EconCurrents Economic Index is not constructed to mimic GDP (although there are correlations, the turning points may be different), and tries to model the economic rate of change seen by businesses and Main Street. The vast majority of the inputs to this index use data not subject to backward revision.
The red line on the graph above is the 3-month moving average.
Consumer and business behavior (which is the basis of the EEI) either leads or follows old-fashioned industrial age measures such as GDP depending on the primary dynamic(s) driving the economy. The Main Street sector of the economy lagged GDP in entering and exiting the 2007 Great Recession.
As EconCurrents continues to backcheck its model, from time to time slight adjustments are made to the data sets and methodology to align it with the actual coincident data. To date, when any realignment was done, there have been no changes for trend lines or recession indications. Most changes to date were to remove data sets that had unacceptable backward revisions, became too volatile, or were discontinued.
Analysis of Economic Indicators:
EconCurrents analyzes all major economic indicators and summarizes them in our daily newsletter [sign up here]. The table below contains hyperlinks to the publisher of the indicator. The right column “Predictive” means this particular indicator has a leading component (usually other than the index itself) – in other words, has a good correlation to future economic conditions.
