Today Through the Fourth Friday (22 to 28 days) Weather Outlook for the U.S. and a Six-Day Forecast for the World: posted June 16, 2024

This article focuses on what we are paying attention to in the next 48 to 72 hours. The article also includes weather maps for longer-term U.S. outlooks and a six-day World weather outlook which can be very useful for travelers.

First the NWS Short Range Forecast. The afternoon NWS text update can be found here after about 4 p.m. New York time but it is unlikely to have changed very much from the morning update. The images in this article automatically update.

Short Range Forecast Discussion
NWS Weather Prediction Center College Park MD
Sun Jun 16 2024
Valid 12Z Sun Jun 16 2024 – 12Z Tue Jun 18 2024

…Multiple rounds of heavy rain and severe thunderstorms are expected to
impact locations from the northern Plains to the upper Midwest for the
next couple of days…

…Late-season wet snow is forecast for the northern Rockies Monday and
Tuesday…

…A heat wave will quickly spread from the Plains today, into the Great
Lakes/Upper Ohio Valley on Monday, and into the Northeast on Tuesday…

…A plume of tropical moisture will bring an increasing threat of heavy
rain and flash flooding to the central Gulf Coast late Sunday into Monday,
shifting toward the western Gulf Coast by Tuesday…

As a high pressure system brings fair weather and a fresh dose of cooler
than normal temperatures into the Northeast and Mid-Atlantic this weekend,
a heat wave is emerging across the Midwest into the Ohio Valley ahead of a
complex low pressure system developing over the northern Plains. A
thunderstorm complex containing severe weather is in progress early this
morning in association with the intensifying low pressure complex. The
thunderstorms will quickly move northeast into southern Canada today but
additional jet stream energy moving across the northern Rockies will help
develop a new low pressure system over the central Plains later today.
This system will rapidly develop and expand the next round of showers and
thunderstorms across the northern Plains tonight, and heading into the
upper Midwest on Monday. Severe thunderstorms with heavy downpours can be
expected to accompany this round of inclement over the upper Midwest after
the latest round of moderate to heavy rain and strong thunderstorms in the
same area early this morning diminishes and moves east into the upper
Great Lakes.

By Tuesday, yet another upper trough with an energetic jet stream will
move quickly into the Pacific Northwest. This system will usher a dose of
even colder air through the Pacific Northwest and northern Rockies, where
a round of late-season wet snow is expected to persist over the
higher-elevations of the northern Rockies Monday into Tuesday. A Winter
Storm Watch is in effect for these higher-elevations. In addition, Freeze
and Frost Warnings are in effect over portions of the interior Pacific
Northwest. This energetic system will also bring quite a bit of wind
across the Great Basin and the northern Rockies on Monday, reaching into
the central Rockies and northern Plains by Tuesday morning. As the low
pressure center over the central High Plains intensifies and heads
northeast across the northern Plains, a renewed round of heavy rain and
severe thunderstorms will likely develop and impact the same general
region of upper Midwest across north-central Minnesota by Tuesday morning,
where a moderate risk of flash flooding is anticipated.

In stark contrast to the cool/cold, windy, and even snowy weather across
the Northwest, a heat wave is quickly emerging ahead of the low pressure
complex from the central Plains, upper Midwest, and into the Ohio Valley.
The heat will surge into the Northeast by Tuesday where high temperatures
well up into the 90s are forecast as far north as Vermont and New
Hampshire.

Farther south from Central America across southern Florida and through the
western Atlantic, a plume of tropical moisture lurking across these areas
will shift westward into the Gulf of Mexico and begin to head toward the
central Gulf Coast region late Sunday into Monday. Showers and embedded
thunderstorms associated with this moisture plume are expected to bring an
increasing threat of heavy rain first along the central Gulf Coast region
during the next couple of days, with a gradual westward shift in the heavy
rainfall axis toward the western Gulf Coast by Tuesday. Meanwhile, the
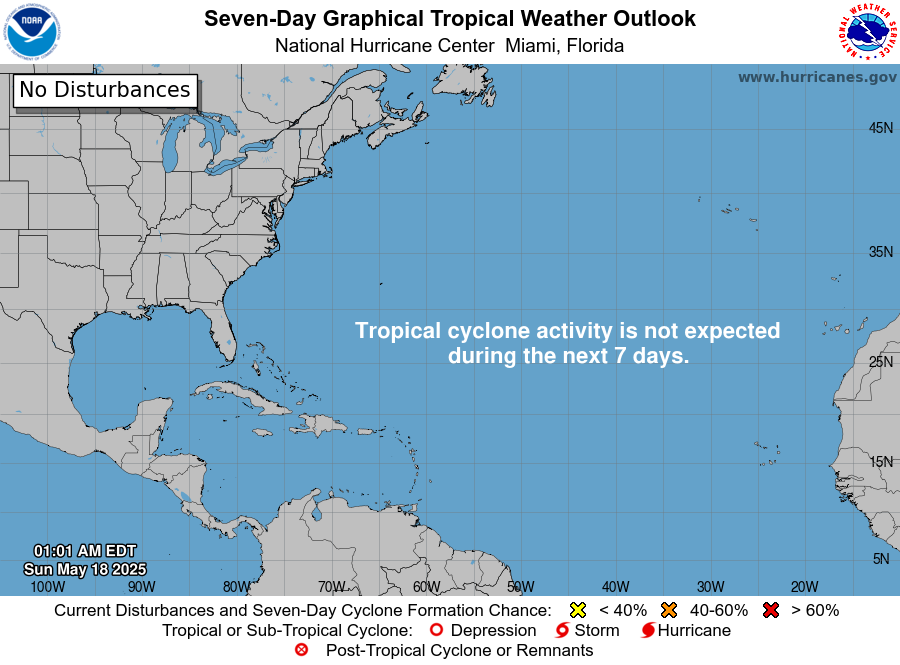
National Hurricane Center continues to monitor the potential for a
tropical cyclone to form over the southwestern Gulf of Mexico through the
next few days. It appears that east to northeasterly winds will gradually
strengthen especially along the western Gulf Coast region by Tuesday
morning as pressure gradually falls in the Gulf of Mexico.

To get your local forecast plus active alerts and warnings click HERE and enter your city, state or zip code.

Learn about wave patterns HERE.

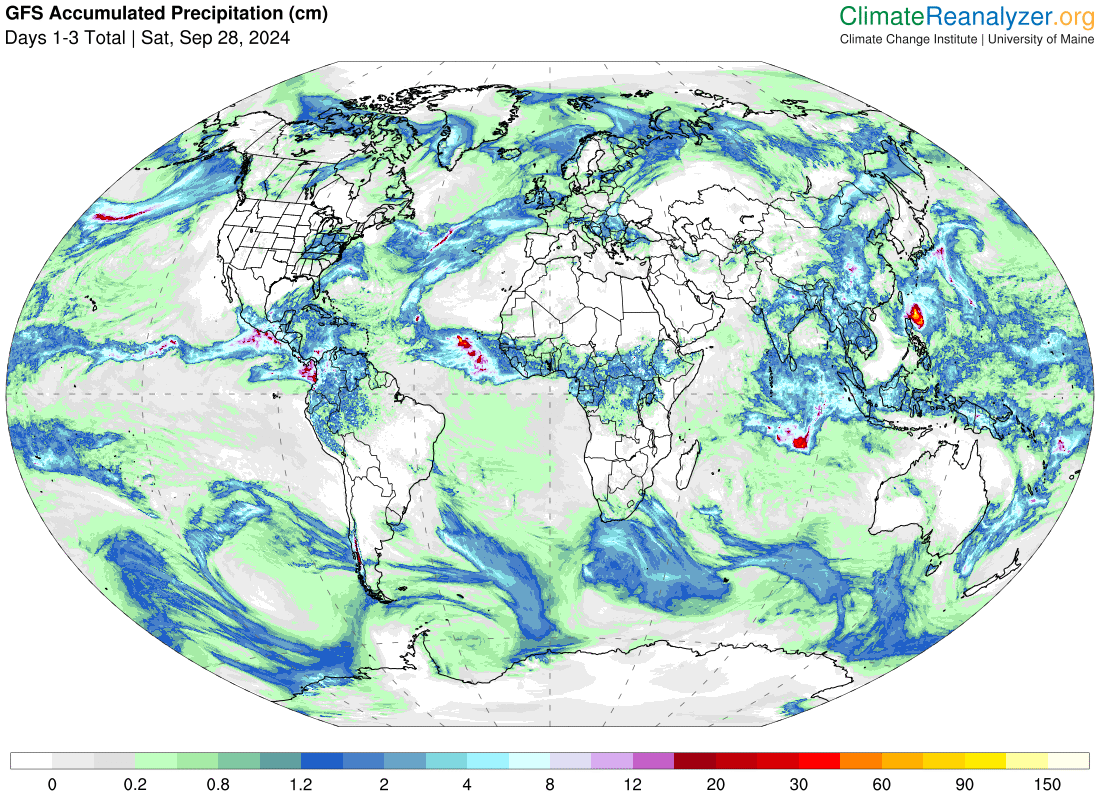
Then, looking at the world and of course, the U.S. shows here also. Today we are looking at precipitation.

Please click on “Read More” below to access the full Daily Report issued today.

M2 Money Supply and CPI Inflation. Part 3

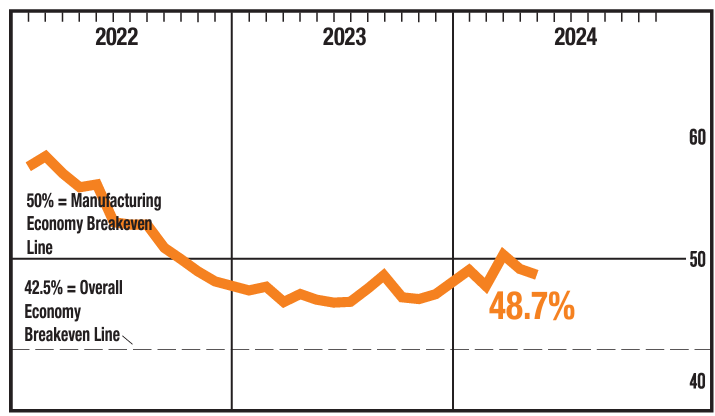
The full data sets for the 64 years from 1959 to 2022 show no discernable association patterns (correlations) for M2 money supply growth and consumer inflation changes.1  This post continues that analysis by looking specifically at the various regimes of inflation change during the 64-year timeline. This article analyzes the association of CPI with M2 during the four periods from 1959 to 2022 with negative inflation changes (disinflation/deflation) surges.


Image by Kevin Schneider from Pixabay

Cloud Seeding to Enhance Precipitation June 15, 2024

Global Warming and Population Growth, create a need for more Water.

There are a number of different ways to address a shortage of water:

  1. Get equal value from less water  (Conservation)

  2. Find more water from surface and groundwater  sources

  3. Have more precipitation (Increase the velocity of water)

In this article, we discuss “Finding More Water by Using Cloud Seeding to Increase Precipitation”.

Last Saturday we published an article based on a talk by Dr. Bruce M. Thomson, Regents Professor of Civil Engineering at the University of New Mexico. He gave a very good presentation on obtaining more water from brackish water, oilfield water, and importing water. You can access that article HERE.

Let us get started with today’s article on using cloud seeding to increase precipitation.

Weather modification with cloud seeding was discovered by General Electric at the Schenectady New York Laboratory.  Initially, on July 14, 1946, they used Dry Ice. Of course, prior to that time, there were other attempts at increasing precipitation

Cloud seeding can be used for three different purposes:  Precipitation enhancement, Hail suppression and fog dispersal.  In this article, I am focusing on precipitation enhancement.

Some will need to click on “Read More” to access the full article.

Today Through the Fourth Friday (22 to 28 days) Weather Outlook for the U.S. and a Six-Day Forecast for the World: posted June 15, 2024

This article focuses on what we are paying attention to in the next 48 to 72 hours. The article also includes weather maps for longer-term U.S. outlooks and a six-day World weather outlook which can be very useful for travelers.

First the NWS Short Range Forecast. The afternoon NWS text update can be found here after about 4 p.m. New York time but it is unlikely to have changed very much from the morning update. The images in this article automatically update.

Short Range Forecast Discussion
NWS Weather Prediction Center College Park MD
Sat Jun 15 2024
Valid 12Z Sat Jun 15 2024 – 12Z Mon Jun 17 2024

…Multiple rounds of severe thunderstorms and locally heavy rain expected
to impact various locations in the northern and central U.S. through the
next couple of days…

…Late-season wet snow is forecast for the northern Rockies beginning on
Monday…

…A plume of tropical moisture is forecast to reach the central Gulf
Coast on Monday…

…A heat wave will quickly spread from the northern Plains this weekend
into the Great Lakes on Monday…

As a series of fronts pushes the showers and storms off the East Coast
early this morning, an active and changeable weather pattern will
establish across the Pacific Northwest. The unseasonably cold and
blustery conditions across this region will be in stark contrast with the
heat that is forecast to quickly spread from the northern Plains this
weekend, reaching into the Great Lakes on Monday. Areas in between these
temperature extremes will be under an active storm track where low
pressure systems will develop and move through in quick succession. The
first round of showers and storms associated with a leading system is
forecast to spark thunderstorm activity from the central Plains early this
morning to the upper Midwest by tonight. Multiple rounds of heavy rain
associated with these storms could lead to areas of flash flooding between
eastern Nebraska and northern Wisconsin. Additionally, a trailing and
stronger low pressure system is forecast to intensify and move quickly
across the northern Plains tonight. This system will help produce strong
to severe thunderstorms across parts of eastern Montana into North and
South Dakota. Unseasonably cold and windy weather will continue into
Sunday and Monday across the Northwest as yet another cold upper trough
reaches the Pacific Northwest. This system will reinforce the
unseasonably cold and windy conditions across the region on Monday along
with wet snow moving into the northern Rockies, therefore prompting the
issuance of Winter Storm Watches. Meanwhile, an area of rain and
thunderstorms is expected to develop and expand across the northern Plains
toward the upper Midwest where a stationary front strengthens ahead of a
developing low pressure system over the central High Plains.

Across the Florida Peninsula, the threat of heavy rain continues to
diminish as the main tropical moisture plume is forecast to swing farther
west and head toward the central Gulf Coast during the next couple of
days. Nevertheless, some thunderstorms that manage to develop over
southern Florida could result in local flooding issues given the already
saturated soil. By Monday morning, heavy rain associated with the
tropical moisture plume could begin impacting the central Gulf Coast
region. In contrast, a refreshingly dry airmass behind a cold front
should lead to beautiful weather this Father’s Day weekend throughout the
Northeast, Mid-Atlantic, and Ohio Valley.

The other main weather story this weekend will be the simmering heat
impacting areas from the Southwest to the Gulf Coast and Southeast. Highs
are forecast to reach the triple digits throughout much of the Desert
Southwest, with upper 90s stretching from the Southeast to parts of the
Southern Plains. Above average temperatures are also forecast across the
central Great Basin and northern Plains ahead of a cold front, with well
below average temperatures encompassing the Pacific Northwest. By Sunday,
an upper level ridge is anticipated to begin building across the Eastern
U.S., with anomalous heat starting in much of the Midwest, Central Plains,
and Tennessee Valley. Highs are forecast to reach the upper 90s, with
maximum heat indices near 105 degrees. When combined with warm overnight
lows, major heat risk could affect anyone without effective cooling and/or
adequate hydration. Be sure to remain weather aware and follow proper heat
safety!

To get your local forecast plus active alerts and warnings click HERE and enter your city, state or zip code.

Learn about wave patterns HERE.

Then, looking at the world and of course, the U.S. shows here also. Today we are looking at precipitation.

Please click on “Read More” below to access the full Daily Report issued today.

14 Jun 2024 Market Close & Major Financial Headlines: Markets Opened Moderately Below The Unchanged Line, Continued To Trade Haphazardly Sideways, Ultimately Closing Mixed

Summary Of the Markets Today:

  • The Dow closed down 58 points or 0.15%,
  • Nasdaq closed up 0.12%, (Closed at 17,668,
  • S&P 500 closed down 0.04%,
  • Gold $2,349 up $30.40,
  • WTI crude oil settled at $79 down $0.07,
  • 10-year U.S. Treasury 4.211 down 0.029 points,
  • USD index $105.51 up $0.31,
  • Bitcoin $65,488 down 1,251 or 1.87%,
  • Baker Hughes Rig Count: U.S. -4 to 590 Canada +17 to 160

*Stock data, cryptocurrency, and commodity prices at the market closing.


Click here to read our current Economic Forecast – June 2024 Economic Forecast: Our Index Marginally Weakened And There Is Another Indicator Warning Of A Recession


Today’s Economic Releases Compiled by Steven Hansen, Publisher:

The Livingston Survey is the oldest continuous survey of economists’ expectations that summarizes the forecasts of economists from industry, government, banking, and academia. The Livingston Survey for June 2024 states:

The 23 participants in the June Livingston Survey predict higher output growth for the first half of 2024 than they predicted in the December 2023 survey. The forecasters, who are surveyed by the Federal Reserve Bank of Philadelphia twice a year, now project that the economy’s output (real GDP) will grow at an annual rate of 2.0 percent during the first half of 2024. They expect weaker conditions in the second half of 2024, when growth is expected to be at an annual rate of 1.7 percent. Both projections represent upward revisions from those of the December 2023 survey. Growth is expected to average an annual rate of 2.0 percent in the first half of 2025.

Prices for U.S. imports rose 1.1% for the year ended in May 2024, matching the over-the-year increase in April. The May and April 12-month advances are the largest over-the-year increases since December 2022. Prices for import fuel fell 2.0 percent in May or the gain in import prices would have been larger. Prices for U.S. exports rose 0.6% from May 2023 to May 2024, the first 12-month advance since January 2023. As 15%+ of US consumption is on imported products and services – I would expect an impact to inflation from imports.

The University of Michigan consumer sentiment according to the authors was little changed in June 2024 saying “this month’s reading was a statistically insignificant 3.5 index points below May and within the margin of error. Sentiment is currently about 31% above the trough seen in June 2022 amid the escalation in inflation. Assessments of personal finances dipped, due to modestly rising concerns over high prices as well as weakening incomes. Overall, consumers perceive few changes in the economy from May.”

Here are some of headlines we are reading today:

Click on the “Read More” below to access these, other headlines, and the associated news summaries moving the markets today.

NOAA Updates its ENSO Alert on June 13, 2024 – The El Nino Advisory/La Nina Watch Continues but it is expected to be the Final El Nino Advisory – Published June 14, 2024

On the second Thursday of every month, NOAA (really their Climate Prediction Center CPC) issues its analysis of the status of ENSO. This includes determining the Alert System Status.  NOAA now describes their conclusion as “ENSO Alert System Status: Final El Nino Advisory/ La Nino Watch”

The exact timing of the transition is now fairly clear which should increase the reliability of the Seasonal Outlook to be issued next Thursday.

We have included an ENSO Blog article by

>

CLIMATE PREDICTION CENTER ENSO DISCUSSION


The second paragraph is what is important:

“The most recent IRI plume indicates La Niña may develop during July-September 2024 and then persist through the Northern Hemisphere winter. The forecast team is also favoring the development of La Niña during July-September because the rate of cooling has slowed since last month. The team still favors La Niña to emerge sometime during the summer months, given the persistent below-average subsurface ocean temperatures and changes in the tropical atmospheric circulation. In summary, ENSO-neutral conditions are present. La Niña is favored to develop during July-September (65% chance) and persist into the Northern Hemisphere winter 2024-25 (85% chance during November-January; ”

Below is the middle paragraph from the discussion last month.

“The most recent IRI plume favors an imminent transition to ENSO-neutral, with La Niña developing during July-September 2024 and then persisting through the Northern Hemisphere winter. The forecast team continues to favor the dynamical model guidance, which suggests La Niña could form as early as June-August 2024 [Author’s Note: slipped a month which is not a big surprise], with higher confidence of La Niña during the following seasons. La Niña generally tends to follow strong El Niño events, which also provides added confidence in the model guidance favoring La Niña. In summary, a transition from El Niño to ENSO-neutral is likely in the next month. La Niña may develop in June-August (49% chance) or July-September (69% chance).”

We now provide additional details.

CPC Probability Distribution

Here are the new forecast probabilities. The probabilities are for three-month periods e.g. MAM stands for March/April/May.

Here is the current release of the probabilities:

This chart shows the forecasted progression of the evolution of ENSO from the current El Nino State to Neutral and by the summer to La Nina.  This kind of bar chart is not very good at showing uncertainty.

Here is the forecast from last month.

The analysis this month and last month are a bit different with again the transition to La Nina being slower than thought last month.

Some will need to click on “Read More” to read the rest of this article.

Today Through the Fourth Friday (22 to 28 days) Weather Outlook for the U.S. and a Six-Day Forecast for the World: posted June 14, 2024

This article focuses on what we are paying attention to in the next 48 to 72 hours. The article also includes weather maps for longer-term U.S. outlooks and a six-day World weather outlook which can be very useful for travelers.

First the NWS Short Range Forecast. The afternoon NWS text update can be found here after about 4 p.m. New York time but it is unlikely to have changed very much from the morning update. The images in this article automatically update.

To get your local forecast plus active alerts and warnings click HERE and enter your city, state or zip code.

Learn about wave patterns HERE.

Then, looking at the world and of course, the U.S. shows here also. Today we are looking at precipitation.

Please click on “Read More” below to access the full Daily Report issued today.

13 Jun 2024 Market Close & Major Financial Headlines: For The Third Session, The Nasdaq Set New Historic Highs After A small Gap Up At The opening Bell, The Dow And The S&P 500 Traded Mostly In the Red, Finally Closing Mixed

Summary Of the Markets Today:

  • The Dow closed down 66 points or 0.17%,
  • Nasdaq closed up 0.34%, (Closed at 17,668, New Historic high 17,742)
  • S&P 500 closed up 0.23%,
  • Gold $2,320 down $35.30,
  • WTI crude oil settled at $78 down $0.42,
  • 10-year U.S. Treasury 4.244 down 0.051 points,
  • USD index $105.20 up $0.56,
  • Bitcoin $66,564 down $1,685 or 2.47%

*Stock data, cryptocurrency, and commodity prices at the market closing.


Click here to read our current Economic Forecast – June 2024 Economic Forecast: Our Index Marginally Weakened And There Is Another Indicator Warning Of A Recession


Today’s Economic Releases Compiled by Steven Hansen, Publisher:

Honestly, I am really glad I do the analysis of inflation myself. If you read the vomit spewed by the financial wizards of the mass media you would be convinced inflation is abating. In fact, the way US Census released the Producer Price Index for final demand was also misleading: “The Producer Price Index for final demand declined 0.2 percent in May…”. Because of the convoluted seasonal adjustments, data errors, and other analytic BS – the only way to wash the info is to do a year-over-year analysis which does not require seasonal adjustments and averages out the data errors. The truth is that the PPI inflation is up 2.24% in May 2024 which is down from April’s 2.27% – literally no change in the inflation rate in this level below retail. And the primary reason the PPI did not rise is due to a 7.1% decline in the price for gasoline. Look at the table below which displays the year-over-year inflation changes from May 2023 – do you see where inflation is abating?

Month Change in final demand from 12 months ago (unadj.) Change in final demand less foods, energy, and trade from 12mo. ago (unadj.)
2023
May 1.1 2.9
June 0.3 2.9
July 1.1 2.9
Aug. 1.9 2.9
Sept. 1.8 2.9
Oct. 1.1 2.8
Nov. 0.8 2.5
Dec. 1.1 2.7
2024
Jan. 1.0 2.7
Feb. 1.6 2.8
Mar. 1.9 2.9
Apr. 2.3 3.2
May 2.2 3.2

When the Port of Los Angeles is combined with the Port of Long Beach, the two ports handled approximately 29% of all containerized international waterborne trade in the U.S. These ports release their statistics early – and give us an insight into trade statistics for the entire nation. In May 2023, imports were down 5% year-over-year whilst exports were down 1%. Imports correlate to U.S. consumer spending – and this data is generally saying spending is down. However, before COVID, May was one of the lowest months for container imports. Over the last year – every month has been relatively equal. Therefore, I am challenged to offer an opinion on what this month’s data means – and I will pass this month.

In the week ending June 8, the advance figure for seasonally adjusted initial unemployment claims 4-week moving average was 227,000, an increase of 4,750 from the previous week’s unrevised average of 222,250.

Here are some of headlines we are reading today:

Click on the “Read More” below to access these, other headlines, and the associated news summaries moving the markets today.

Today Through the Fourth Friday (22 to 28 days) Weather Outlook for the U.S. and a Six-Day Forecast for the World: posted June 13, 2024

This article focuses on what we are paying attention to in the next 48 to 72 hours. The article also includes weather maps for longer-term U.S. outlooks and a six-day World weather outlook which can be very useful for travelers.

First the NWS Short Range Forecast. The afternoon NWS text update can be found here after about 4 p.m. New York time but it is unlikely to have changed very much from the morning update. The images in this article automatically update.

Short Range Forecast Discussion
NWS Weather Prediction Center College Park MD
Thu Jun 13 2024
Valid 12Z Thu Jun 13 2024 – 12Z Sat Jun 15 2024

…There is an Enhanced Risk of severe thunderstorms over parts of the
Middle Mississippi Valley/Western Ohio Valley on Thursday and a Slight
Risk of severe thunderstorms over parts of the northern Mid-Atlantic/New
England plus the Central/Southern High Plains on Friday…

…There is a Moderate Risk of excessive rainfall over parts of the
southern tip of Florida on Thursday and a slight Risk over the southern
tip of Florida on Friday…

…There are Excessive Heat Warnings/Watches and Advisories over Southern
California, Southwest, Central Plains, and Southern High Plains on
Thursday…

A front extending from the Upper Great Lakes, Upper/Middle Mississippi
Valley, and then westward to the Central Rockies will move eastward to the
Northeast Coast, Mid-Atlantic, and westward to the Middle Mississippi
Valley and Central Plains by Saturday. The boundary will trigger showers
and severe thunderstorms over parts of the Middle Mississippi
Valley/Western Ohio Valley. Therefore, the SPC has issued an Enhanced Risk
(level 3/5) of severe thunderstorms over parts of the Middle Mississippi
Valley/Western Ohio Valley through Friday morning. The hazards associated
with these thunderstorms are frequent lightning, severe thunderstorm wind
gusts, hail, and a few tornadoes. In addition, there will be an added
threat of severe thunderstorms wind gusts of 65 knots or greater from the
Central Plains to Western Ohio Valley. Further, there will be an added
threat of large hail, two inches or greater, from the Central Plains to
the Western Ohio Valley.

On Friday, the boundary moves eastward to the Northeast, producing showers
and severe thunderstorms over parts of the northern Mid-Atlantic/New
England. Therefore, the SPC has issued a Slight Risk (level 2/5) of severe
thunderstorms over parts of the northern Mid-Atlantic/New England from
Friday through Saturday morning. The hazards associated with these
thunderstorms are frequent lightning, severe thunderstorm wind gusts, and
a minimal threat of tornadoes/ hail.

In addition, along the western end of the front, showers and severe
thunderstorms will develop over parts of the Central High Plains.
Therefore, the SPC has issued a Slight Risk (level 2/5) of severe
thunderstorms over parts of the Central High Plains from Friday through
Saturday morning. The hazards associated with these thunderstorms are
frequent lightning, severe thunderstorm wind gusts, hail, and a few
tornadoes. Furthermore, there will be an added threat of severe
thunderstorms wind gusts of 65 knots or greater from the Central High
Plains. On Friday, there will also be showers and thunderstorms from parts
of the Middle Mississippi Valley to the Central/Southern Appalachians.

Meanwhile, on Thursday, a stationary front with waves will extend across
northern Florida and parts of the Gulf of Mexico, and the combination of
tropical moisture over southern Florida will produce showers and
thunderstorms with very heavy rain over parts of southern Florida.
Therefore, the WPC has issued a Moderate Risk (level 3/4) of excessive
rainfall through Friday morning. The associated heavy rain will create
numerous areas of flash flooding. Furthermore, many streams may flood,
potentially affecting larger rivers.

On Friday, the threat of excessive rainfall will decrease slightly over
the southern tip of Florida. Therefore, the WPC has issued a Slight Risk
(level 2/4) of excessive rainfall over southern Florida from Friday into
Saturday morning. The associated heavy rain will create mainly localized
areas of flash flooding, with urban areas, roads, small streams, and
low-lying areas the most vulnerable.

Elsewhere, on Friday, a front will develop over parts of the Pacific
Northwest and move inland to the Northern Plains, the Great Basin, and
Southern California. The system will produce showers and thunderstorms
over parts of the Northern High Plains and Northern Plains on Friday
evening into Saturday. Moreover, onshore flow behind the front will
produce rain over parts of the Pacific Northwest from Friday to Saturday.

Moreover, upper-level ridging will develop over parts of the Southwest
eastward to the Southern, leading to Excessive Heat Warnings/Watches and
Heat Advisories over Southern California, Southwest, Central Plains, and
Southern High Plains. Residents and individuals involved in outdoor
activities must stay informed and take immediate and necessary precautions.

To get your local forecast plus active alerts and warnings click HERE and enter your city, state or zip code.

Learn about wave patterns HERE.

Then, looking at the world and of course, the U.S. shows here also. Today we are looking at precipitation.

Please click on “Read More” below to access the full Daily Report issued today.

12 Jun 2024 Market Close & Major Financial Headlines: S&P 500 And The Nasdaq Set New Historic Highs Again After A Significant Gap Up At The opening Bell, The Dow Trended Down To Close In Negative Territory

Summary Of the Markets Today:

  • The Dow closed down 35 points or 0.09%,
  • Nasdaq closed up 1.53%, (Closed at 17,608, New Historic high 17,345)
  • S&P 500 closed up 0.85%, (Closed at 5,421, New Historic high 5,447)
  • Gold $2,335 up $8.80,
  • WTI crude oil settled at $78 up $0.43,
  • 10-year U.S. Treasury 4.332 down 0.007 points,
  • USD index $104.75 down $0.49,
  • Bitcoin $67,534 up 217 or 0.32%,

*Stock data, cryptocurrency, and commodity prices at the market closing.


Click here to read our current Economic Forecast – June 2024 Economic Forecast: Our Index Marginally Weakened And There Is Another Indicator Warning Of A Recession


Today’s Economic Releases Compiled by Steven Hansen, Publisher:

The Consumer Price Index for All Urban Consumers (CPI-U) increased 3.3% year-over-year in May 2024 – down slightly from last month’s 3.4% year-over-year. The all items less food and energy index rose 3.4% over the last 12 months. In looking at the internals, gasoline declined whilst shelter and food increased. Although the CPI marginally declined, it remains a long way from from the Fed’s 2.0% target.

The Federal Reserve’s FOMC meeting concluded today with no change to the federal funds rate of 5-1/4 to 5-1/2% as expected. Their statement begins:

Recent indicators suggest that economic activity has continued to expand at a solid pace. Job gains have remained strong, and the unemployment rate has remained low. Inflation has eased over the past year but remains elevated. In recent months, there has been modest further progress toward the Committee’s 2 percent inflation objective.

The question always remains when will the Fed reduce the federal funds rate. The following shows the FOMC participants’ assessments of what they GUESS the midpoint of target range or target level for the federal funds rate would be over time. This new set of “guesses” is more hawkish (meaning the potential reductions are further in the future). The numbers in the columns represent the number of participants projecting the midpoint of target range or target level. For 2024, 4 participants anticipate NO reduction to the federal funds rate while 7 believe there will be one rate reductions and 8 think there will be two reductions.

Midpoint of target range or target level (Percent) 2024 2025 2026 Longer run
5.500
5.375 4 1
5.250
5.125 7
5.000
4.875 8 1 1
4.750
4.625
4.500
4.375 4
4.250
4.125 9 1
4.000
3.875 2
3.750 1
3.625 1 3 1
3.500 2
3.375 3
3.250
3.125 7 1
3.000 4
2.875 1 2
2.750 3
2.625 1 1
2.500 5
2.375 1 1
2.250

Note: Each shaded circle indicates the value (rounded to the nearest 1/8 percentage point) of an individual participant’s judgment of the midpoint of the appropriate target range for the federal funds rate or the appropriate target level for the federal funds rate at the end of the specified calendar year or over the longer run.

Here are some of headlines we are reading today:

Click on the “Read More” below to access these, other headlines, and the associated news summaries moving the markets today.