The U.S. vs. China
No subject is more important and complex than the competition between the US and China. In this post, I will simply discuss it via one image, one projection, one video, one meme, one article, one picture, and one book.
*Stock data, cryptocurrency, and commodity prices at the market closing.
June 2023 retail sales were up 1.7% year-over-year – 0.9% inflation-adjusted. Non-store retailers and restaurants lead the growth of retail sales. These are relatively weak numbers that are showing little sign of recovery.
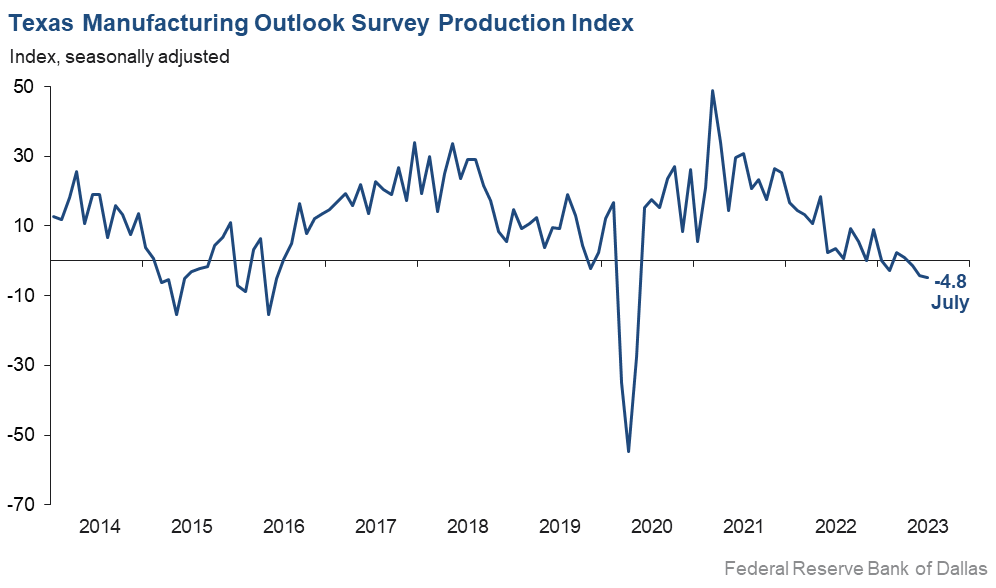
Industrial production declined 0.4% year-over-year with industry groups manufacturing declining 0.3%, mining growing 2.8%, and utilities declining 6.2%. This sector remains in a recession.
Click on the “Read More” below to access these, other headlines, and the associated news summaries moving the markets today.
Short Range Forecast Discussion
NWS Weather Prediction Center College Park MD
Valid 00Z Tue Jul 18 2023 – 00Z Thu Jul 20 2023…Lengthy heat wave to continue in the Southwest, South Central U.S., and
South Florida……Tropical Storm Calvin weakening on approach to Hawai’i…heavy rains
expected……Canadian wildfires/smoke responsible for Air Quality alerts over parts
of the Northern High Plains, Midwest, Great Lakes, and Northeast…
*Stock data, cryptocurrency, and commodity prices at the market closing.
Empire State Manufacturing Survey fell six points to 1.1. New orders inched up and shipments expanded. Delivery times shortened and inventories continued to decline. Employment levels edged higher, though the average workweek was little changed. Input and selling price increases continued to moderate. Some pundits are making a big deal that this index remained in positive territory but overall manufacturing remains in a recession.
Click on the “Read More” below to access these, other headlines, and the associated news summaries moving the markets today.
This is a somewhat confusing post that appeared in the NOAA Climate Blog which is intended to be informative and also announce a new NOAA website which you can access HERE. But we already know that the oceans are getting warmer due to Global warming. Oceans are three-dimensional. Are surface temperatures important other than the impact on the atmosphere? It is a new website but I think they have publicized it prematurely as it is IMO not fully developed. But it is a good start. They have a long way to go. But the topic is very important.
Here is the definition of a Marine Heat Wave:
“The marine heatwave (MHW) in the forecast is identified when sea surface temperature anomaly (with respect to the 1991-2020 monthly climatology) is above the MHW threshold. MHW thresholds specific to each month of the year are calculated as the 90th percentile of SST anomalies in a 3-month window (for example, for January MHWs, the 90th percentile of all December to February SST anomalies).” [Editor’s note: why 90%? That seems pretty arbitrary to me but it may be appropriate. I did not address the issue of
That is reasonable enough. In the blog article, they show the forecast for September and what it would be if we did not have Global Warming. But the counterfactual only compares the forecast to thirty or so years ago so it is a stretch to call this with and without Global Warming. But it does call attention to the problem of oceans that are warming.
First, we take a look at the current situation:
Not sure why they use a different color scheme. Not sure why they do not show the World. And we are in El Nino. |
Then the with and without Global Warming for September of this year.
The yellow and orange colors show what NOAA calls Marine Heat Waves. Of interest is the Atlantic Ocean which would be a major hurricane maker if not for the El Nino which blows the tops off of developing hurricanes. We expect to see the El Nino warm tongue off of Peru during an El Nino. But there are a lot of other areas that are yellow and orange but some of that is the IOD. I do not like the color coding that was used. I find the graphic confusing. I will get used to it. BTW it shows PDO Negative, unfortunately. |
This is quite different and makes the point. But oceans are 3D and I prefer the way JAMSTEC handles it with layers of the ocean. NOAA probably does that as well but so far they have not figured out how to display it. And of course, 3D is difficult to display. I think they should show the legend with both graphics. |
Short Range Forecast Discussion
NWS Weather Prediction Center College Park MD
421 PM EDT Sun Jul 16 2023Valid 00Z Mon Jul 17 2023 – 00Z Wed Jul 19 2023
…There is a Moderate Risk of excessive rainfall over parts of New
England on Sunday……There is a Slight Risk of severe thunderstorms over parts of New
England and Central Plains/Middle Mississippi Valley……Excessive Heat Warnings and Advisories from the Pacific Northwest,
California, and the Great Basin to parts of the Southern Plains, Central
Gulf Coast, and southern tip of Florida……Air Quality alerts over parts of the Northern High Plains, Upper
Midwest, and Ohio Valley…
The Japan Agency for Marine-Earth Science and Technology, or JAMSTEC, is a Japanese national research institute for marine-earth science and technology
From the JAMSTEC Discussion:
As predicted, the recent observation confirms the development of the El Niño. The SINTEX-F ensemble mean predicts that the El Niño will reach the peak in August and persist at least until the next boreal spring. However, there is a large uncertainty in the predicted amplitude.
Although it is a World forecast, it includes a forecast for North America since North America is part of the World.
This shows their forecast of sea surface temperature anomalies at three points in time. Red is warm and is associated with El Nino. You can see the El Nino tongue of warm water extending from Peru to the west in all three time periods. It seems to be stronger in the 1st and 2nd time periods. The warmest water shifts west in the third period exhibiting Modoki characteristics. [I have similar information on their SSTA projections from NOAA but I usually do not include it in the article I write on the NOAA Seasonal Outlook because they do not seem to focus on it and their information does not extend as far into the future as does the information from JAMSTEC]. It is hard to find any blue in this set of forecasts but there is a bit of blue off of Baja California which is interesting. JAMSTEC uses the same definition of Normal (climatology as NOAA). They do a better job at characterizing La Ninas and El Ninos than NOAA. JAMSTEC provides me with a lot of other information that I do not include in my articles to keep them to a manageable size for readers. Yesterday we published the NOAA ENSO Advisory and our article can be accessed HERE. In that article, Emily Becker commented on the generally warm oceans and how this may make predicting the strength and duration of an El Nino difficult. |
This paper identifies four economic rights and corresponding economic responsibilities in accordance with the needs of the factors of production: land, labor, and capital distinguished between physical and financial capital. Economic rights are the creators of property rights and find their justification in corresponding economic responsibilities. The implementation of these four rights and responsibilities is ideally suited to make the corporation serve the interests of human beings. A brief discussion of the role of governments in achieving this goal is also presented.
Short Range Forecast Discussion
NWS Weather Prediction Center College Park MD
421 PM EDT Sun Jul 16 2023Valid 00Z Mon Jul 17 2023 – 00Z Wed Jul 19 2023
…There is a Moderate Risk of excessive rainfall over parts of New
England on Sunday……There is a Slight Risk of severe thunderstorms over parts of New
England and Central Plains/Middle Mississippi Valley……Excessive Heat Warnings and Advisories from the Pacific Northwest,
California, and the Great Basin to parts of the Southern Plains, Central
Gulf Coast, and southern tip of Florida……Air Quality alerts over parts of the Northern High Plains, Upper
Midwest, and Ohio Valley…
On the second Thursday of every month, NOAA issues its analysis of the status of ENSO. This includes determining the Alert System Status. NOAA again describes their Report as “ENSO Alert System Status: El Nino Watch”
There is not much doubt that we have an El Nino. How long it lasts and its strength remains to be seen.
From the NOAA Analysis:
The second paragraph is what is important:
“The most recent IRI plume indicates El Niño will persist through the Northern Hemisphere winter 2023-24. Forecasters favor continued growth of El Niño through the fall, peaking this winter with moderate-to-strong intensity (81% chance of November-January Niño-3.4 ≥1.0C). An event that becomes “historically strong” (seasonally averaged Niño-3.4 ≥ 2.0C), rivaling the winters of 1997-98 or 2015-16, has an approximately 1 in 5 chance. In summary, there is a greater than 90% chance that El Niño will continue through the Northern Hemisphere winter. |
Here are the new forecast probabilities. This information in the past has been released twice a month and the first release is based on a survey of Meteorologists, the second is based on model results. The probabilities are for three-month periods e.g. JJA stands for June/July/August. The first forecast forecast is used to develop the Seasonal Outlook which will be issued next Thursday so that is what I am focusing on.
Here is the current release of the probabilities:
You can clearly see The forecast does not extend beyond FMA 2024 but one does see a slight tail-off in the probabilities for El Nino conditions in the Eastern Pacific after the winter season. |