New Experimental Forecast Addresses the Impact of Global Warming on Marine Heat Waves – July 17, 2023

This is a somewhat confusing post that appeared in the NOAA Climate Blog which is intended to be informative and also announce a new NOAA website which you can access HERE. But we already know that the oceans are getting warmer due to Global warming. Oceans are three-dimensional. Are surface temperatures important other than the impact on the atmosphere? It is a new website but I think they have publicized it prematurely as it is IMO not fully developed. But it is a good start. They have a long way to go. But the topic is very important.

Here is the definition of a Marine Heat Wave:

“The marine heatwave (MHW) in the forecast is identified when sea surface temperature anomaly (with respect to the 1991-2020 monthly climatology) is above the MHW threshold. MHW thresholds specific to each month of the year are calculated as the 90th percentile of SST anomalies in a 3-month window (for example, for January MHWs, the 90th percentile of all December to February SST anomalies).” [Editor’s note: why 90%? That seems pretty arbitrary to me but it may be appropriate. I did not address the issue of

That is reasonable enough. In the blog article, they show the forecast for September and what it would be if we did not have Global Warming. But the counterfactual only compares the forecast to thirty or so years ago so it is a stretch to call this with and without Global Warming. But it does call attention to the problem of oceans that are warming.

First, we take a look at the current situation:
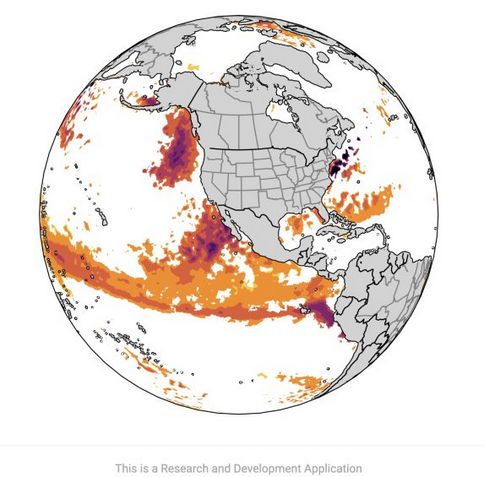
 Not sure why they use a different color scheme. Not sure why they do not show the World. And we are in El Nino.

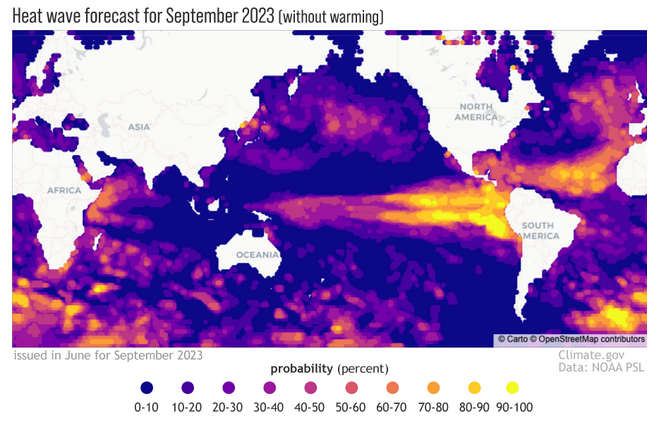
Then the with and without Global Warming for September of this year.
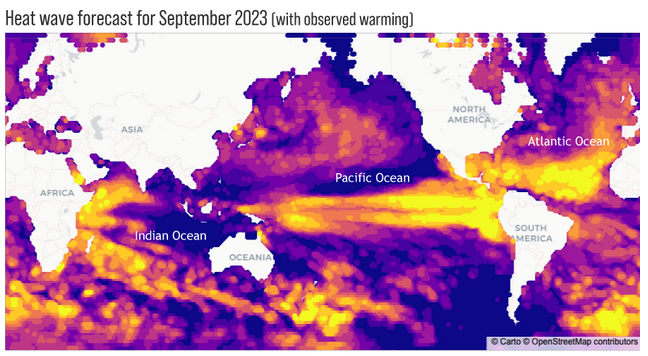
The yellow and orange colors show what NOAA calls Marine Heat Waves.  Of interest is the Atlantic Ocean which would be a major hurricane maker if not for the El Nino which blows the tops off of developing hurricanes. We expect to see the El Nino warm tongue off of Peru during an El Nino. But there are a lot of other areas that are yellow and orange but some of that is the IOD. I do not like the color coding that was used. I find the graphic confusing. I will get used to it. BTW it shows PDO Negative, unfortunately.


This is quite different and makes the point. But oceans are 3D and I prefer the way JAMSTEC handles it with layers of the ocean. NOAA probably does that as well but so far they have not figured out how to display it. And of course, 3D is difficult to display. I think they should show the legend with both graphics.

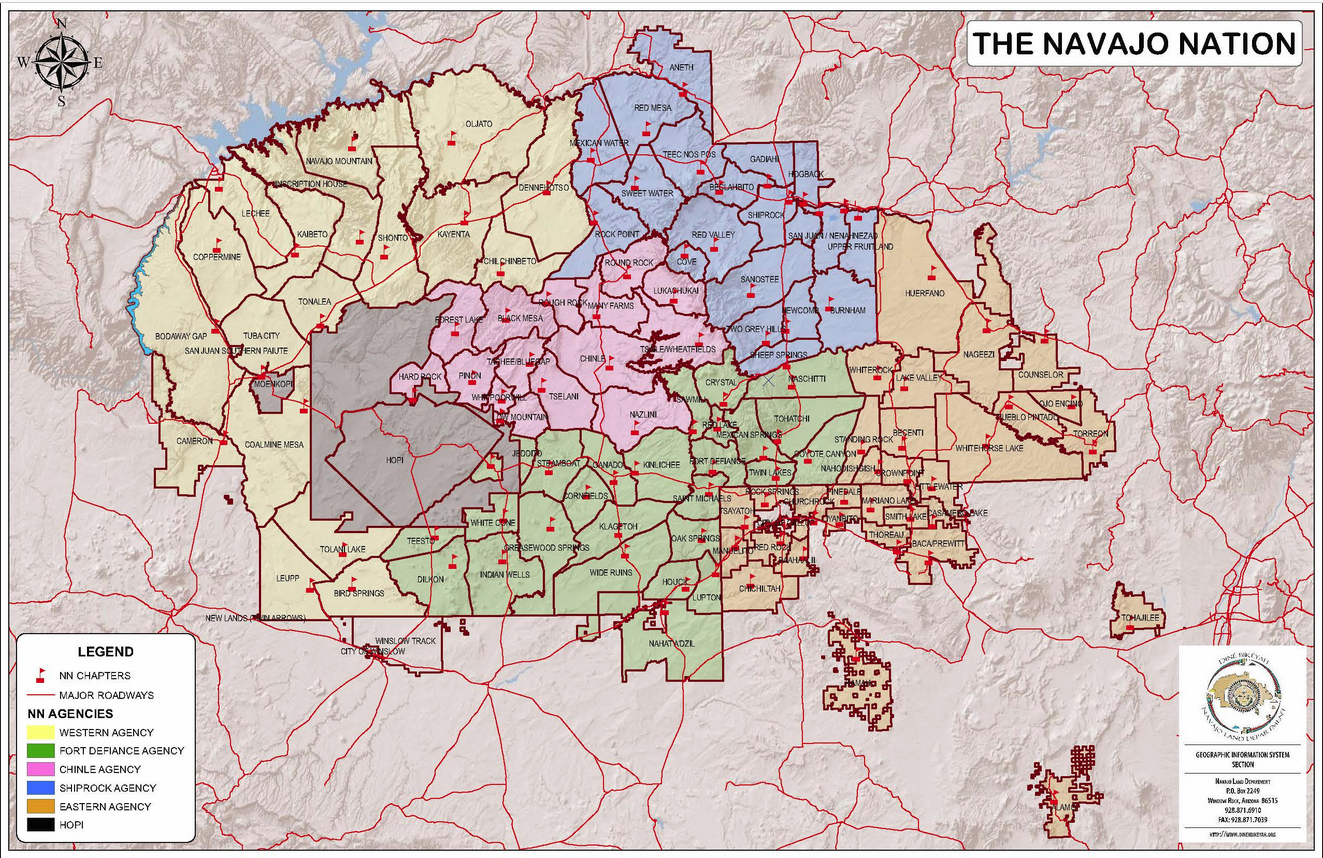
Supreme Court Rules Against the Navajo Nation Docket No 21-1484 June 23, 2022

On June 22nd the Supreme Court of the United States sometimes abbreviated SCOTUS decided 5 to 4 that the 1968 Treaty with the Navajo Tribe called for the U.S. to provide the land and funding for sheep, goats, cattle, and corn as well as education and some infrastructure but did not mention water. The decision of the Supreme Court was that if it did not mention water when written and agreed to, one can not just add “water” to the treaty now. The U.S. Supreme Court may not always be correct but they are last so this is likely the final legal decision on this but Congress and the Executive Branch of Government have not yet been heard from.

But then there is this part of the Court decision:

In addition, the Navajos may be able to assert the interests they claim in water rights litigation, including by seeking to intervene in cases that affect their claimed interests, and courts will then assess the Navajos’ claims and motions as appropriate. See 28 U. S. C. §1362; Arizona v. California, 460 U. S. 605, 615 (1983); see also Blatchford v. Native Village of Noatak, 501 U. S. 775, 784 (1991); Moe v. Confederated Salish and Kootenai Tribes of Flathead Reservation, 425 U. S. 463, 472–474 (1976).

So this case is over but the issue is not.

The Hopi are a different tribe than the Navajo. For more information about the Navajo Nation click HERE. BTW yá’át’ééh means hello or welcome. If you live in New Mexico you tend to learn a little Navajo and we raise Navajo Churro Sheep so we are involved with the Navajo. HERE is the official statement by the Navajo Nation on yesterday’s Supreme Court Decision.

Carbon Dioxide Levels Continue to Increase June 12, 2023

There is a constant flow of news about Global Warming. One indicator of the drivers of Global Warming is the concentration of carbon dioxide concentrations. NOAA Report. We have previously explained how carbon dioxide and other greenhouse gases cause the atmosphere to warm. Knowing the current level of carbon dioxide in the air is essential. Based on the assumption that we have a well-mixed atmosphere one could in theory measure it anywhere. An isolated place like Mauna Loa in Hawaii is ideal except when the volcano is erupting. Usually, it is close to a perfect location. It is measured in more than one place since the assumption that the atmosphere is well-mixed is an approximation. NOAA reports on the level monthly and I thought this would be a good time to provide one of their reports and explain the Keeling Curve.


Introduction to Global Warming Part 1, June 3, 2023

It is time to talk about Global Warming. I prefer the term Global Warming(GW) to Climate Change(CC) simply because it is the warming that changes the climate. But either term is fine. We are going to tackle this in small portions. It is a very complicated and a largely misunderstood topic. My major interest is the economic impacts but I think we need to start by understanding what Global Warming is and why it is happening.

In Part I,  I am going to discuss the imbalance between incoming energy and outgoing energy.  I am also going to try to explain why it is happening and the role of greenhouse gases. I believe we are at the point now where there is no doubt that this is caused almost totally by the activities of humans. But even if it was a natural phenomenon, what I am presenting in this article would apply. The only way to get warmer is to receive more energy than you send into space.  Not being in balance could be caused by humans or by something else. We will deal with the cause in a future article.  Part I of this Introduction to Global Warming is about the imbalance.

NOAA Issues their Hurricane Outlooks Marking the Start of Summer this May 29, 2023

Updated at 3:26 a.m. EDT Tuesday, May 30, 2023

We are entering Hurricane Season. So it is appropriate to discuss the recent projections issued by NOAA. NOAA has provided projections for the Atlantic, Central Pacific, and Eastern Pacific.

I also discuss the apparent correlation between hurricane frequency and intensity with the phases of the Atlantic Multidecadal Oscillation (AMO). This is particularly important this year due to the combination of a warm Atlantic and a forecast of an El Nino. These two factors tend to cancel each other out and this combination occurs rarely.  This makes the forecast this year interesting and based on a small number of occurrences of this combination. Thus the level of confidence in the Outlook for the Atlantic may be lower than usual.

The analysis of the impact of the AMO on the forecast is in Part II of the article so those who are only interested in the forecast will find that early in the article. Ocean cycles are very important when trying to understand the climate of the U.S. and other parts of the World.

It is also appropriate to remind those who are at risk from tropical cyclones to be as prepared as possible.

A Review of the U.S. 2022 Climate January 11, 2023

Here is the official Review of the 2022 Annual Climate. Actually, it is a summary of a summary. The full report will be released on January 12. John Batement does a good job of summarizing the summary report. I have provided his full report in the body of this article.

Here are my observations:

  • In terms of temperature, it was in the top third of the 128 years in the database, and in terms of precipitation, it was in the driest third of the 128 years of record. I am not impressed.
  • In terms of impacts, it was the third worst in the 43 years of record. That got my attention. I do not take this part of the report at face value. It needs further analysis.
  • In terms of drought it was the worst year in the 22 Year record of the Drought Monitor – Note we have 128 years of climate data but only 22 years of drought data.

Compared to the rest of the World, the U.S. got off lightly.  Below is John Bateman’s full report.

World Climate Review for October 2022

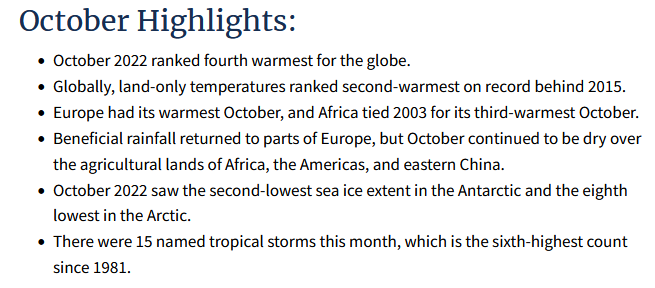
I have consolidated a few NOAA Reports on Worldwide Climate in October 2022. In one case I have tried to put it the information in a better perspective. October was very warm but did not set a record. Temperatures seem to have plateaued. If ENSO switches to El Nino we may then see another true increase in Global Land Temperatures.  In a couple of days, I will provide an article specific to the U.S.

U.S. Agriculture Report October 24, 2022

There are climate webinars held in different parts of the U.S. and at a webinar “North Central U.S. Climate” held on October 20, 2022, one of the presentations was titled Midwest/Great Plains Agricultural Update, October 20, 2022. The presentation was made by Brad Rippey – USDA. Analyst & Drought Monitor Author. Brad is the managing editor of the USDA Weekly Weather and Crop Bulletin and is one of the Editors of the Drought Monitor so he is in a unique position to understand the crop situation in the U.S. If I was a little more patient, I might have a recording of his presentation to share with you but I thought that just presenting his slides would be informative.I am not sure how long it takes for the recording of those webinars to get posted.

I am presenting the slides without comments. If you look carefully, I think you will be able to see that the trend in yield increases for key crops has topped out. Is this global warming or a long cycle? It is hard to say but it is very concerning. Some of the current issues were better explained in his comments and the Q&A afterward. But I think readers will get a good grasp of the situation from the slides. I have personal experience with river levels being too high as the Ohio River Company was a client and that was a frequent problem for them. River levels being too low is new to me. So it is not just a water shortage for farms and cities but also the water-based transportation system in the U.S.. For those who do not know it, our inland water transportation system is one of the key natural endowments of the U.S. 

I have often published articles on the USDA Executive Briefings and some of Brad’s slides come from that source but he has access to all sorts of good stuff so I wanted to take advantage of that. He was kind enough to send me a PDF of his presentation so that is what is being presented in this article. 

UN climate report: It’s ‘now or never’ to limit global warming to 1.5C degrees

On April 4, 2022, the IPPC AR6 WGIII Report was released to the public.  In this article, I will try to summarize what was presented.  This is complicated by the sensational nature of the analysis presented about the rate of change in global temperature.  The analysis conclusion was interpreted by the UN Secretary-General as a dramatic proclamation of the dire need for corrective action.