El Nino and Snowfall November 24, 2023 – It is a declining trend.

 We have previously looked at the impact of El Nino on precipitation. It was in THIS article. The key graphic was

Now we look at the impact of El Nino on snowfall. Even in the winter, not all precipitation falls as snow. This article is based on a blog post in ENSO BlOG at Climate.Gov by Michelle L’Heureux and Brian Brettschneider. We are only going to present the four key graphics in that Blog Post

You can read the full ENSO BLOG post HERE  For some readers, you will have to hit “Read More” to see the rest of my article.

Looking back at October for the World November 16, 2023 – Earth had its Warmest October Ever Since Reliable Data has been Available.

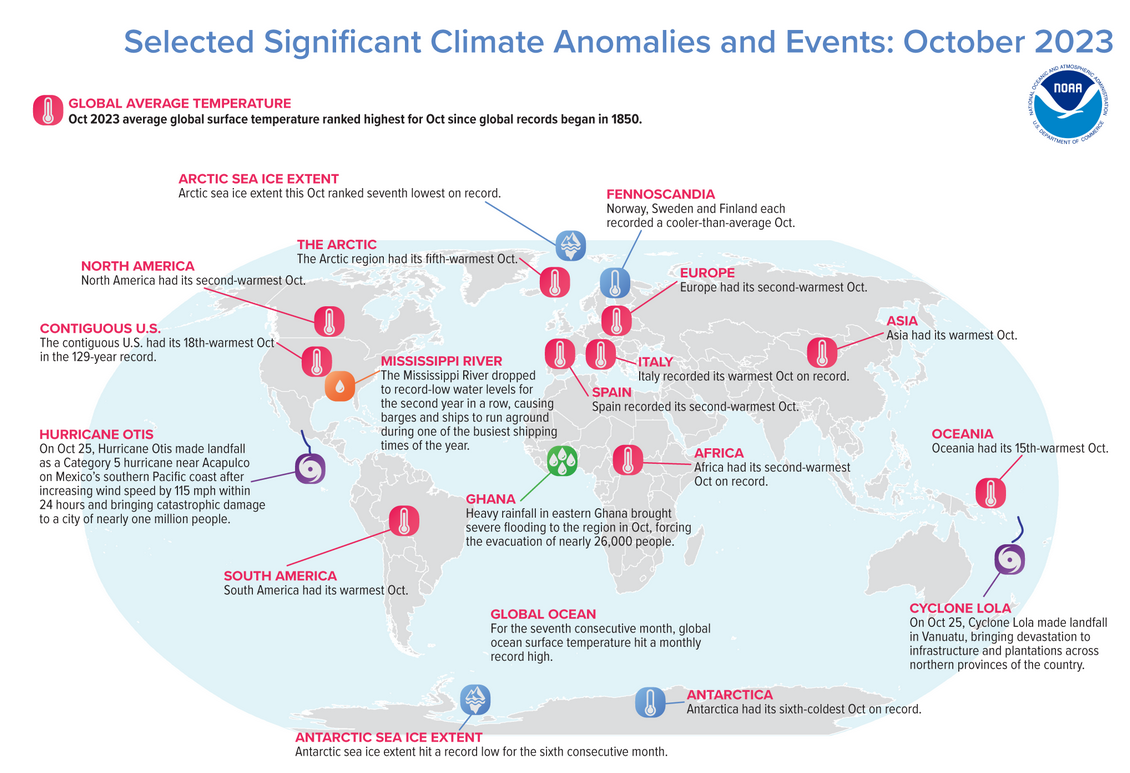
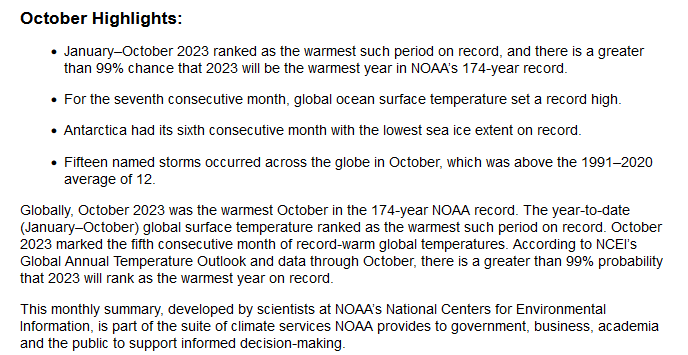
Most of the information in this report comes from the monthly email I receive from John Bateman. He does public outreach for NOAA and in particular NCEI. I could find the same information and more on the NCEI website but John produces a good summary so I use it or most of it. I also sometimes add additional information from NCEI or other NOAA websites. The full NCEI report for October can be accessed HERE.

I added the below to what John Bateman provided.


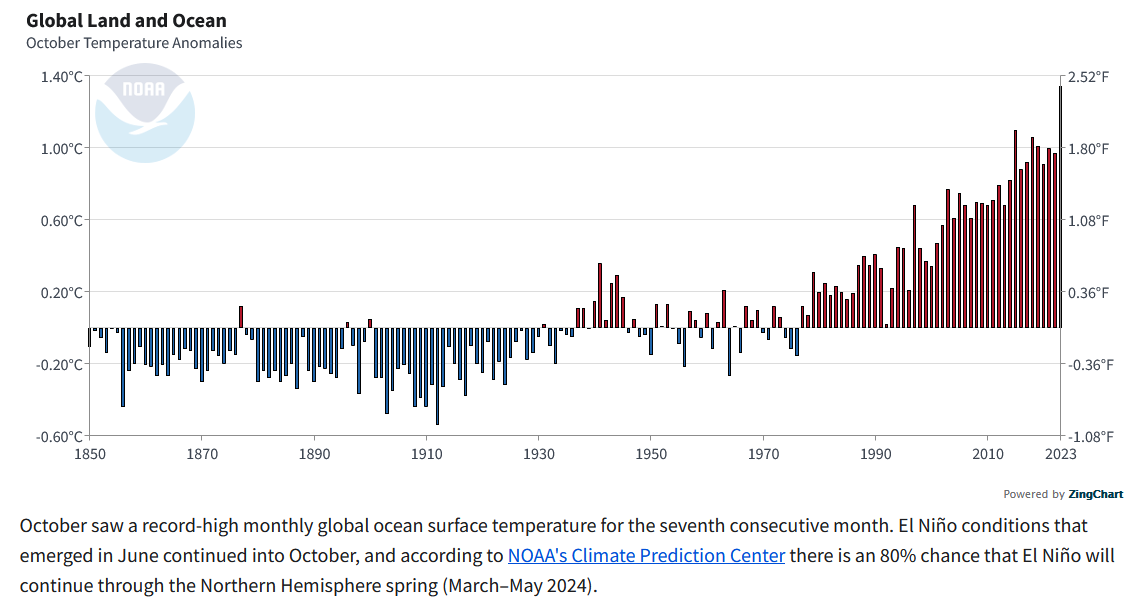
This shows the temperature anomaly for the single month of October dating back to 1850 plus the same graphic for the year to date including October. The increase this October is mind-boggling. Many believe that there were factors other than the steady increase in greenhouse gases and the onset of El Nino that caused this big increase which we also saw in recent months but the increase in October is shocking. The oceans are warming also but we will address that at another time but it is significant. In the above, it is the surface temperature land and ocean which is shown. The warming of the layers of the ocean below the surface is of considerable concern.

Fifth National Climate Assessment November 15, 2023. Part I The Announcement.

 Erratum:

Mea culpa. I know that this is a 4 – 5 year event but I was not thinking clearly when I created the title.  As of 11:40 p.m. EST November 22, 2023, the title is now corrected. One wonders why the U.S. Climate Assessment occurs every 4 – 5 years when the IPCC report is issued every 7 years. I do not know the answer to that question.  Nothing else in this article has been changed.

I was not expecting this to arrive today.  But this is not a new endeavor. I think it was mainly a NASA project in the past but I may be wrong about that. Now it is:

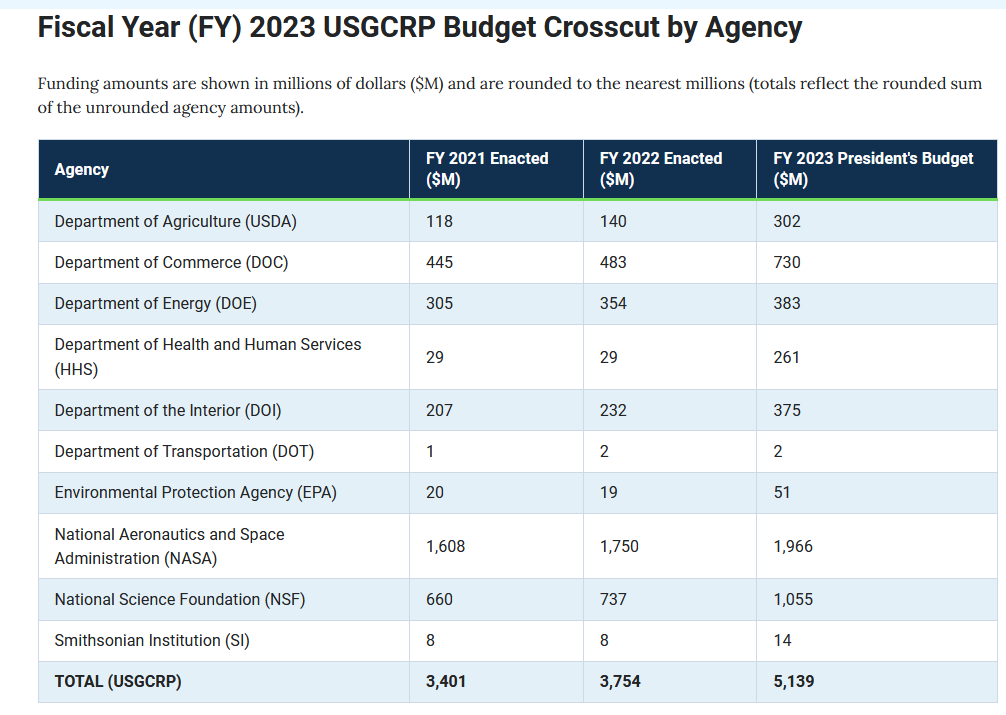
And they are well funded.

Global Warming is expensive that is for sure.

I will report on this Climate Assessment even though I consider it to be more political than scientific. But I am not saying that the science in the report is not accurate.

HERE is the link to the full report.

What about El Nino? September 23, 2023

Since it is almost certain we will have El Nino this winter and a strong one at that, it is useful to think about what that means for precipitation in the lower 48 states.

The above shows El Nino winters from 1950 to today organized from upper left to lower right by the strength of the ENSO ONI Index. It may be missing one or even two recent El Ninos. I know how to create this sort of graphic but I prefer to use one that has been created by others. The point is that there is a lot of variation among El Nino winters. In the past, I have done an analysis for the state where I live which is New Mexico to see if the phases of the AMO and PDO seem to have an impact and they do. I am not aware of any published paper on that subject. I have seen papers that look at the impact of the Hawaiin High on how wet certain parts of California get during an El Nino. The fact is we do not really know how El Nino works partly because we have so few El Nino winters to analyze.

Looking Back at the Global Climate in August 2023 – This past August was the Warmest August on Record. But it was More Than That – September 16, 2023

Every month, John Bateman sends me a nice email. Usually, he sends me two: one about the U.S. and one about the world.  I do not recall receiving an email from him on the U.S. but I published my own article on August in the U.S. and you can find it HERE. Yesterday he sent me the email for the world. Since they are emails, I usually can not provide a link to what he sent me. He is a spokesperson (not sure that is the right description of his job) for NOAA both NCEI and other parts of NOAA.  For this monthly article, all of the information in his email comes from the NOAA National Centers for Environmental Information so the information he includes in his email and much more can be found HERE. I published his article in full but included two additional graphics from NCEI namely the historical year by year record and the map of important events.

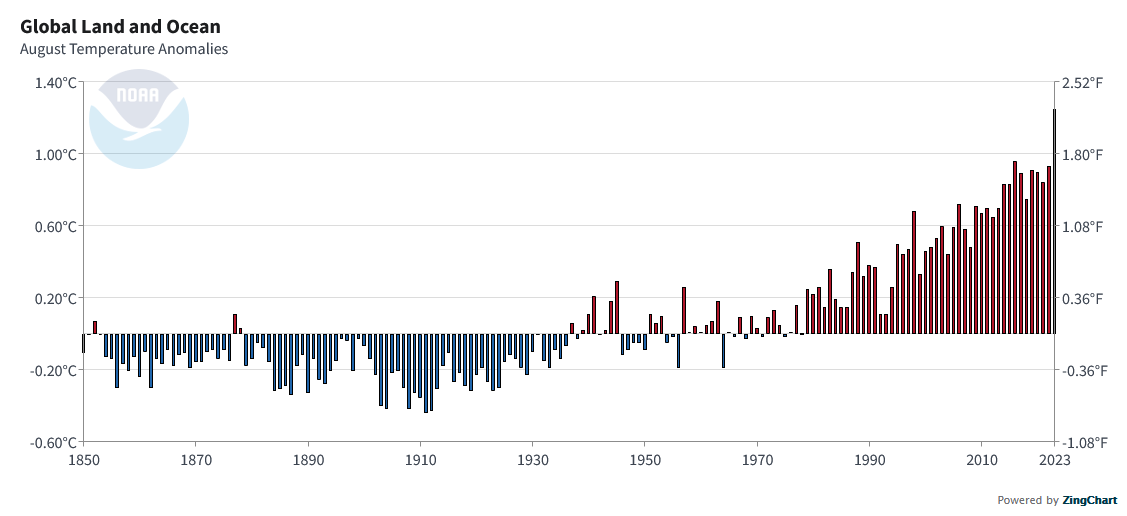
Obviously the headline this month is that August has been the warmest August since this data has been collected.  And it was also the fifth consequtive month of record ocean surface temperatures.


This is the record of August land and ocean temperature anomalies and this Augugust appears to have set a new record high. It is just speculation on my part but I think it is the stepwise rise in temperature we get with an El Nino. But some believe that other factors were a larger contributor to this in August and also in July than simply the increase in greenhouse gases. They may be correct in that many factors impact temperature and precipitation. In this article, we report what happened rather than try to explain why it happened. “Attribution” is always very complex.


NOAA Updates its ENSO Alert on September 14, 2023 – The El Nino Advisory Continues. In a Week, NOAA Will Update us on how this Impacts U.S. Weather

On the second Thursday of every month, NOAA (really their Climate Prediction Center CPC) issues its analysis of the status of ENSO. This includes determining the Alert System Status.  NOAA again describes their conclusion as “ENSO Alert System Status: El Nino Advisory”

There is not much doubt that we have an El Nino. How long it lasts and its strength remains to be seen. NOAA may be more conservative compared to some other Weather Advisory Organizations.

CLIMATE PREDICTION CENTER ENSO DISCUSSION
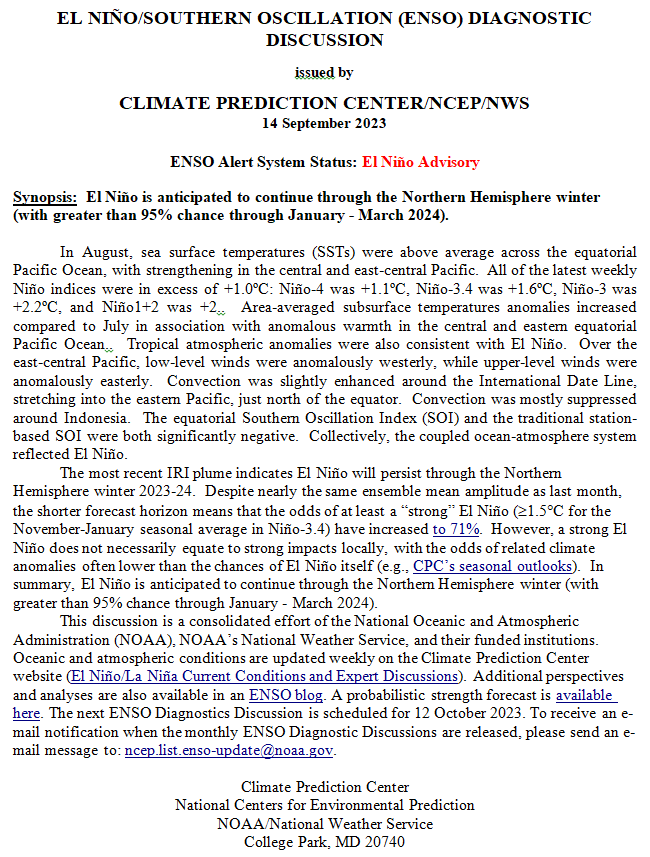
The second paragraph is what is important:

“The most recent IRI plume indicates El Niño will persist through the Northern Hemisphere winter 2023-24.  Despite nearly the same ensemble mean amplitude as last month, the shorter forecast horizon means that the odds of at least a “strong” El Niño (≥1.5C for the November-January seasonal average in Niño-3.4) have increased to 71%.  However, a strong El Niño does not necessarily equate to strong impacts locally, with the odds of related climate anomalies often lower than the chances of El Niño itself (e.g., CPC’s seasonal outlooks).  In summary, El Niño is anticipated to continue through the Northern Hemisphere winter (with greater than 95% chance through January – March 2024; ).”

We now provide additional detail but I am keeping this article shorter than usual because nothing much has changed since last month.

CPC Probability Distribution

Here are the new forecast probabilities. This information in the past has been released twice a month and the first release is based on a survey of Meteorologists, the second is based on model results. The probabilities are for three-month periods e.g. ASO stands for August/September/October. The approach may have changed as IRI (The International Research Institute for Climate and Society, Columbia University Climate School) may no longer be involved.  Their website has not been updated this month.

Here is the current release of the probabilities:
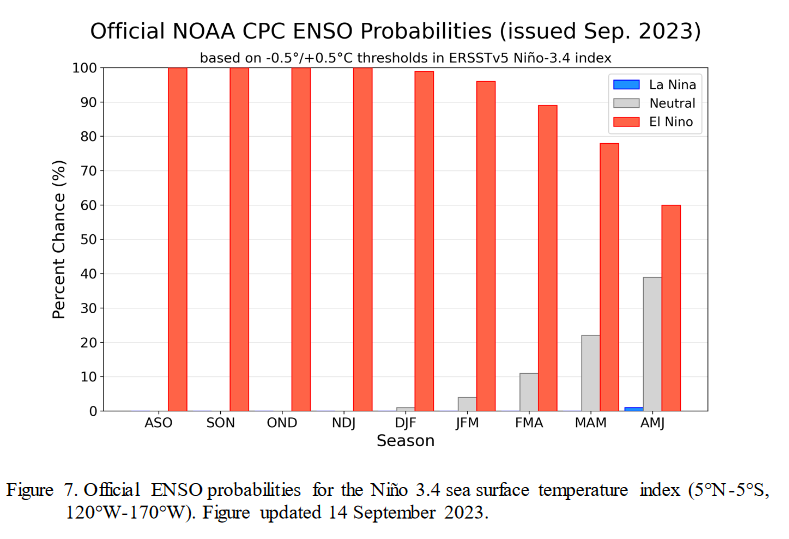
You can clearly see the forecast does not extend beyond AMJ 2024 and one does see a tail-off in the probabilities for El Nino conditions in the Eastern Pacific after the winter season.  Some Meteorological Agencies see El Nino lasting longer but JAMSTEC showed it ending sooner in the article I posted last night which you can access HERE.

Here is the forecast from late last month.
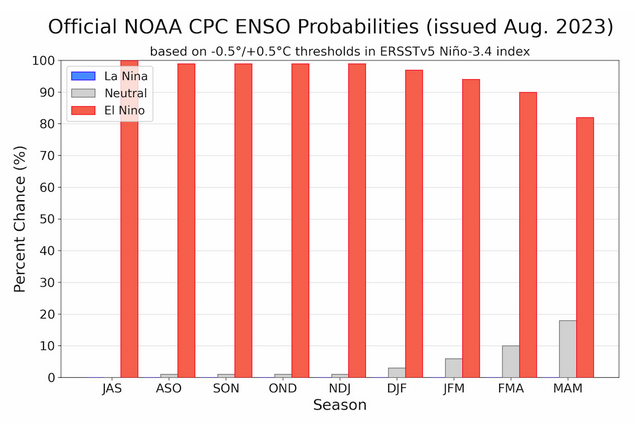
This showed a slower demise of the El Nino.

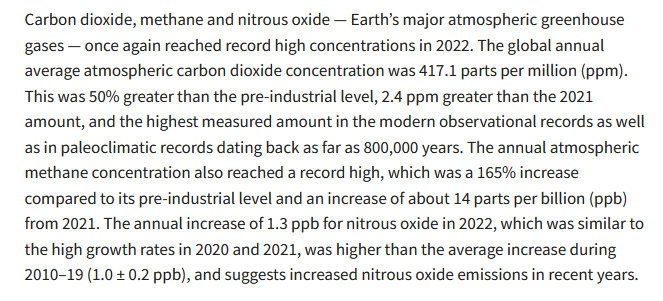
Reporting on the State of the Climate in 2022 – September 9, 2023

Every year at about the same time, there is a report on the State of the Climate of the world as of the prior year.  Many organizations work together to produce and distribute this report.  I am presenting the NCEI-prepared highlights of the full report. Remember this report is about 2022 and the years leading up to 2022. It takes a little time for NOAA and the American Meteorological Society to prepare their report and in this article, I provide the Highlights of that report as prepared by NCEI. NCEI stands for the NOAA National Centers for Environmental Information.

This article is worth reading. It just presents the highlights. My comments are inside boxes within the article.

This report can be accessed HERE but I have included all of the material that is in this report in this article.

The American Meteorological Society (AMS) version of the report has a lot more detail and can be accessed HERE.

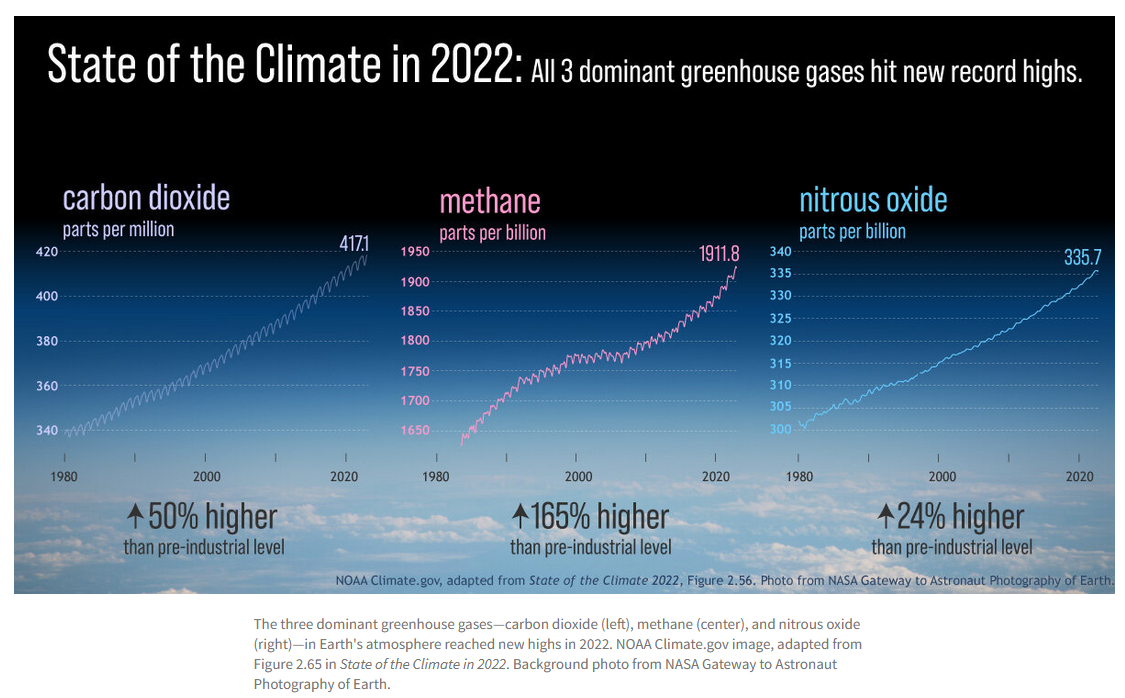
The growth in all three greenhouse gases since 1980 is bad but the increase in methane is particularly concerning.

Nitrous oxide is a very very powerful GHG so its increase in growth rather is very concerning.

Looking Back at the Global Climate in July 2013 – This past July seems to have been the warmest July on record.

Please note the title was meant to be Looking Back at the Global Climate in July 2023, not July 2013.

Every month, John Bateman sends me a nice email. Actually, he sends me two: one about the U.S. and one about the world.  I have already published an article based on his U.S.-focused email and you can find it HERE. Two days ago he sent me the email for the world. Since they are emails, I usually can not provide a link to what he sent me. He is a spokesperson (not sure that is the right description of his job) for NOAA both NCEI and other parts of NOAA.  For this monthly article, all of the information in his email comes from the NOAA National Centers for Environmental Information so the information he includes in his email and much more can be found HERE.

Since he is a very good writer I use a lot but not all of his material and supplement it with some additional material from the NCEI website or other NOAA websites. I have not indicated what I took from his letter and what I added but if someone has questions on that I can explain it.

Obviously the headline this month is that it looks like July has been the warmest July since this data has been collected.

This is the record of July-only land and ocean temperature anomalies and this July appears to have set a new record high. It is just speculation on my part but I think it is the stepwise rise in temperature we get with an El Nino.


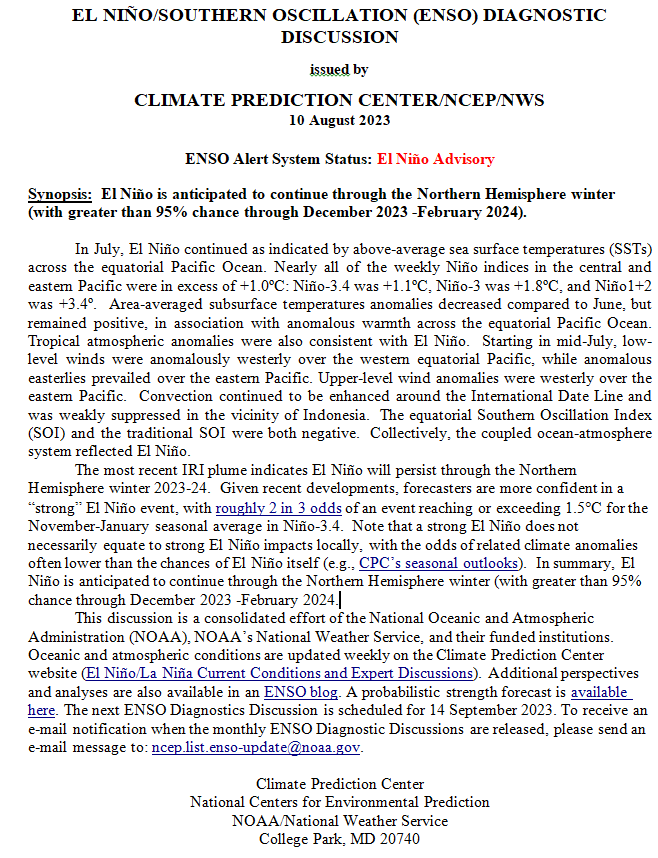
NOAA Updates its ENSO Alert on August 10, 2023 – The El Nino Advisory Continues. In a Week, NOAA Will Tell Us How this Impacts U.S. Weather

On the second Thursday of every month, NOAA (really their Climate Prediction Center CPC) issues its analysis of the status of ENSO. This includes determining the Alert System Status.  NOAA again describes their conclusion as “ENSO Alert System Status: El Nino Advisory”

There is not much doubt that we have an El Nino. How long it lasts and its strength remains to be seen.

CLIMATE PREDICTION CENTER ENSO DISCUSSION

The second paragraph is what is important:

“The most recent IRI plume indicates El Niño will persist through the Northern Hemisphere winter 2023-24.  Given recent developments, forecasters are more confident in a “strong” El Niño event, with roughly 2 in 3 odds of an event reaching or exceeding 1.5°C for the November-January seasonal average in Niño-3.4.  Note that a strong El Niño does not necessarily equate to strong El Niño impacts locally, with the odds of related climate anomalies often lower than the chances of El Niño itself (e.g., CPC’s seasonal outlooks).  In summary, El Niño is anticipated to continue through the Northern Hemisphere winter (with greater than 95% chance through December 2023 -February 2024.”

We now provide additional detail but I am keeping this article shorter than usual because nothing much has changed since last month.

CPC Probability Distribution

Here are the new forecast probabilities. This information in the past has been released twice a month and the first release is based on a survey of Meteorologists, the second is based on model results. The probabilities are for three-month periods e.g. JAS stands for July/August/September. The first forecast is used to develop the Seasonal Outlook which will be issued next Thursday so that is what I am focusing on.

Here is the current release of the probabilities:

You can clearly see The forecast does not extend beyond MAM 2024 and one does see a slight tail-off in the probabilities for El Nino conditions in the Eastern Pacific after the winter season.

Is Global Warming Impacting the ENSO Cycle – August 5, 2023

Is Global Warming impacting the ENSO Cycle? A friend of mine posted an interesting post on this on Climate.Gov and I think it is worth discussing. But we really do not have the ability at this point in time to know if this is happening and if so why.

This introduces the ENSO BLOG post on Climate.gov. Here is the link to the full post.

He provides two pieces of evidence. This is the one that resonated with me.

Presumably, we see higher highs (El Nino) and lower lows (La Nina) since 1960.  We do not seem to see higher highs and higher lows which one might expect with warmer oceans but all the values are anomalies that complicate things a lot. Actually, I am not 100% sure of exactly what this data represents. Presumably, it is the 5-month running mean minus the 1981- 2010 climatology. That is slightly different than the usual calculation of the value of the Nino 3.4 Index but it is challenging to compare current values to historical values as the temperature of the ocean surface increases.  I will copy Mike McPhaden and ask him if I have described the above correctly – stay tuned.  Trying to understand the impact of Global Warming is not simple.

The Footnotes to the post provide useful information