Since it is almost certain we will have El Nino this winter and a strong one at that, it is useful to think about what that means for precipitation in the lower 48 states.

–
| The above shows El Nino winters from 1950 to today organized from upper left to lower right by the strength of the ENSO ONI Index. It may be missing one or even two recent El Ninos. I know how to create this sort of graphic but I prefer to use one that has been created by others. The point is that there is a lot of variation among El Nino winters. In the past, I have done an analysis for the state where I live which is New Mexico to see if the phases of the AMO and PDO seem to have an impact and they do. I am not aware of any published paper on that subject. I have seen papers that look at the impact of the Hawaiin High on how wet certain parts of California get during an El Nino. The fact is we do not really know how El Nino works partly because we have so few El Nino winters to analyze. |
–

| Notices: We recently published the NOAA Seasonal Outlook which I call a four-season Outlook and it can be accessed HERE. We also published the JAMSTEC three-Season Outlook. Both are based on this being an El Nino Fall, Winter, and Spring. This of course raises the question of what is El Nino and how useful is it when trying to forecast the weather. |
| El NINO is one of the three phases of a pattern called ENSO which stands for El Niño-Southern Oscillation. The name is meant to convey that this pattern involves two patterns. One is the distribution of warm water along the Equatorial Pacific and the other is the response of the Atmosphere to the change in the distribution of the warm water in the Equatorial Pacific. I am not going to provide a full explanation in this article particle because it would be a very long article and partly because contrary to the way we discuss ENSO, we do not really know what causes it. Since I do not work for NOAA I can say that. |
| One thing we think we know is that it is convenient to think in three different patterns of the spatial distribution of warm water along the Equatorial Pacific and how this may impact what is called the Walker Circulation which is the pattern of where evaporation and clouds form and where precipitation falls. I will do that now and come back to the parts of the ENSO Hypothesis which is still not well understood and the question of whether Global Warming has impacted this process. |
I will now be showing and discussing three idealized patterns of the Walker circulation which is where evaporation takes place more than usual and where precipitation occurs more than usual. Remember these are idealized patterns of the Walker circulation. I am showing three versions one for each defined phase of ENSO. But what about when we are halfway between one phase and another? In such cases, the Walker circulation is a bit different.

–
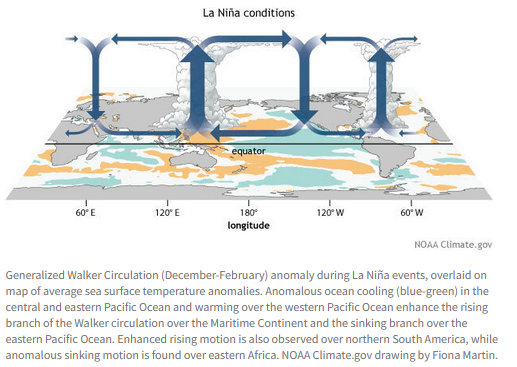
| I am starting with the La Nina situation or phase but I could have started elsewhere. During La Nina, the prevailing easterlies skim warm water off the surface and deliver it to the Indo-Pacific Warm Pool.
The up arrows are areas where air rises and the down arrows are where air subsides. Evaporation over warm water causes air to rise and precipitation is associated with sinking, warming, and drying air masses. |
–

| Next, I am presenting what is called the ENSONeutral situation. In the Neutral situation, there is much rising of air and forming clouds over the Indo-Pacific warm poll where the warm water accumulates. The Easterlies are strong during this period of time. |

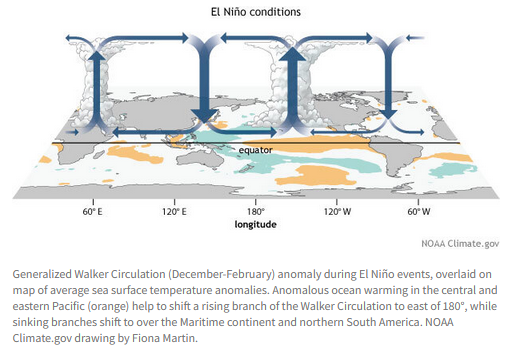
| During El Nino, the situation is somewhat similar but notice the thicker arrows in some places. There is that huge updraft just off the west coast of the U.S. and this should create storms. The real mystery is what causes the easterlies to relax. I do not believe that this mechanism is well known. It is part of what I call the ENSO Hypothesis. One thing that we observe is that as the Indo-Pacific Warm Pool increases in size it expands to the east and when there are temporary relaxations of the Easterlies this warm water can become Oceanic Kelvin Waves. This transfers warm water from the Indo-Pacific to the east. But what causes the Easterlies to relax and stay relaxed during an El Nino? I do not think that is well understood but I may be incorrect about that. |
We now have the problem of trying to figure out how this phenomenon happening along the Equator can impact areas north and south of the Equator.

| In the above one can see three patterns that cause air to move within cells that are approximately 30 degrees of latitude. There are also Rossby Waves sometimes called Planetary Waves. This is how heat is transferred from the Equator to the Poles to keep things in balance and determine the location of the Jet Stream. There are usually 3 to 5 of these waves active a one time and the number of these waves is called the Wave Number. I believe that during the very strong El Nino of 1997, the wave number was 2 or even 1 for a while. So the Wave Number has a big impact on how the Walker Circulation is translated into higher latitudes which most importantly for most places is the Ferrel Cell prevailing Westerlies. |

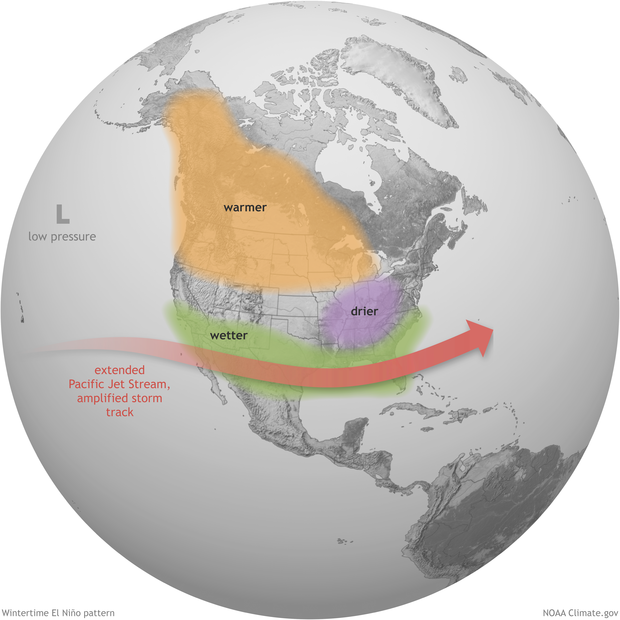
| The above is the canonical pattern of the Jet Stream when El Nino conditions apply. It is useful in understanding the usual path of the Jet Stream. But given what we have discussed, what are the chances that it will evolve the way it is drawn in this graphic for every El Nino event? |
–
| Can Global Warming change the ENSO Hypothesis where the system is unstable and moves from La Nina to Neutral to El Nino to Neutral and La Nina etc? The answer is maybe. I have published one article on this subject and you can access it HERE. |
–
| I hope you found this article interesting and useful. |
–