M2 Money Supply and CPI Inflation. Part 3

The full data sets for the 64 years from 1959 to 2022 show no discernable association patterns (correlations) for M2 money supply growth and consumer inflation changes.1  This post continues that analysis by looking specifically at the various regimes of inflation change during the 64-year timeline. This article analyzes the association of CPI with M2 during the four periods from 1959 to 2022 with negative inflation changes (disinflation/deflation) surges.


Image by Kevin Schneider from Pixabay

M2 Money Supply and CPI Inflation. Part 1

We have found that the correlation relationships between various types of credit and inflation are variable over time.  So far, the kinds of credit studied are government deficit spending,1,6 consumer credit,2 mortgage debt,3 nonfinancial corporate credit,4 and financial sector debt.5 Here, we examine the relationship between the total money supply (M2) and Consumer Price Index (CPI) inflation.7


Photo by Giorgio Trovato on Unsplash.

Comparing Two Data Organizations for Federal Deficit Spending vs Inflation. Part 2

Two studies have been performed on the correlations between U.S. Federal Deficit Spending and CPI Inflation. The first used federal deficits for fiscal years between 1914 and 2022. The second study used the quarterly data available for federal deficit spending starting in 1966.  This article is the second to compare the results of the two studies.


Photo by Adi Goldstein on Unsplash

Comparing Two Data Organizations for Federal Deficit Spending vs Inflation. Part 1

Two studies have been performed on the correlations between U.S. Federal Deficit Spending and CPI Inflation. The first used federal deficits for fiscal years between 1914 and 2022. The second study used the quarterly data available for federal deficit spending starting in 1966.  This article compares the results of the two studies.


Photo by Indira Tjokorda on Unsplash

Federal Deficit Spending (Quarterly) and Inflation. Part 4

This article concludes the analysis of the correlation patterns between quarterly Federal Deficit Spending (FDS) and Consumer Inflation (CPI).  The last of the three types of inflation patterns (time periods with no significant inflation trends) is the subject of analysis here.  The other two types of patterns (inflation surges1 and disinflation/deflation surges2) were analyzed previously.  The conclusion discusses the correlation patterns for all time periods, looks for any common threads, and identifies important differences across time periods and types of correlation patterns.


From photo by Live Richer on Unsplash.

Federal Deficit Spending (Quarterly) and Inflation. Part 3

The full data sets for the 56 years from 1966 to 2022 show no discernable association patterns (correlations) for federal deficit spending (FDS) and inflation changes.1  Thus, we started an analysis by looking specifically at the various regimes of inflation change during the 56-year timeline.  The most recent post2 analyzed the seven time periods over 56 years with positive inflation surges.  This article analyzes the association between CPI changes and FDS changes during the four periods from 1966 to 2022 with negative inflation (disinflation/deflation) surges.


Image by Nicolae Baltatescu from Pixabay.

Federal Deficit Spending (Quarterly) and Inflation. Part 2

The full data sets for the 56 years from 1966 to 2022 show no discernable association patterns (correlations) for U.S. federal deficit spending growth and inflation changes.1  This post continues that analysis by looking specifically at the various regimes of inflation change during the 56-year timeline.


From a photo by Giorgio Trovato on Unsplash

Federal Deficit Spending (Quarterly) and Inflation. Part 1

We have found that the correlation relationships between various types of credit and inflation are variable over time.  So far, the kinds of credit studied are government spending,1 consumer credit,2 mortgage debt,3 nonfinancial corporate credit,4 and financial sector debt.5 Here, we return to federal deficit spending and inflation by analyzing data organized differently than previously used.


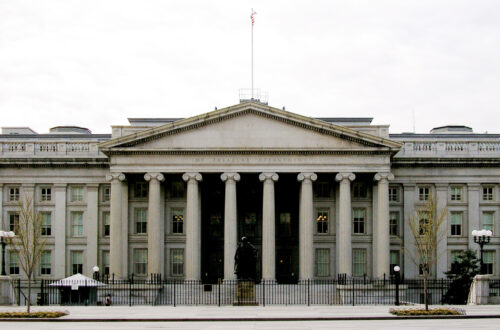
The Treasury Department Building in Washington DC. (Public domain, Wikipedia.)

Financial Sector Debt and Inflation. Part 4

This article concludes the analysis of the correlation patterns between Financial Sector Debt (FSD) and Consumer Inflation (CPI).  The last of the three types of inflation patterns (time periods with no significant inflation trends) is the subject of analysis here.  The other two types of patterns (inflation surges1 and disinflation/deflation surges2) were analyzed previously.  The conclusion discusses the correlation patterns for all time periods, looks for any common threads, and identifies important differences across time periods and types of correlation patterns.


Image by Gerd Altmann from Pixabay.