This article concludes the analysis of the correlation patterns between Nonfinancial Corporate Credit (NFC) and Consumer Inflation (CPI). The last of the three types of inflation patterns (time periods with no significant inflation trends) is the subject of analysis here. The other two types of patterns (inflation surges1 and disinflation/deflation surges2) were analyzed previously. The conclusion discusses the correlation patterns for all time periods, looks for any common threads, and identifies important differences across time periods and types of correlation patterns.

From a photo by Josue Isai Ramos Figueroa on Unsplash.
Introduction
The hypothesis we are testing is that inflation depends on nonfinancial corporate credit in a linear manner, expressed in the following equation:3
I = mS + b
where
I = Change in CPI (the Consumer Price Index)
S = Change in Consumer Credit
Data
The data sources and tables for NFC and CPI are3 in Part 1. The timelines3 for the two data sets are also in Part 1, with coincident timelines and offsets by three and six months out to 24 months for NFC coming before CPI and vice versa.
The inflation timeline3 from 1952 through 2022 is in Part 1 and corrected1 in Part 2. The inflation timeline uses year-over-year inflation calculated quarterly. Figure 1 shows the inflation graph for the 1952-2022 time period3 (from Part 1).
Figure 1. CPI Rolling Four Quarter Inflation 1952-2022 with Significant Changes in Inflation Noted
(Each letter identifies the end of a significant move. An * identifies the end of an insignificant time period.)

Table 1 shows the data from Figure 1.
Table 1. Timeline of Inflation Data 1952-2022 (Previously Table 4*.1)

In Table 1, a black letter identifies a significant positive surge in inflation, a red letter for significant negative surges, and no letter for time periods with no significant changes in inflation.
Significant surges are changes in inflation ≥4% with no intervening countertrend moves >1.5%.
Analysis
There are 13 quarterly timeline alignments examined in each of the 5 time periods:
- NFC Credit and CPI Inflation quarters are coincident.
- NFC Credit leads and lags CPI Inflation by one quarter (±3 months)
- NFC Credit leads and lags CPI Inflation by two quarters (±6 months)
- NFC Credit leads and lags CPI Inflation by three quarters (±9 months)
- NFC Credit leads and lags CPI Inflation by four quarters (±12 months)
- NFC Credit leads and lags CPI Inflation by six quarters (±18 months)
- NFC Credit leads and lags CPI Inflation by eight quarters (±24 months)
2Q 1957 – 1Q 1959
Figure 2. U.S. NFC Credit and Inflation 1Q 1957 – 1Q 1959

In this time period, CPI inflation quarterly changes are in a gradual declining trend. For NFC Credit, quarterly changes are also in a downtrend for the first four quarters and then reverse to increasingly larger changes for the second four.
Figure 3. Quarterly Changes in NFC Credit (x) vs. CPI Inflation (y) 1Q 1957 – 1Q 1959
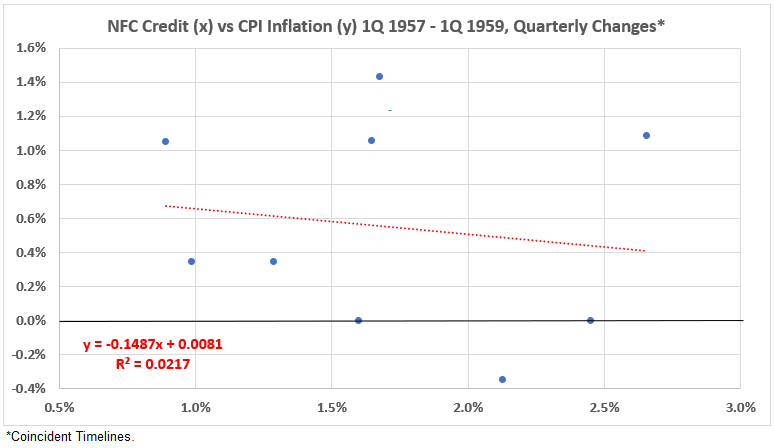
The association (correlation) between HNO Credit and CPI Inflation is weakly negative for this inflation surge period: R = –14%, R2 = 2%. Note that the shape of this scatter plot is not oval (football-shaped). This indicates that the data distribution does not approximate that of a normal distribution. The statistical result for R and R2 may be less meaningful than for a better distribution.4
Figure 4. Correlation Between NFC Credit and CPI Inflation 1Q 1957 – 1Q 1959
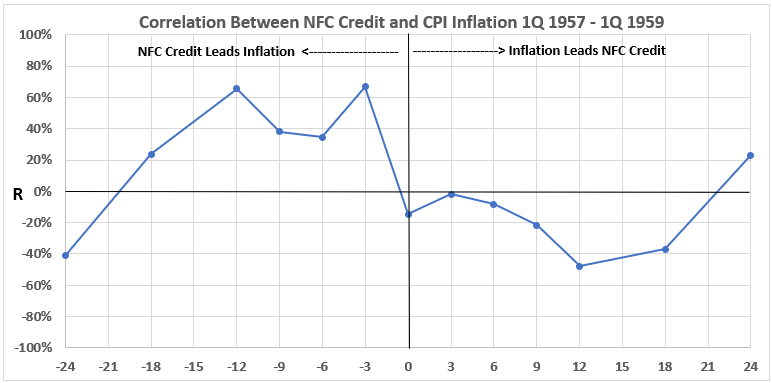
Figure 4 shows the positive association of NFC Credit with inflation is moderate and when credit comes before inflation (left-hand side of the graph except for the 24-month data). On the other hand, the association is mostly weakly negative when inflation comes before credit spending. With 3- and 6-month lead, the association becomes negligible and weakly positive for 24 months. There is a possibility that NFC credit might have caused up to ~40% of the inflation that came three to twelve months later. Changes in inflation might have resulted in up to ~20% of a change in NFC credit a year or more later. How much cause-and-effect relationships there are require additional information.
1Q 1970 – 2Q 1972
Figure 5. U.S. NFC Credit and Inflation 4Q 1969 – 2Q 1972
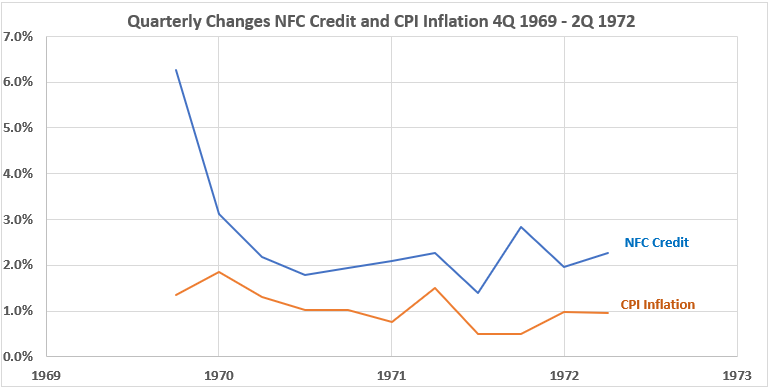
In this period, inflation and NFC credit changes are relatively stable, except for the rapid decline in NFC credit during the first two quarters.
Figure 6. Quarterly Changes in NFC Credit (x) vs. CPI Inflation (y) 4Q 1969 – 2Q 1972
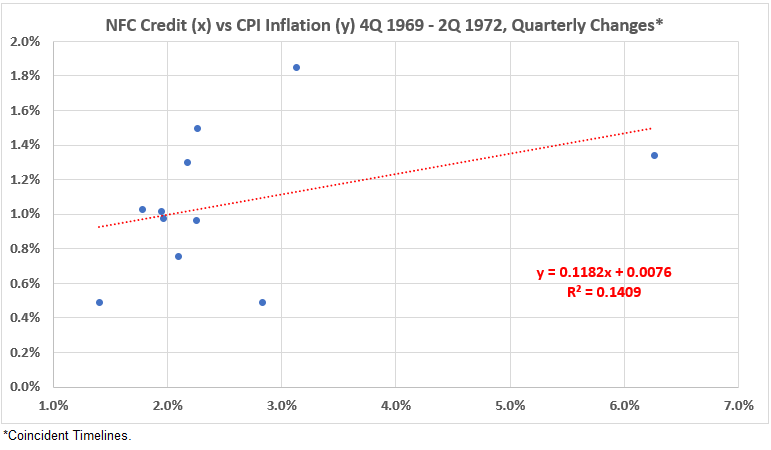
The association (correlation) between HNO Credit and CPI Inflation is weakly positive during this relatively stable inflation period: R = 38%, R2 = 14%.
Figure 7. Correlation Between NFC Credit and CPI Inflation 4Q 1969 – 2Q 1972

Figure 7 shows the positive association of HNO Credit with inflation is significant (strong) when credit comes before inflation by three months (left-hand side of the graph). For that point R = 70.7% and R2 = 50%. For all other data points, NFC credit changes are weakly positively correlated with later inflation changes. An exception is the weak negative correlation for NFC changes occurring two years before inflation. This data suggests that NFC credit might have caused up to 50% of the inflation that followed three months later during this period.
The associations are mostly negligible or weakly negative for inflation changes occurring before NFC credit changes. The exception is the moderate correlation for the 18-month lead time data point. It is hard to rationalize why there should be a cause-and-effect relationship with such a long lead time. But causation cannot be eliminated without additional information.
3Q 1983 – 4Q 1986
Figure 8. U.S. NFC Credit and Inflation 2Q 1983 – 4Q 1986
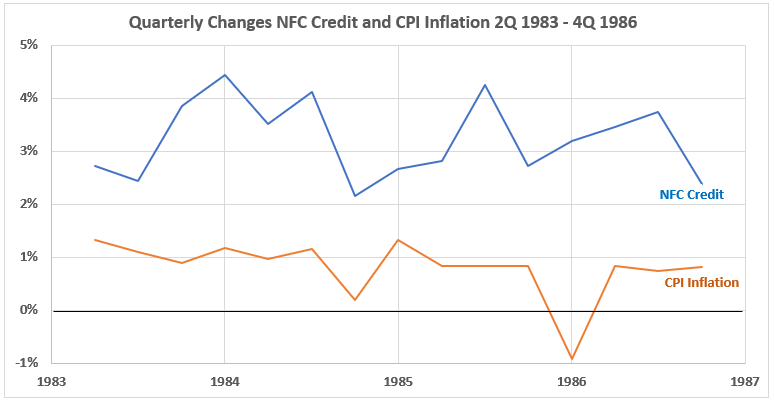
Figure 8 shows level trending quarterly changes for both variables. The quarterly change remained consistently larger for NFC credit than those for inflation. This is different from the two previous periods when the differences between the two varied over time, and the changes for NFC were closer to or even smaller than CPI changes.
Figure 9. Quarterly Changes in NFC Credit (x) vs. CPI Inflation (y) 2Q 1983 – 4Q 1986
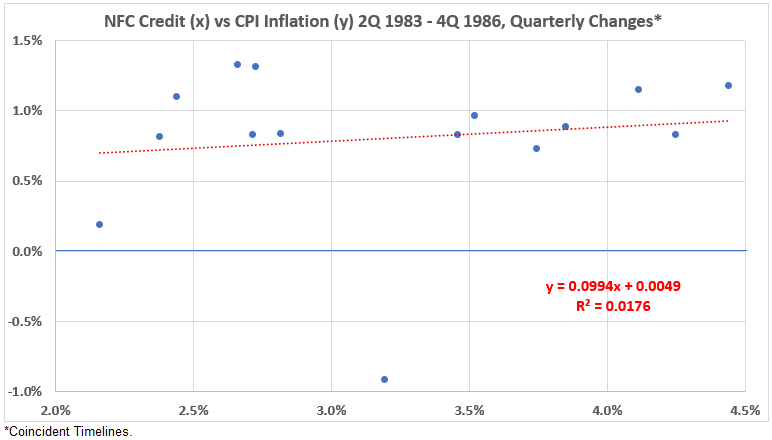
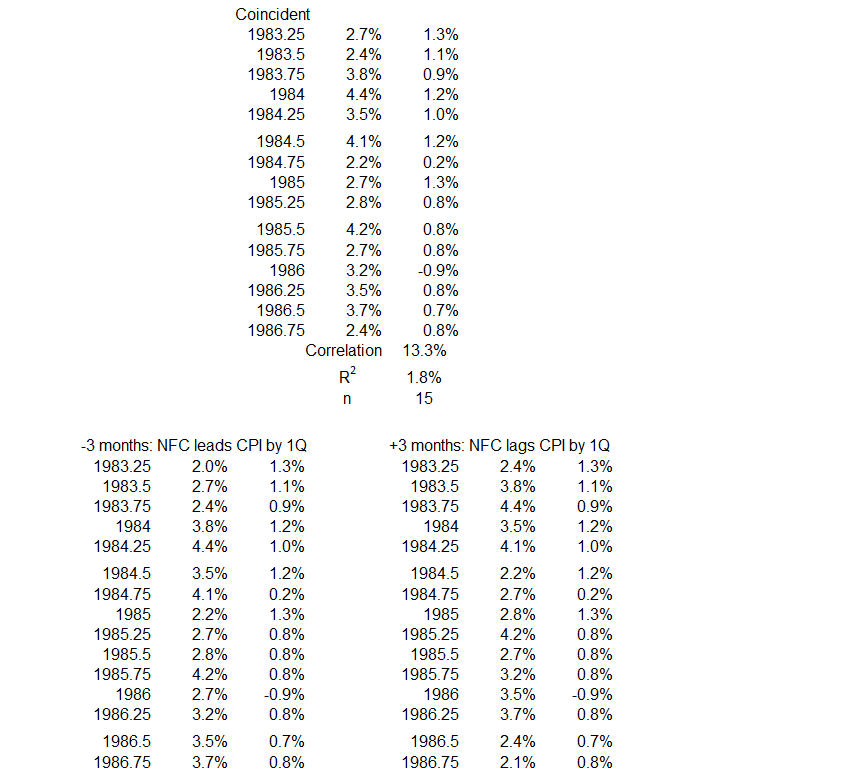
This time period shows a slightly positive correlation: R = 13.3%, R2 = 1.8%.
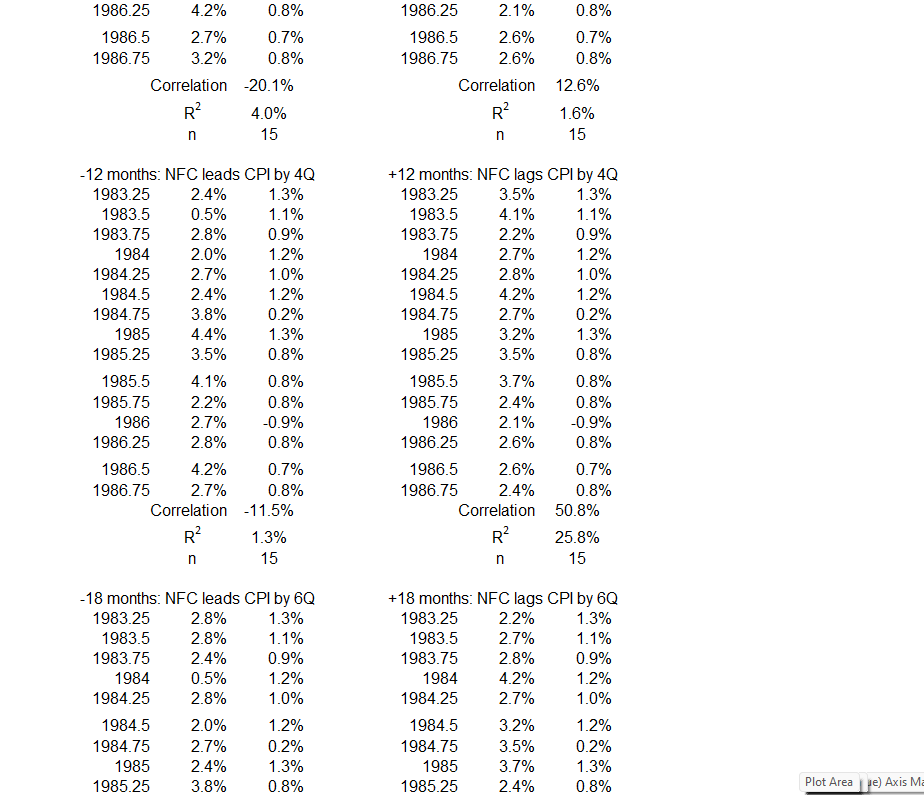
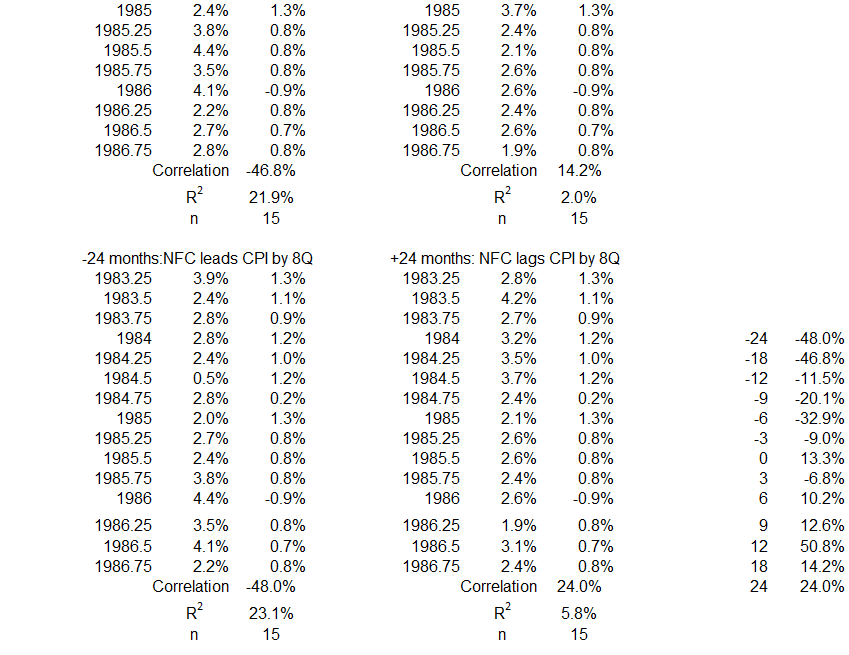
Figure 10. Correlation Between NFC Credit and CPI Inflation 3Q 1983 – 4Q 1986
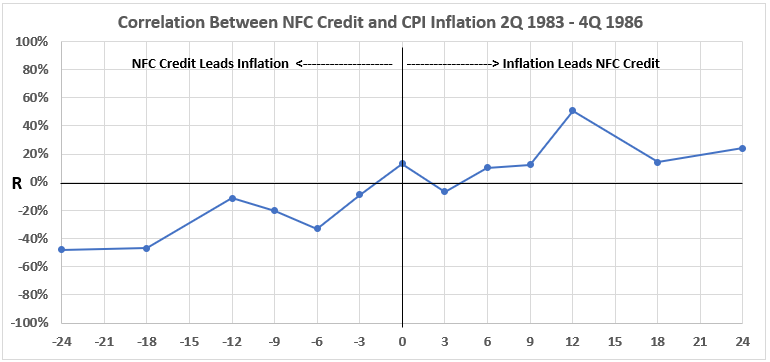
Again, the results in Figure 10 are in sharp contrast to the first two time periods: There are weak negative correlations on the left-hand side of the graph and mostly positive correlations on the right. All the correlations are weak or negligible. There is little prospect for any significant or moderate cause-and-effect possibilities between the two variables during this time period
2Q 1998 – 3Q 2006
Figure 11. U.S. NFC Credit and Inflation 2Q 1998 – 3Q 2006
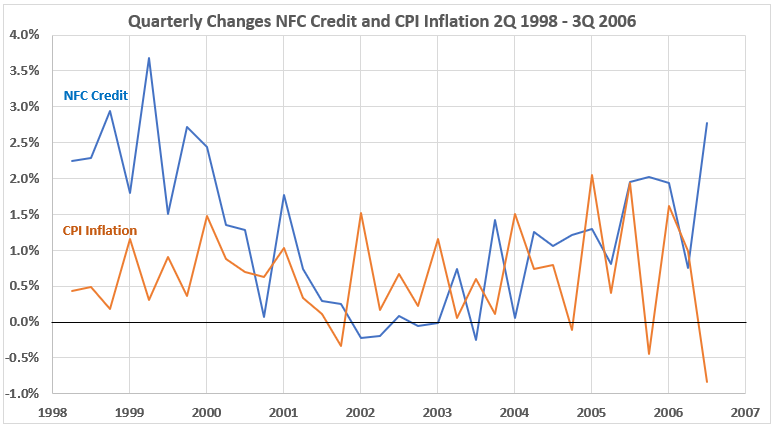
Figure 11 shows a much different behavior for CPI Inflation than seen in the previous three periods. Although there is a level trend for inflation, there is much volatility here. Such wild quarterly swings in inflation changes have not been seen in the previous low inflation change periods.
The data for NFC credit changes also shows widely variable activity. First, it falls in an erratic pattern to low and negative levels, falling below inflation changes. Then, from 2003 on, NFC credit changes rose again above inflation.
Figure 12. Quarterly Changes in NFC Credit (x) vs. CPI Inflation (y) 2Q 1998 – 3Q 2006

This data shows a small negative correlation: R = –9.7%, R2 = 0.9%. This association can be considered negligible. It indicates that at least 99.1% of the quarterly variation in NFC credit is caused by coincident CPI inflation or vice versa. Note: This is for coincident data timelines. The correlations for data timeline leads and lags are in Figure 12.
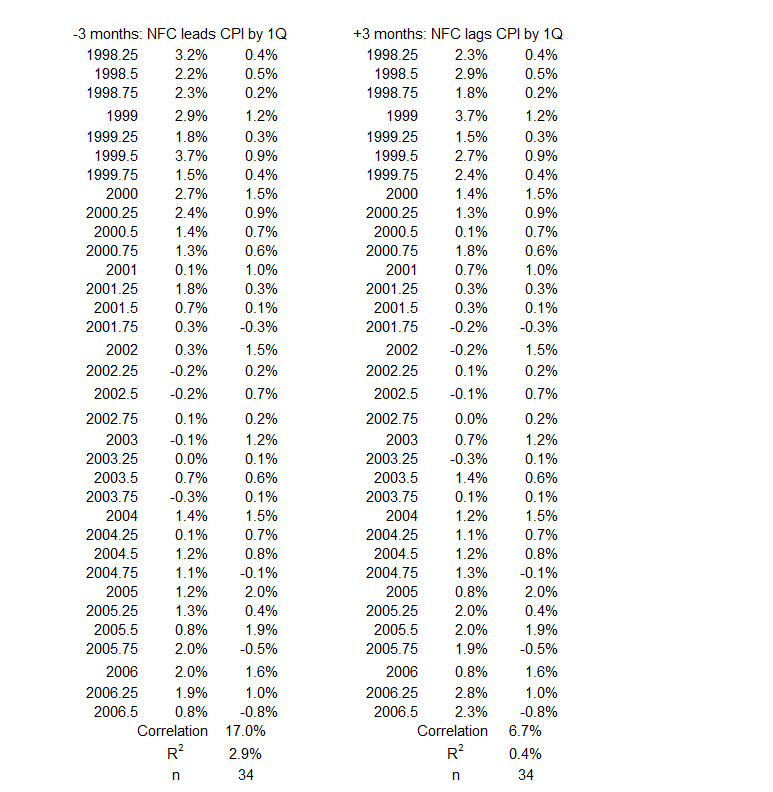
Figure 13. Correlation Between NFC Credit and CPI Inflation 2Q 1998 – 3Q 2006

Figure 13 indicates that there is very little association between NFC credit and CPI inflation for this 102-month period. The highest value of R is 21.2% for any of the data pairs. That produces an R2 = 4.5%, the maximum amount of change possibly caused by a change in the other. In other words, more than 95% of the change in either of these variables by the other has to caused by something else than the other variable during this period.
3Q 2011 – 1Q 2020
Figure 14. U.S. NFC Credit and Inflation 3Q 2011 – 1Q 2020

Figure 14 shows quarterly CPI inflation and NFC credit changes that differ from Figure 11, with much less volatility in both variables. The remarkable points in this graph are three:
- A downward spike in inflation change in the fourth quarter of 2014.
- An upward spike in NFC credit change in the first quarter of 2018.
- An upward spike in NFC credit change in the fourth quarter of 2019.
Figure 15. Quarterly Changes in NFC Credit (x) vs. CPI Inflation (y) 3Q 2011 – 1Q 2020
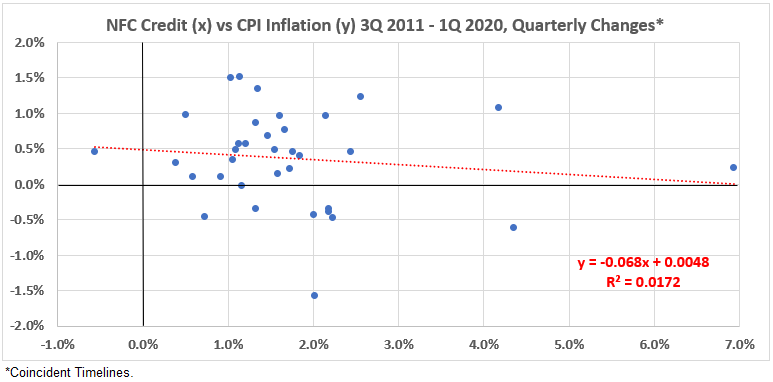
There is a slight negative correlation for this time period: R = –13%, R2 = 1.7%.
Figure 16. Correlation Between NFC Credit and CPI Inflation 3Q 2011 – 1Q 2020
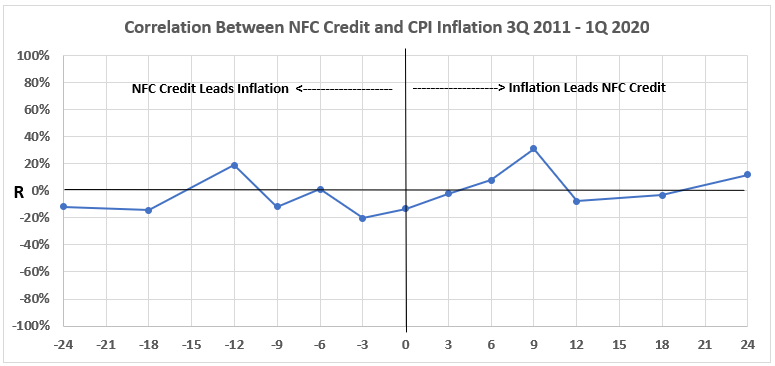
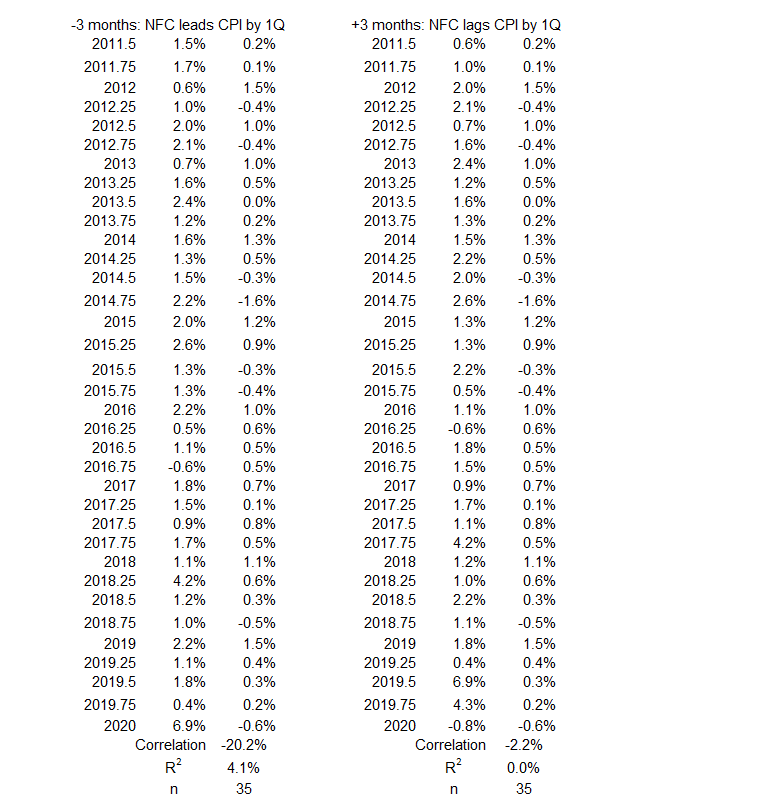
Figure 16 is similar to Figure 13. There is little opportunity for either variable to have possibly caused a significant change in the other. The two largest associations are for inflation change occurring nine months before NFC credit change (R= 31.1%, R2 = 10%) and for NFC credit change occurring three months before inflation change (R= –20.2%, R2 = 4%).
Conclusion
The conclusion is divided into three discussions. First, the analysis results are discussed for the current study of time periods without significant inflation surges up or down. Then, the results of this study are compared to those for household and nonprofit organization (HNO) credit and federal deficit spending. Finally, there is an overall summary and a forward look to future work.
Patterns of Correlation for Periods without Significant Inflation Surges
To simplify this discussion, the five periods without significant surges in inflation are numbered, as shown in Table 2.
Table 2. Time Periods with No Inflation/Disinflation Surges 1952-1022
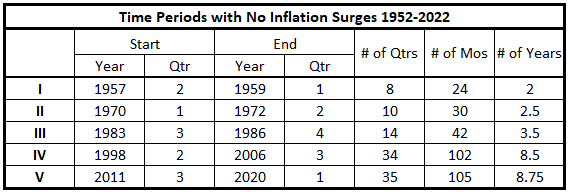
There are fewer correlations found in this data than we might have expected. The general observations for the five periods analyzed in this article are:
- Inflation volatility quarter-to-quarter is much less for I, II, III, and V than for IV. Volatility in II is especially low.
- There are two periods where the positive association between NFC Credit changes and subsequent inflation changes is moderate (I and II).
- Two periods (I and II) weakly or moderately correlate negatively for inflation changes and subsequent NFC Credit changes.
- One period (III) weakly correlates positively for inflation changes and subsequent NFC Credit changes.
- Two periods (IV and V) show limited or negligible positive and negative correlations for all timeline offsets.
Overview of All Nonfinancial Corporate Credit Spending Data Sets
Let’s review the results for all 18 time periods – positive and negative inflation surges plus the periods without surges analyzed above. We use the letter designations in Table 1 and the numerical designations in Table 2 to simplify the discussion.
Table 3 summarizes the results for all time periods for correlation (association) of quarterly NFC Credit changes with CPI Inflation changes. In the table, black letters are for periods with positive inflation surges, red letters are for periods with negative inflation surges, and Roman numerals are for periods without surges.
Table 3. Associations Between NFC Credit and CPI Inflation 1952-2022
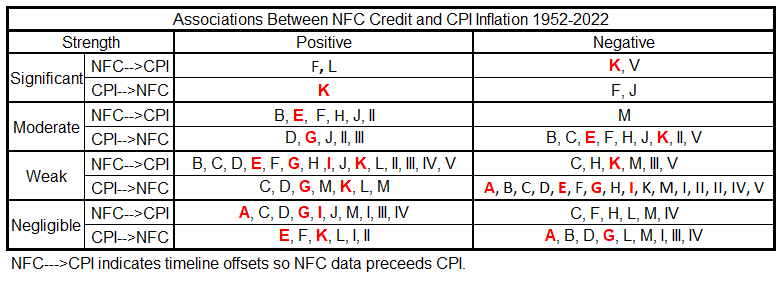
The associations shown in Table 3 indicate the maximum possible cause-and-effect relationships. The moderate correlation strength covers the range 50%>R2>25%. So, for example, R2 = 40%, no more than 40% of one variable can result from the other. But the lower limit of cause-and-effect is 0, depending on other information in addition to the statistical result. Stated differently, the cause of one variable is between 60% and 100% from factors other than the second variable.
The weak and negligible associations give a more satisfying result. They indicate that much (more than 75%) of the cause of one variable comes from other sources than the second (weak association), or nearly 100% comes from other sources (negligible).
There are some possibilities for more than 50% cause-and-effect (significant strength), but without further information, proof is not given.
There are also possibilities for important cause-and-effect relationships between 25% and 50% (moderate strength). But additional information is needed in each case to prove that the causations are not lower than R2 would indicate.
The most remarkable feature of Table 3 is that the number of events in the weak and negligible classes is much more, and much less in the moderate and significant classes, than in other sources of money we have studied.
Comparison of Correlations with Inflation for Federal Deficit Spending and Nonfinancial Corporate Credit Spending
The objective of comparing NFC credit spending with federal government deficit spending is not being pursued. The previous deficit spending and inflation study used correlations between 12-month data points rather than quarterly.5 Quarterly correlations will be determined for federal deficit spending at some point, and then the comparison can be undertaken.
Summary
There are other sources of money creation than the two studied so far. Next, we will look at mortgage issuance, hopefully starting next week.
Appendix
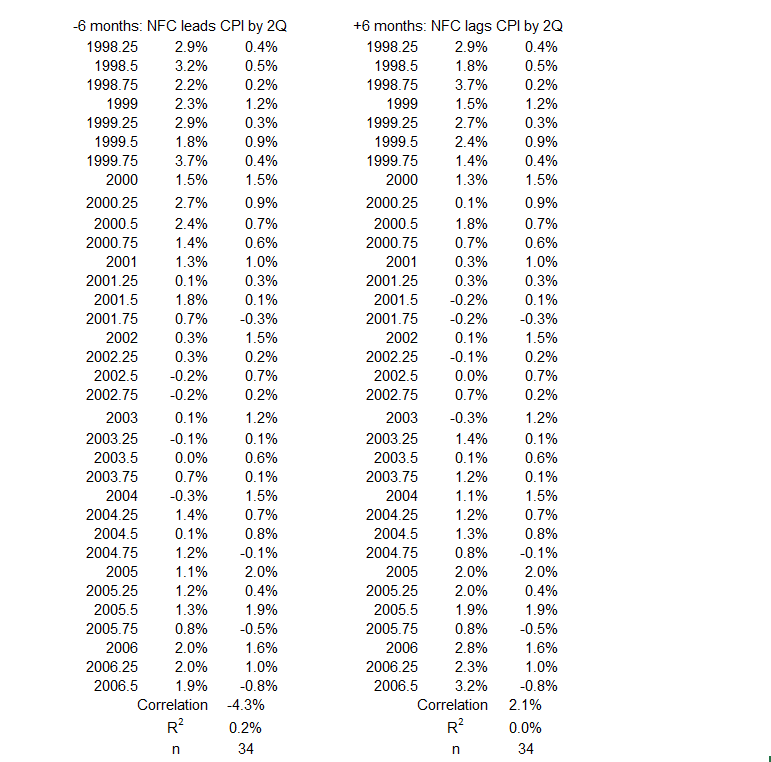
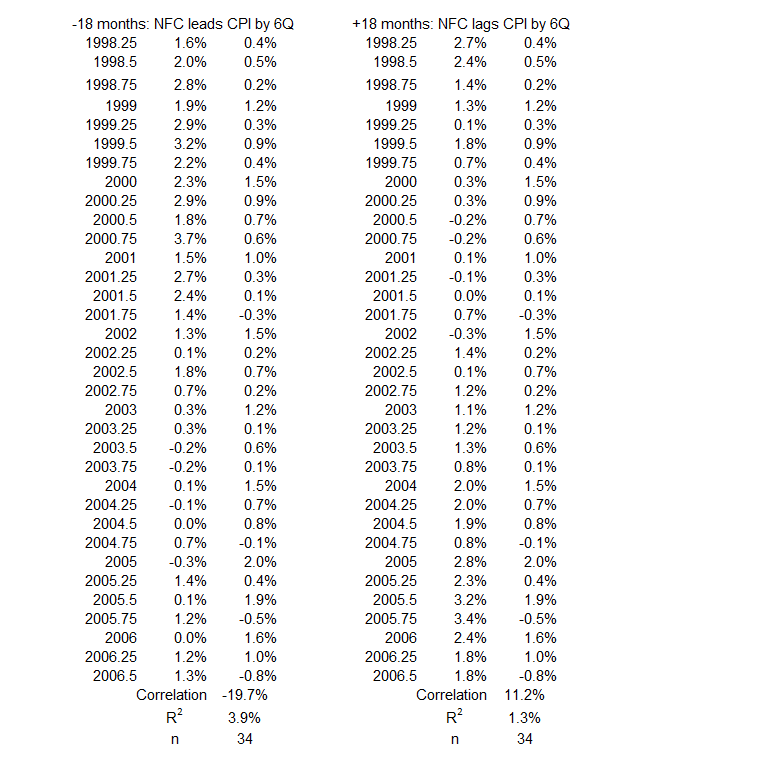
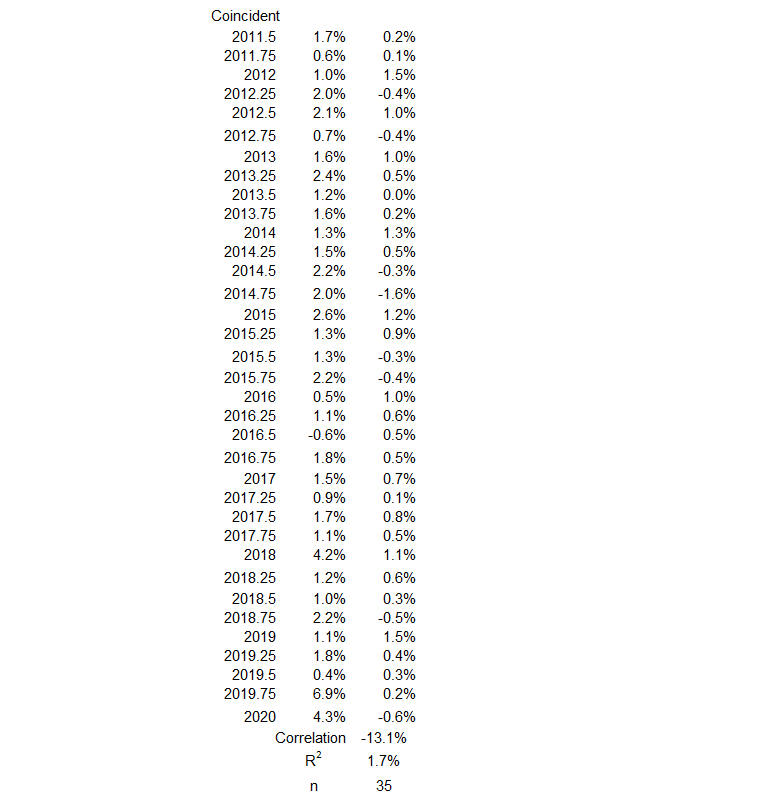
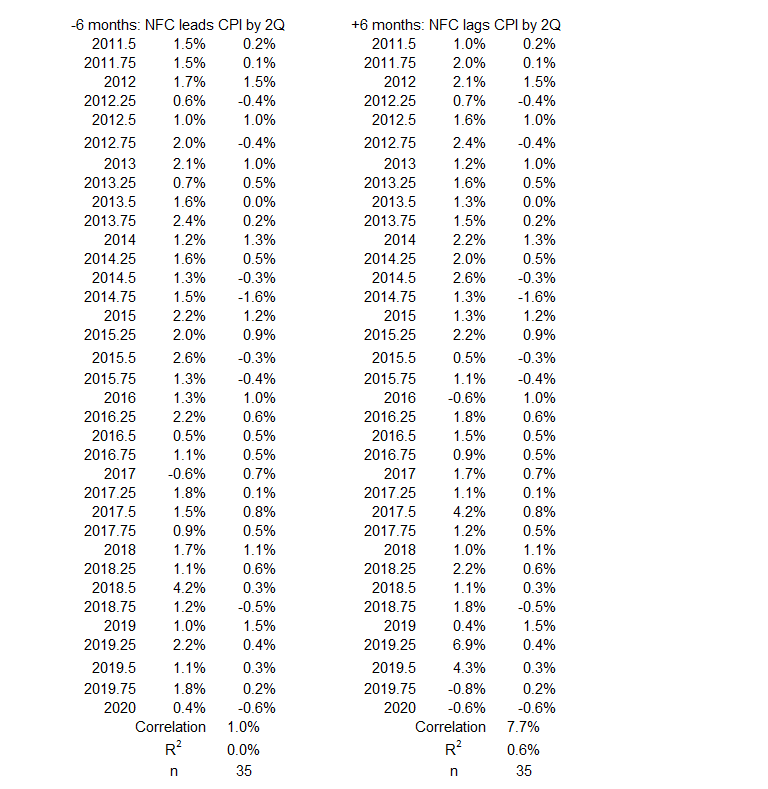
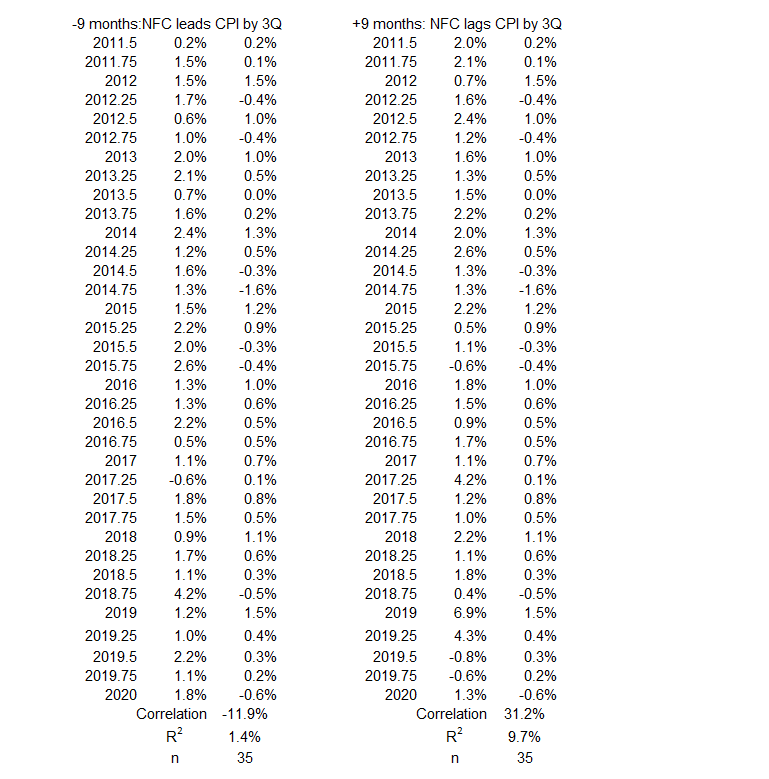
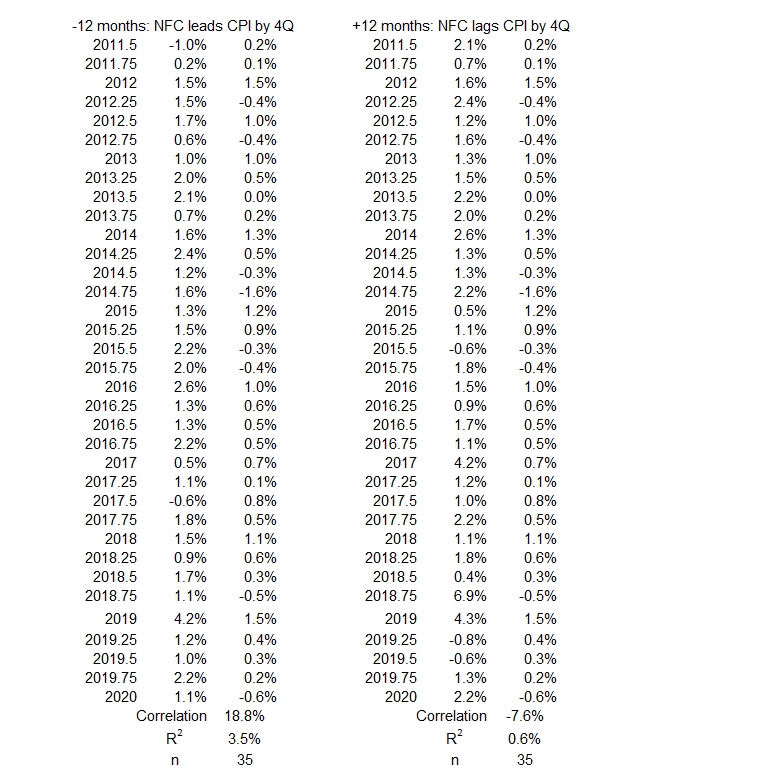
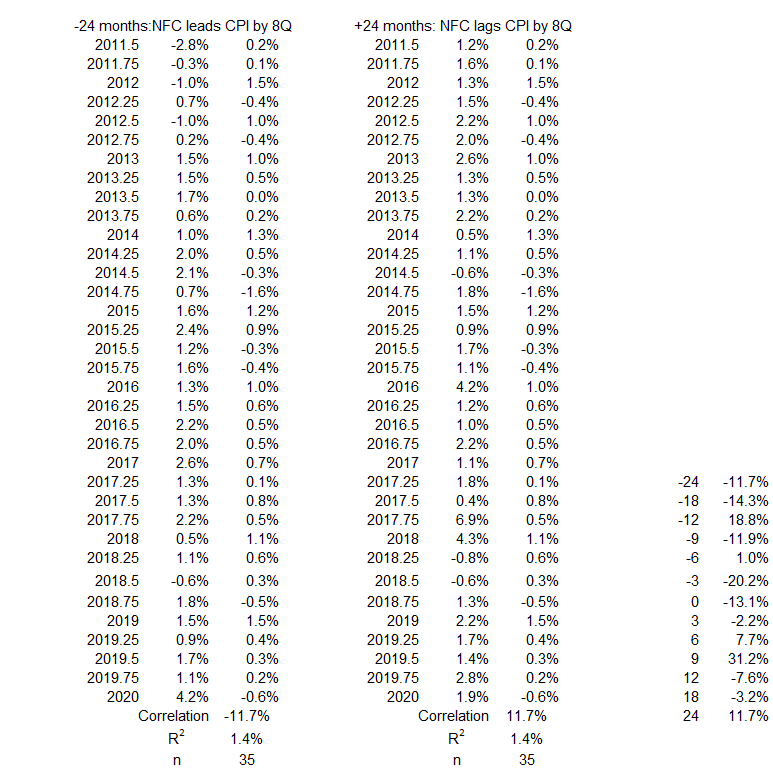
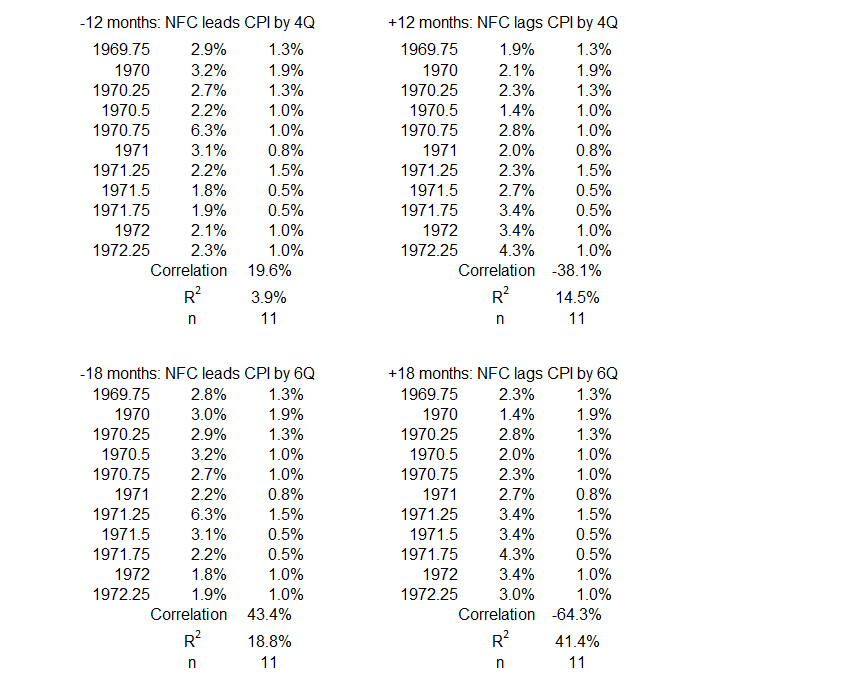
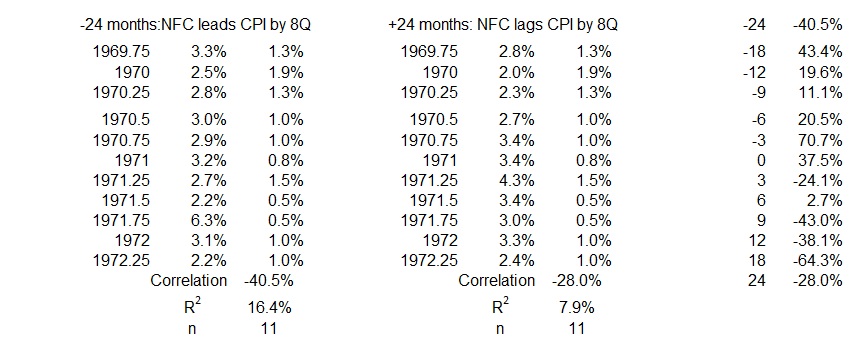
The data sets for each period without surging inflation or disinflation/deflation are below. They come from the tables of timeline alignments3 (Nonfinancial Corporate Credit and Inflation: Part 1).
2Q 1957 – 1Q 1959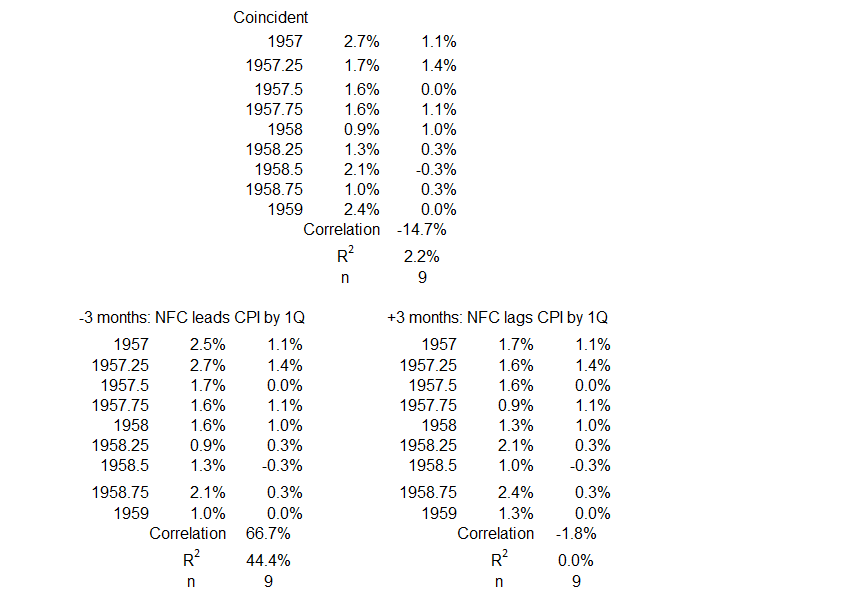
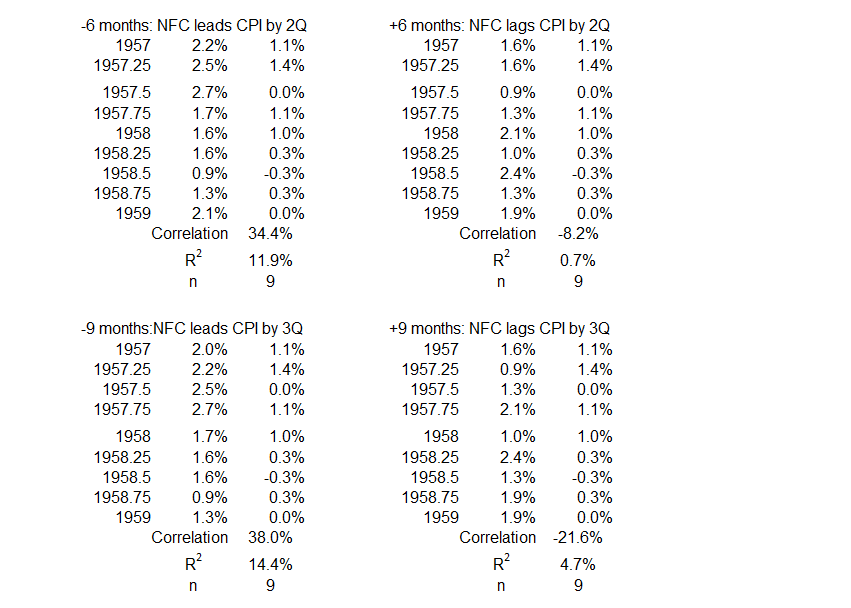
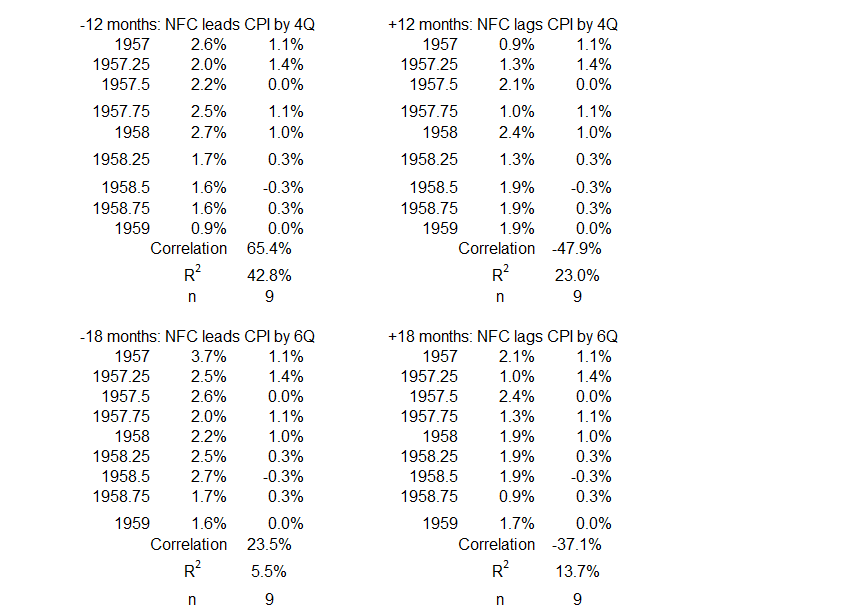
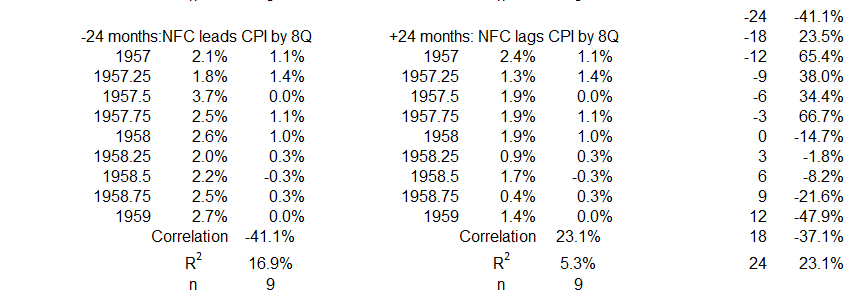
1Q 1970 – 2Q 1972


3Q 1983 – 4Q 1986
2Q 1998 – 3Q 2006
3Q 2011 – 1Q 2020
Footnotes
1. Lounsbury, John, “Consumer Credit and Inflation: Part 2”, EconCurrents, September 10, 2023. https://econcurrents.com/2023/09/10/consumer-credit-and-inflation-part-2/
2. Lounsbury, John, “Consumer Credit and Inflation: Part 3”, EconCurrents, September 17, 2023. https://econcurrents.com/2023/09/17/consumer-credit-and-inflation-part-3/.
3. Lounsbury, John, “Consumer Credit and Inflation: Part 1”, EconCurrents, September 3, 2023. https://econcurrents.com/2023/09/03/consumer-credit-and-inflation-part-1/.
4. Freedman, David, Pisani, Robert, and Purves, Richard, Statistics, Fourth Edition, W.W. Norton & Company (New York) and Viva Books (New Delhi), 2009. See Chapters 8 & 9 for an explanation of how normal distributions relate to determining correlation coefficients. See p. 147 for a discussion of football-shaped scatter diagrams.
5. Lounsbury, John, “Government Spending and Inflation: Reprise and Summary”, EconCurrents, August 20, 2023. https://econcurrents.com/2023/08/20/government-spending-and-inflation-reprise-and-summary/.
