NOAA Updates their Mid-Month Outlook for January 2025 – Major Changes for Temperature – Posted on January 1, 2025

At the end of every month, NOAA updates its Outlook for the following month which in this case is January of 2025. We are reporting on that tonight. In this article, I refer to January 2025 as “The New Month”.
There have been significant changes in the Outlook for the new month and these are addressed in the NOAA Discussion so it is well worth reading. We provided the prior Mid-Month Outlook for the new month for comparison. It is easy to see the substantial changes in the weather outlook by comparing the Mid-Month and Updated Maps. My comments are in a box.
The article includes the Drought Outlook for the new month. NOAA also adjusted the previously issued three-month Drought Outlook to reflect the changes in the new month’s Drought Outlook. We also provide the Week 2/3 Tropical Outlook for the World. The Tropical Outlet includes both direct and indirect potential impacts to the Southern Tier of CONUS. We also include a whole set of forecasts for parts of the new month. These are both useful and provide a crosscheck on the validity of the new month’s Outlook. The whole should be equal to the sum of its parts.
The best way to understand the updated outlook for the new month is to view the maps and read the NOAA discussion. I have highlighted the key statements in the NOAA Discussion.
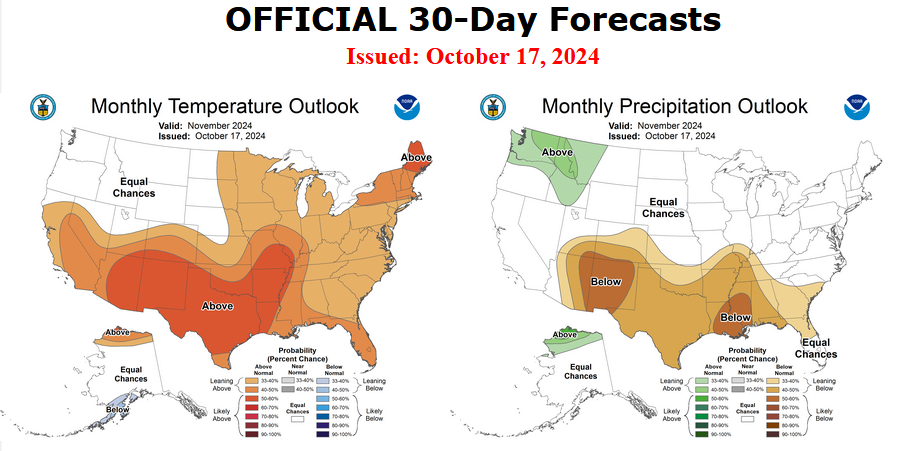
Here is the updated Outlook for January 2025.

For Comparison Purposes, Here is the earlier Mid-Month Outlook for January, 2025

| It is important to remember that the maps show deviations from the current definition of normal which is the period 1991 through 2020. So this is not a forecast of the absolute value of temperature or precipitation but the change from what is defined as normal or to use the technical term climatology.
It is a substantial change from what was issued on December 19, 2024November 21, 2024. Remember, it is the first set of maps that are the current outlook for January which is the new month. One expects some changes 12 days later. However, the changes to the updated new month Outlook are very significant. This then might give us some reason to question the (December 19, 2024) three-month JFM temperature and precipitation Outlooks which are shown in the following graphic. Or one might say that La Nina has arrived too late to be a big factor for January and the impact of the MJO is much more than originally forecast. Thus the February and March Outlooks may still be valid. |
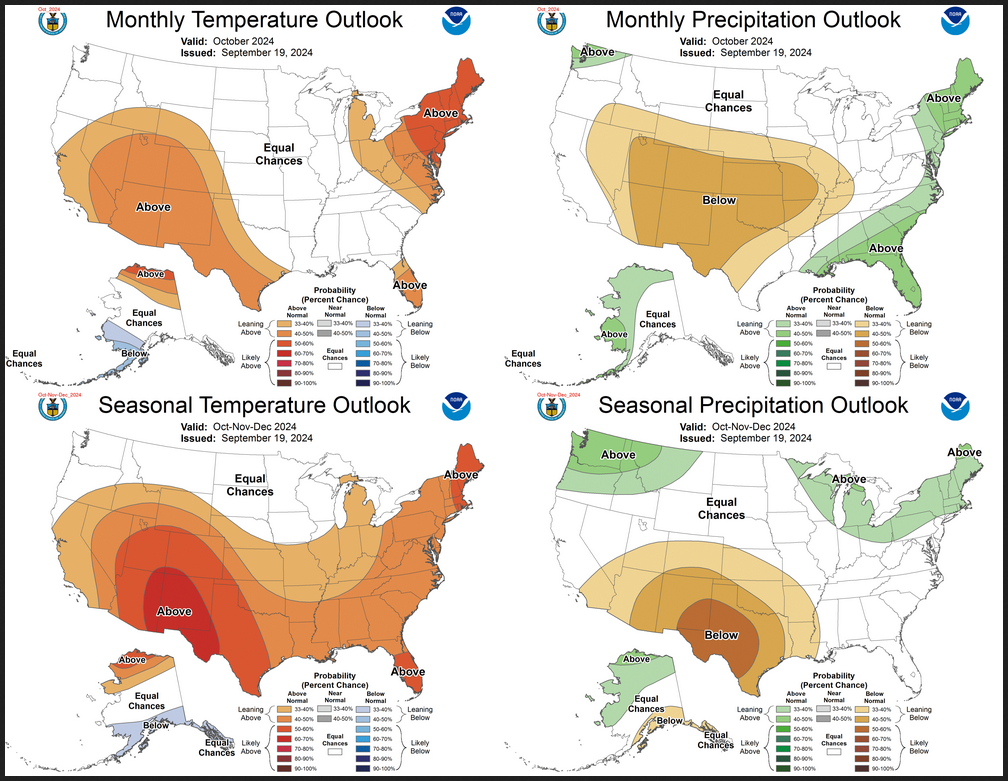
NOAA provided a combination of the Updated Outlook for the New Month and the Three-Month Outlook.

The top pair of maps are again the Updated Outlook for the new month. There is a temperature map and a precipitation map. The bottom row shows the three-month outlooks which includes the new month. I think the outlook maps are self-explanatory.
To the extent that one can rely on a forecast, we would conclude that February and March will be very different than January particularly with respect to temperature. You can subtract January from the three-month Outlook and divide by two to get a combined February/March Outlook.I am still not convinced that there will be a La Nina Winter. Thus I am somewhat skeptical about the NOAA Outlooks. |