Drought Update – January 27, 2024

Every week on Thursday, the Drought Monitor LINK is updated for every state in the U.S. plus most territories.
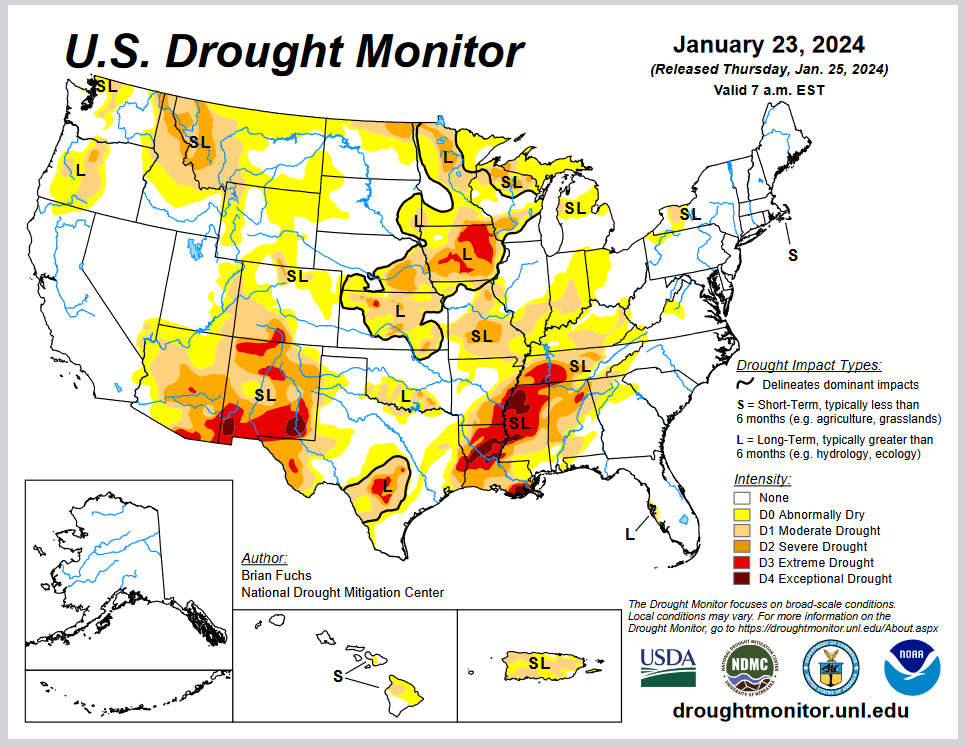

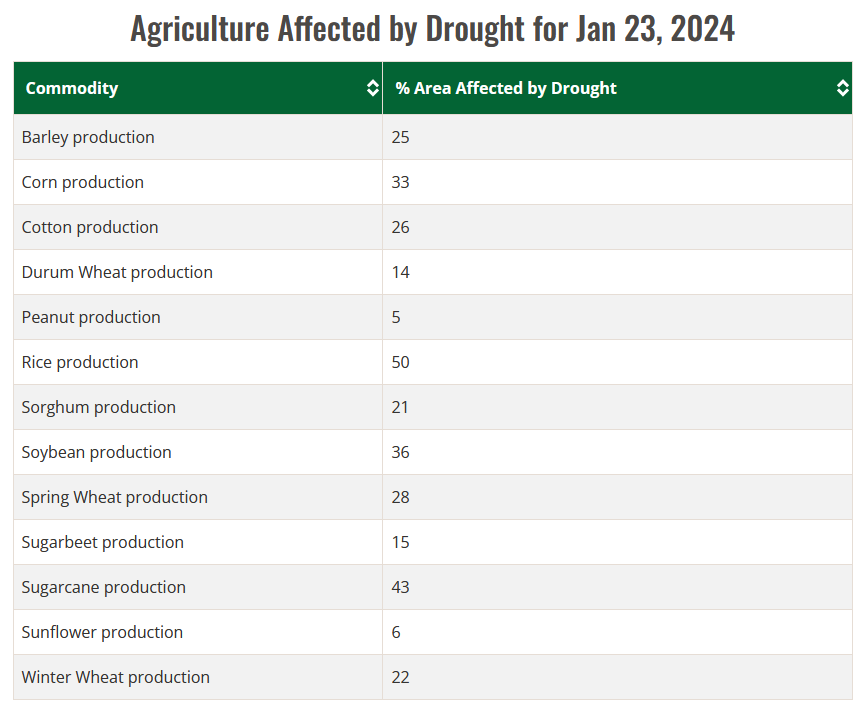
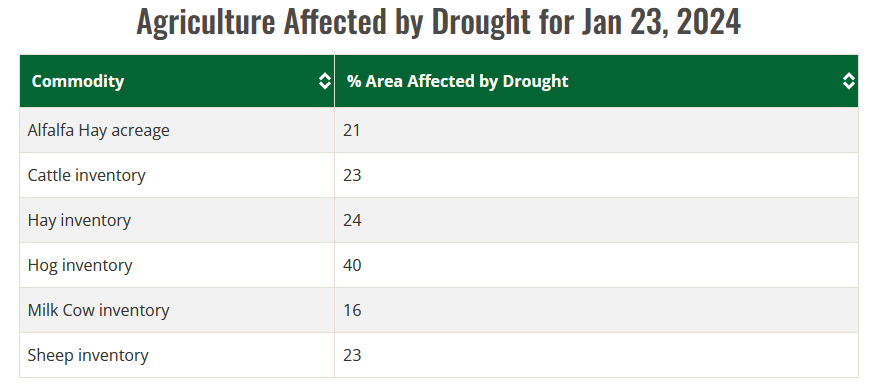


I have provided almost the entire Climate.Gov Post but you can access the Post HERE.
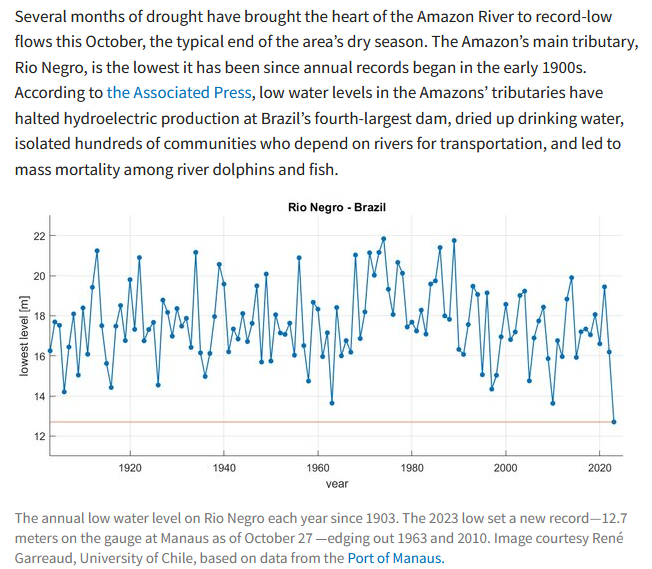

Drought has been a problem this year in the corn and soybean growing area but it has been an ongoing problem for some time. Global Warming makes it worse especially in areas where it leads to reduced precipitation. But in all areas, it results in higher rates of evaporation and possible transpiration.
We are not going into drought in detail in this article but I am showing you some of what comes across my desk from NOAA that you might find interesting.

| You need to click HERE to watch the droughts unfold. Then you can scroll down to see how drought unfolded since 1921. It uses different metrics than the current drought monitor which allows us to go back farther in time. It is very dramatic. It was not possible for me to directly show the images in this article. |
Now we will take a look a the drought history from 2000 to 2020

| I have not included the criteria for the various categories of drought but you can see that since the Drought Monitor has been in existence drought has been fairly prevalent with short periods of minimal drought. |
NOAA updates many of its weather outlooks daily or even more frequently and in many cases issues a discussion with those outlooks. We provide a daily report which focuses on the shorter-term predictions but has links to all the partial-month outlooks. One of the reports issued by NOAA only gets updated on Fridays and since this covers weeks 3 and 4 it is very important. The discussion that gets issued with this week 3-4 NOAA report is often where possible changes to the weather pattern are first identified.
So we have decided to issue a special report on Fridays (which most will read on Saturday) in which for a subset of the information, we show the actual forecast maps not just provide the links. This makes it easier for the reader. We will also include at the end of the article the other information from the daily article
When the Week 3-4 Outlook is issued on Friday, we have a 28-day view of the future. It is important to recognize that the forecasts do not always work out as predicted. But in the article, there are links to obtain updated forecasts. This is important because it appears that changes are happening and the current view of the next 28 days differs substantially from the Monthly Outlook issued just a few days ago.
The regular 48-hour forecast article is included in this article and follows the 28-Day Analysis.
This week we also show the state rankings for August and compare them to the state rankings year to date (YTD).

Here is what we are paying attention to this evening and the next two days from this afternoon’s NWS Forecast.:
...Excessive Rainfall and Severe Thunderstorms possible across northern
tier...

...West cools down as Great Plains into Midwest warm up...

...Critical fire weather conditions to persist across the Great Basin this
weekend...
There has been a large change in the weather outlook for June from NOAA.
At the end of every month, NOAA updates their Early Outlook for the following month which in this case is June. They also issue a Drought Outlook for the following month and update the three-month Drought Outlook. We are reporting on that tonight. The updated Outlook is quite different from the Early Outlook which NOAA now calls the Mid-Month Outlook. For temperature, the above-normal area is smaller than the Mid-Month Outlook and a large intrusion of colder air is expected along much of the Northern Tier. The drier than normal area is significantly reduced from the Mid-Month Outlook and shifted a bit and there are two additional areas of wetter than normal in the Outlook.
We provide partial-month outlooks for the first 24 days of June which allows us to somewhat assess if the Monthly Outlook is consistent with the partial month forecasts and it generally is. But we will not be able to answer that question definitively until the Week 3-4 Outlook is issued on Friday.
We also provide enough information for readers to understand any changes from the Mid-Month Outlook and we try to figure out why these changes were made. Many of the changes are explained in the NOAA discussion which is included in the article. The partial-month forecasts that we have provided show how NOAA thinks this will play out as the weather pattern evolves during June.
There is also a discussion of the ENSO condition which is slightly different than what NOAA used to develop the Mid-Month Outlook. The Negative Arctic Oscillation (AO) expected in the first half of June is a major factor.
We have also begun our tropical storm coverage. Yes, it is that time of the year.
Today is the third Thursday of the month so right on schedule NOAA has issued what I describe as their Four-Season Outlook. The information released also includes the Early Outlook for the single month of June plus the drought outlook for the next three months. I summarize the information issued and provide links to additional maps. Additionally, I have included quite a bit in this article. I want to remind everyone that last Thursday NOAA issued their ENSO outlook and that has a lot of influence on their Seasonal Outlook. The Seasonal Outlook generally reflects La Nina conditions initially with no clear indication of when this La Nina will end. There could be a triple-dip La Nina. That is not the most likely scenario but certainly can not be discounted. There is fairly good news with respect to the North American Monsoon (NAM).
The exact location of the Drought seems to be shifting a bit especially after this Summer. See the set of twelve overlapping three-month maps and my comments for details.

We have discussed this before but the fact that there is a possibility of a third La Nina Winter is a good reason to discuss it again. I would say that is is not real likely. But if it happens, it would be very serious. So that is why it is worth discussing. We have not previously discussed how Global Warming makes any drought more dangerous but that should be obvious. We know that the negative phase of the Pacific Decadal Oscillation (PDO) results in a higher ratio of La Nina to El Nino Events. But we have not discussed how Global Warming might impact the PDO. So we are not addressing the broader question of whether or not Global Warming is increasing the chance of a third year of La Nina but simply looking at the evidence that a third year is a possibility. It seems that NOAA may be more concerned about the possibility than some other weather forecasting agencies in other part of the world, but we will attempt to show that their concern is not unreasonable.

The National Centers of Environmental Information (NCEI) publishes a monthly analysis of the U.S. climate as well as an annual report. John Bateman, a meteorologist, and an NOAA Public Affairs specialist, sends out an email that summarizes the NCEI report. This article is based on the summary written by John Bateman. At the end of the article is the link to the full NCEI Report. The key takeaways: CONUS had the fourth warmest year in recent history and 20 billion-dollar disasters were identified.
Written by Sig Silber
Here are the latest weather and drought forecasts for January 2022. Every month on the last day of the month NOAA updates the weather forecast for the following month – in this case, January of 2022. Also included is the summary from a recent USDA report on Irrigation by Frank Ward who is a professor at New Mexico State University.