Today’s Economic Releases Compiled by Steven Hansen, Publisher:
The year-end bonus is a tradition for many employers, but 2023 is seeing the highest rate of companies not hand out bonuses since 36% of companies opted not to give out bonuses in 2019, according to survey results released Monday from Challenger, Gray & Christmas, Inc. In the Annual Challenger Year-End Survey, 34% of employers are not awarding a bonus this year, 2% of which are not awarding one after awarding one a year earlier. This is up from 27% who did not hand out company bonuses in 2022. Meanwhile, 15% of companies are lowering the value of the bonus, up from 11% who decreased company bouses last year.
Here is a summary of headlines we are reading today:
U.S. Nuclear Sector Set for Major Transformation
Christmas 2023 Gas Prices Head to $2.99 for First Time in Years
Renewables Top 50% Share of Germany’s Power Demand for The First Time
Swiss National Bank Urged To Exit Investments in Fracking
Major Shipping Firms Halt Red Sea Routes Following Houthi Attacks
Nikola founder Trevor Milton sentenced to four years in prison for fraud
S&P 500 closes higher, Nasdaq jumps for eighth day as both indexes add to 7-week advance: Live updates
Fed’s Goolsbee says he was ‘confused’ by last week’s market reaction
FTX files revised proposal to end bankruptcy and return billions to creditors: CNBC Crypto World
Central Banks Brought Excessive Inflation; Now They Bring Stagnation…
Southwest Airlines’ holiday meltdown: Will customers get any money from the $140 million settlement?
Click on the “Read More” below to access these, other headlines, and the associated news summaries moving the markets today.
This article focuses on what we are paying attention to in the next 48 to 72 hours. The article also includes weather maps for longer-term outlooks and a six-day World weather outlook which can be very useful for travelers.
We start with the U.S. Information. That is the longest part of the article. Then we have a short section on World Weather and then we address the Tropics. When there are tropical storms that might impact the U.S. we provide more detailed information which updates frequently on those storms.
Please click on “Read More” below to access the full report as I have moved the highlights into the body of the report where it is followed by the Today, Tomorrow and the Next Day maps and a lot more. I will try to feature the most important graphic in the lede paragraph on the home page. But there are often multiple maps that are very important so it is best to read the full article. We now have a snow report and it is possible to get a ten-day NWS forecast for the zip code of your choice.
In Part 5, we found that there are 6,435 possible outcomes for the complete characterization of a process of repeating three coin flips. This arises because a 3-flip sequence must be repeated eight times to allow for the possibility of all eight equally probable sequence results occurring. In this article, we calculate the probability of obtaining any individual outcome and also the probability of obtaining an outcome of each of the 22 outcome types.
First I have to describe what ENSO is. It is going to be a short definition of a very complex topic.
There appears to be a pattern that some incorrectly call a fixed cycle (rather than more of an oscillation) where sometimes the warmest water along the Equator in the Pacific Ocean is found to the west (officially the IndoPacific Warm Pool) and sometimes it is found to the east (leading to the name El Niño). When it is to the west we call that a potential La Nina. When it is to the East we call that a potential El Nino. And when it is not clearly to the west or the east we call it ENSO Neutral.
I am not in this article going to explain why the warm water is sometimes to the east or why it is sometimes to the east. It is very complicated.
Why is it important?
Generally speaking, warmer water evaporates more easily than cooler water. Where ocean water evaporates, clouds form. This rising of moisture to form clouds creates a circulation pattern called the Walker Circulation with rising air forming clouds and due to circulation patterns in other places there is precipitation and the air sinks.
Through other mechanisms that I will not describe in this article, the precipitation also spreads north and south of the Equator to impact weather patterns in the mid-latitudes all around the world.
What is the problem?
One problem is that the rising and subsiding process does not always materialize or match where we detect the warmer than normal water and the cooler than normal water. If it does not materialize, the changing distribution of the warmer and cooler water has little or no impact on the atmosphere and hence on weather. Thus the potential El Nino or La Nina does not become a true El Nino or La Nina. If it does materialize but not where we predict it would, that creates a El Nino or La Nina with different impacts than usual.
How to measure the process.
This is described in this article which is really a two-year-old ENSO Blog Post. I have included it in its entirety other than comments made to the article.
Short Abstract
The traditional way of measuring the distribution of warm and cool water is to do measurements in certain areas in the Eastern Pacific and consider the surface temperature relative to history. If the temperature of the surface area in the selected area is equal to or more than 0.5C above normal, it is potentially an El Nino. If it is -0.5C or cooler it is potentially a La Nina.
Where is the problem?
The potential problem is that ocean surface temperatures are warming. So is the threshold of 0.5C above or below normal as meaningful as it has been in the past?
What is the solution?
The traditional solution has been to revise the definition of normal periodically.
What is this ENSO Blog Post about?
Is the traditional approach adequate or would recalculating the temperature anomaly to consider the overall level of ocean warming or the ocean warming nearby improve the ability of the formula to predict weather that is more consistent with the assessment of El Nino and La Nina periods? This means using what is called a Relative Oceanic ENSO Index instead of the Regular Oceanic ENSO Index.
I will now let the ENSO Blog Post explain this. I do not think the described method has been implemented or at least not officially. One reason for that might be that it is an improvement but does not fully address the complications that warming oceans cause to our ability to measure and anticipate the impacts of the ENSO process; a process which may gradually change dramatically. This is the start of a much more complicated discussion but it is a good start.
This article focuses on what we are paying attention to in the next 48 to 72 hours. The article also includes weather maps for longer-term outlooks and a six-day World weather outlook which can be very useful for travelers.
We start with the U.S. Information. That is the longest part of the article. Then we have a short section on World Weather and then we address the Tropics. When there are tropical storms that might impact the U.S. we provide more detailed information which updates frequently on those storms.
Please click on “Read More” below to access the full report as I have moved the highlights into the body of the report where it is followed by the Today, Tomorrow and the Next Day maps and a lot more. I will try to feature the most important graphic in the lede paragraph on the home page. But there are often multiple maps that are very important so it is best to read the full article. We now have a snow report and it is possible to get a ten-day NWS forecast for the zip code of your choice.
Today’s Economic Releases Compiled by Steven Hansen, Publisher:
The 23 participants in the December 2023 Livingston Survey predict higher output growth for the second half of 2023, compared with their projections in the June 2023 survey. The forecasters expect 3.1% annualized growth in real GDP during the second half of 2023. Next year they have lowered their forecast for unemployment and their inflation expectations are little changed.
Industrial Production remains in a recession declining 0.4% year-over-year. The components: manufacturing declined 0.8%, mining up 2.3%, and utilities down 1.0%.
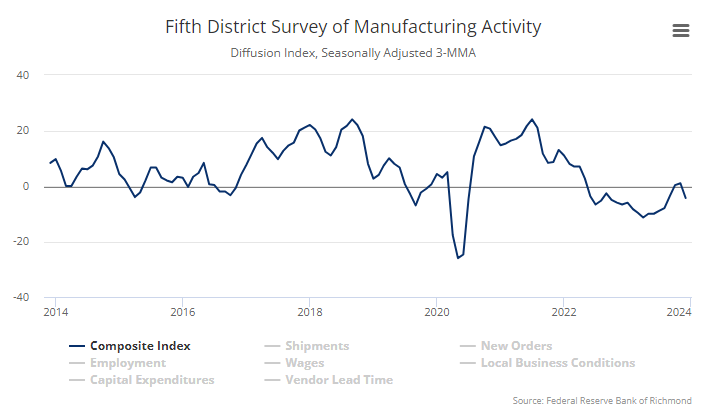
Business activity declined in the Empire State Manufacturing Survey. The headline general business conditions index fell twenty-four points to -14.5 continuing to oscillate around -8.6 — the average observed over the past year. New orders fell for a third consecutive month, and shipments also declined. Manufacturing continues in a recession in the U.S.
Here is a summary of headlines we are reading today:
U.S. Drillers Cut Drilling Activity Amid Stabilizing Oil Prices
Houthis Continue To Attack Ships Near Vital Oil Chokepoints
Santa Getting Boost From Lower Gasoline Prices
Global Coal Demand Is Set to Hit a Record High in 2023
Citigroup employees, on edge over layoffs, told they can work remotely until the new year
10-year Treasury yield slips, adds to this week’s steep decline
The Dow will try to keep its record-setting momentum in the week ahead as more inflation data looms
Intel’s stock sheds a bear as a key catalyst awaits
Top Fed officials says the Fed isn’t ‘really talking about cutting interest rates right now’
Click on the “Read More” below to access these, other headlines, and the associated news summaries moving the markets today.
On the second Thursday of every month, NOAA (really their Climate Prediction Center CPC) issues its analysis of the status of ENSO. This includes determining the Alert System Status. NOAA again describes their conclusion as “ENSO Alert System Status: El Nino Advisory”
There is not much doubt that we have an El Nino. How long it lasts and its strength remains to be seen. NOAA may be more conservative compared to some other Weather Advisory Organizations. Some of the other Weather Advisory Organizations are predicting a higher probability for a “Historically Strong” El Nino. I personally believe that this El Nino will be somewhat of an underachiever. We will be finding out over the next two months.
We have included a link to an interesting ENSO Blog article by Emily Becker.
CLIMATE PREDICTION CENTER ENSO DISCUSSION
The second paragraph is what is important:
” The most recent IRI plume favors El Niño to continue through the Northern Hemisphere winter 2023-24. Based on the latest forecasts, there is now a 54% chance of a “historically strong” El Niño during the November-January season (³ 2.0°C in Niño-3.4). An event of this strength would potentially be in the top 5 of El Niño events since 1950. While stronger El Niño events increase the likelihood of El Niño-related climate anomalies, it does not imply expected impacts will emerge in all locations or be of strong intensity (see CPC seasonal outlooks for probabilities of temperature and precipitation). In summary, El Niño is expected to continue through the Northern Hemisphere winter, with a transition to ENSO-neutral favored during April-June 2024 (60% chance;).”
Below is the middle paragraph from the discussion last month. We see that this month there is an increased chance of a “historically strong” event.
“The most recent IRI plume favors El Niño to continue through the Northern Hemisphere spring 2024. Based on latest forecasts, there is a greater than 55% chance of at least a “strong” El Niño (³ 1.5°C in Niño-3.4 for a seasonal average) persisting through January-March 2024. There is a 35% chance of this event becoming “historically strong” (³ 2.0°C) for the November-January season. Stronger El Niño events increase the likelihood of El Niño-related climate anomalies, but do not necessarily equate to strong impacts (see CPC seasonal outlooks for probabilities of temperature and precipitation). In summary, El Niño is anticipated to continue through the Northern Hemisphere spring (with a 62% chance during April-June 2024.”
We now provide additional detail but I am keeping this article shorter than usual because nothing much has changed since last month.
CPC Probability Distribution
Here are the new forecast probabilities. The probabilities are for three-month periods e.g. OND stands for October/November/December.
Here is the current release of the probabilities:
You can clearly see the forecast does not extend beyond JAS 2024 and one does see a tail-off in the probabilities for El Nino conditions in the Eastern Pacific after the winter season. Is a return to La Nina in our future?
Here is the forecast from late last month.
The analysis this month and last month are pretty similar.
This article focuses on what we are paying attention to in the next 48 to 72 hours. The article also includes weather maps for longer-term outlooks and a six-day World weather outlook which can be very useful for travelers.
We start with the U.S. Information. That is the longest part of the article. Then we have a short section on World Weather and then we address the Tropics. When there are tropical storms that might impact the U.S. we provide more detailed information which updates frequently on those storms.
Please click on “Read More” below to access the full report as I have moved the highlights into the body of the report where it is followed by the Today, Tomorrow and the Next Day maps and a lot more. I will try to feature the most important graphic in the lede paragraph on the home page. But there are often multiple maps that are very important so it is best to read the full article. We now have a snow report and it is possible to get a ten-day NWS forecast for the zip code of your choice.
Today’s Economic Releases Compiled by Steven Hansen, Publisher:
In November 2023, prices for U.S. imports and exports remained in deflation with import prices declining 1.4% year-over-year and export prices declining 5.2% year-over-year. Lower fuel prices more than offset an increase in nonfuel prices for imports.
Retail sales perked up modestly. Advance estimates of U.S. retail and food services sales for November 2023 were up 4.1% year-over-year (2.8% year-over-year inflation adjusted). The biggest drivers of this modest growth were non-store retailers, and restaurants.
In the week ending December 9, the advance figure for seasonally adjusted initial unemployment claims 4-week moving average was 213,250, a decrease of 7,750 from the previous week’s revised average. The previous week’s average was revised up by 250 from 220,750 to 221,000.
Here is a summary of headlines we are reading today:
New Catalyst and Solar Process Produces Low Cost Hydrogen
Would the U.S. Intervene to Defend Guyana’s Oil Riches?
Oil Gains 4% on Interest Rates, 2024 Forecasts
The World Could Soon Face A Copper Supply Deficit
Electric Vehicle Market Sees 20% Surge in Global Sales for November
Dow continues rally, closes up 100 points after strong economic data, hopes for falling rates: Live updates
Intel unveils new AI chip to compete with Nvidia and AMD
Congress passes $886 billion defense policy bill, Biden to sign into law
Retail sales rose 0.3% in November vs. expectations for a decline
Eggflation Returns As Top Producer Hit With Bird Flu In Kansas
10-year Treasury yield ends at 3.9%, its lowest level since July
Click on the “Read More” below to access these, other headlines, and the associated news summaries moving the markets today.