Short Term and Intermediate-Term Weather Outlooks for the U.S. and a Six-Day Forecast for the World: posted January 20, 2024

This article focuses on what we are paying attention to in the next 48 to 72 hours. The article also includes weather maps for longer-term U.S. outlooks and a six-day World weather outlook which can be very useful for travelers.

First the highlights from the NWS.

Short Range Forecast Discussion
NWS Weather Prediction Center College Park MD
Sat Jan 20 2024
Valid 12Z Sat Jan 20 2024 – 12Z Mon Jan 22 2024

…Heavy rain expected to impact northern to central California today and
early Monday, with heavy wet snow along the Sierra Nevada…

…More freezing rain is forecast for the Columbia River Basin…

…Arctic air will dominate the eastern two-thirds of the country with
lake-effect and upslope snows remaining active today…
 

Please click on “Read More” below to access the full report issued today.

19 Jan 2023 Market Close & Major Financial Headlines: The Dow And S&P 500 Set New Historic Highs After Wall Street’s Three Major Indexes Opened Sharply Higher Then Closing Above 1%

Summary Of the Markets Today:

  • The Dow closed up 395 points or 1.05%,
  • Nasdaq closed up 1.70%,
  • S&P 500 closed up 1.23%,
  • Gold $2,031 up $9.00,
  • WTI crude oil settled at $74 down $0.18,
  • 10-year U.S. Treasury 4.132% down 0.012 points,
  • USD index $103.25 down $0.29,
  • Bitcoin $41,620 up $693 (1.69%),
  • Baker Hughes Rig Count: U.S. +1 to 620 Canada +10 to 223

*Stock data, cryptocurrency, and commodity prices at the market closing.


Click here to read our current Economic Forecast – January 2024 Economic Forecast: Our Index Turns Slightly Negative


Today’s Economic Releases Compiled by Steven Hansen, Publisher:

Total existing-home sales – completed transactions that include single-family homes, townhomes, condominiums, and co-ops – decreased 6.2% year-over-year. Total housing inventory is up 4.2% from one year ago. Unsold inventory sits at a 3.2-month supply -up from 2.9 months in December 2022. The median existing-home price for all housing types in December was $382,600 – an increase of 4.4% from December 2022 ($366,500). NAR Chief Economist Lawrence Yun stated:

The latest month’s sales look to be the bottom before inevitably turning higher in the new year. Mortgage rates are meaningfully lower compared to just two months ago, and more inventory is expected to appear on the market in the upcoming months. Despite sluggish home sales, 85 million homeowning households enjoyed further gains in housing wealth. Obviously, the recent, rapid three-year rise in home prices is unsustainable. If price increases continue at the current pace, the country could accelerate into haves and have-nots. Creating a path towards homeownership for today’s renters is essential. It requires economic and income growth and, most importantly, a steady buildup of home construction.

According to the University of Michigan Survey of Consumer Confidence Director Joanne Hsu:

Consumer sentiment soared 13% in January to reach its highest level since July 2021, showing that the sharp increase in December was no fluke. Consumer views were supported by confidence that inflation has turned a corner and strengthening income expectations. Over the last two months, sentiment has climbed a cumulative 29%, the largest two-month increase since 1991 as a recession ended. For the second straight month, all five index components rose, with a 27% surge in the short-run outlook for business conditions and a 14% gain in current personal finances. Like December, there was a broad consensus of improved sentiment across age, income, education, and geography. Democrats and Republicans alike showed their most favorable readings since summer of 2021. Sentiment has now risen nearly 60% above the all-time low measured in June of 2022 and is likely to provide some positive momentum for the economy. Sentiment is now just 7% shy of the historical average since 1978.

Here is a summary of headlines we are reading today:

  • North Dakota Oil Output To Be Lower For Another Month: State Regulator
  • Brent Backwardation Increases as Red Sea Hostilities Continue
  • US Oil, Gas Drillers Add 1 Rig Despite Freezing Temps
  • Precious Metal Prices Trade Sideways After Short-Lived Rally
  • U.S. Oil Production Flatlines
  • S&P 500 rallies 1% to all-time high, surpassing previous record set in 2022: Live updates
  • This record-breaking market just keeps going higher and higher. Here’s why
  • The S&P 500 tops a record high that ‘clears the charts’ of resistance ahead of a week of earnings, inflation data
  • December home sales slump to close out worst year since 1995
  • U.S. home sales see worst year since 1995
  • Traders give up on a March rate cut by Fed as bond-market inflation expectations move higher

Click on the “Read More” below to access these, other headlines, and the associated news summaries moving the markets today.

NOAA Updates its Seasonal Outlook on January 18, 2024 – Winners and Losers. Rapid Changes in ENSO Phases

Lightly Edited at 7:38 pm EST January 20, 2024

On the third Thursday of the month right on schedule NOAA issued their updated Seasonal Outlook which I describe as their Four-Season Outlook because it extends a bit more than one year into the future. The information released also included the Mid-Month Outlook for the following month plus the weather and drought outlook for the next three months.  I present the information issued by NOAA and try to add context to it. It is quite a challenge for NOAA to address the subsequent month, the subsequent three-month period as well as the twelve successive three-month periods for a year or a bit more.

With respect to the long-term part of the Outlook which I call the Four-Season Outlook, there is a fairly rapid transition from El Nino to ENSO Neutral to LaNina. Thus there are some changes from what was issued last month.

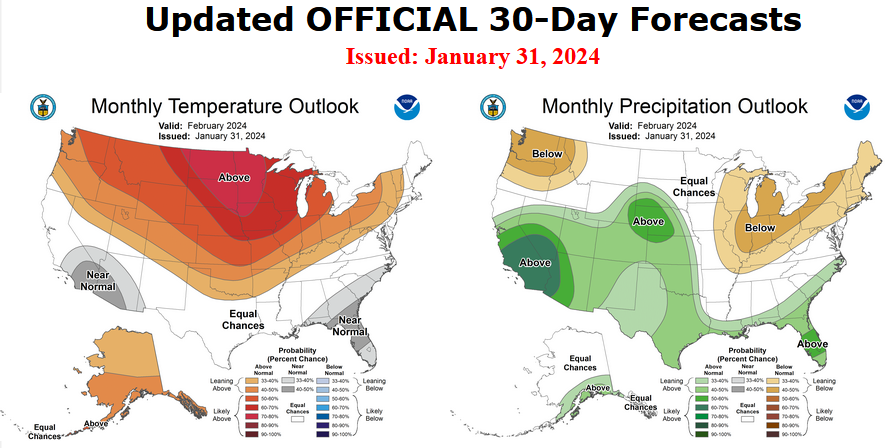
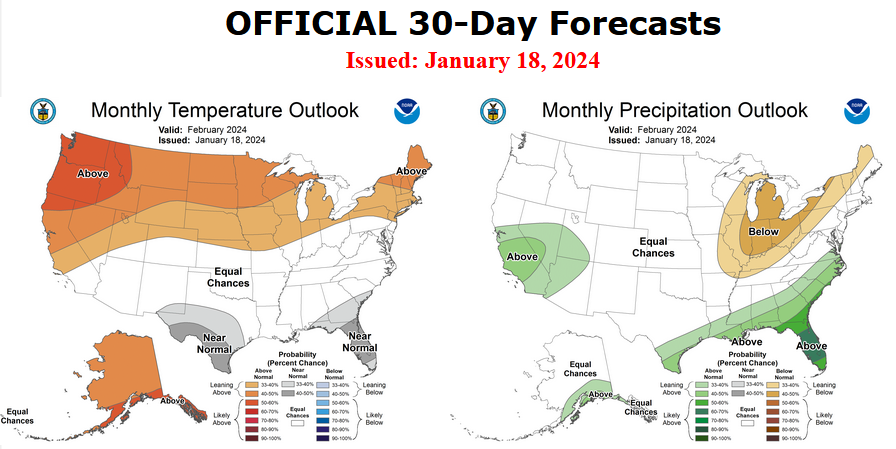
First, Let’s Take a Look at the (mid-month) Outlook for February.

It will be updated on the last day of January.


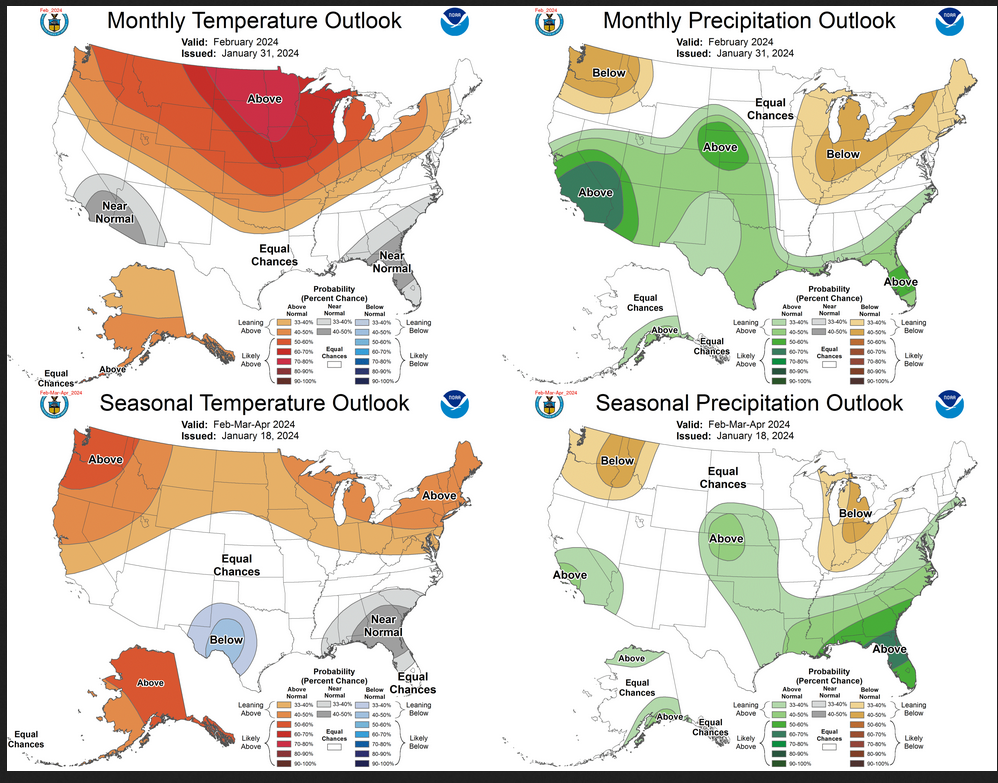
The top row is what is now called the Mid-Month Outlook for next month which will be updated at the end of this month. There is a temperature map and a precipitation map. The second row is a three-month outlook that includes next month.  I think the outlook maps are self-explanatory. What is important to remember is that they show deviations from the current definition of normal which is the period 1991 through 2020.  So this is not a forecast of the absolute value of temperature or precipitation but the change from what is defined as normal or to use the technical term “climatology”.

Notice that the outlook for next month and the three-month outlooks are somewhat different, particularly with respect to precipitation.  This tells us that March and April will be different than February to some extent.

The full NOAA Seasonal Outlook extends through February/March/April of 2025. All of these maps are in the body of the article. Large maps are provided for February and the three-month period Feb/Mar/Apr.  Small maps are provided beyond that through April of 2025 with a link to get larger versions of these maps.

NOAA provides an excellent discussion to support the maps. It is included in the body of this article. In some cases, one will need to click on “read more” to read the full article.  For those on my email list where I have sent the url of the article, that will not be necessary.

Short Term and Intermediate-Term Weather Outlooks for the U.S. and a Six-Day Forecast for the World: posted January 19, 2024

This article focuses on what we are paying attention to in the next 48 to 72 hours. The article also includes weather maps for longer-term U.S. outlooks and a six-day World weather outlook which can be very useful for travelers.

First the highlights from the NWS.

Short Range Forecast Discussion
NWS Weather Prediction Center College Park MD
Fri Jan 19 2024
Valid 12Z Fri Jan 19 2024 – 12Z Sun Jan 21 2024

…Another arctic air intrusion spreading into much of the central to
eastern U.S….

…Heavy precipitation moving into much of California for the weekend with
heavy snow along the Sierra Nevada…

…Significant icing possible today and early Sunday through the Columbia
River Gorge in the Pacific Northwest…

…Accumulating snows spreading from the Midwest into the Mid-Atlantic…

…Lake-effect snows remain active into Saturday…
 

Please click on “Read More” below to access the full report issued today.

18 Jan 2023 Market Close & Major Financial Headlines: Markets Opened Mixed, Dow Trends Higher To Close Sharply Higher In The Green

Summary Of the Markets Today:

  • The Dow closed up 202 points or 0.54%,
  • Nasdaq closed up 1.35%,
  • S&P 500 closed up 0.88%,
  • Gold $2,024 up $17.90,
  • WTI crude oil settled at $74 up $1.51,
  • 10-year U.S. Treasury 4.142% up 0.038 points,
  • USD index $103.47 up $0.02,
  • Bitcoin $41,083 down $1,628 (3.81%),

*Stock data, cryptocurrency, and commodity prices at the market closing.


Click here to read our current Economic Forecast – January 2024 Economic Forecast: Our Index Turns Slightly Negative


Today’s Economic Releases Compiled by Steven Hansen, Publisher:

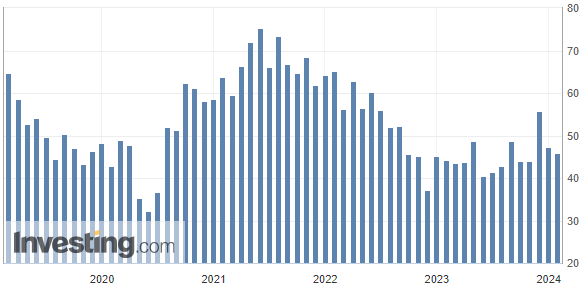
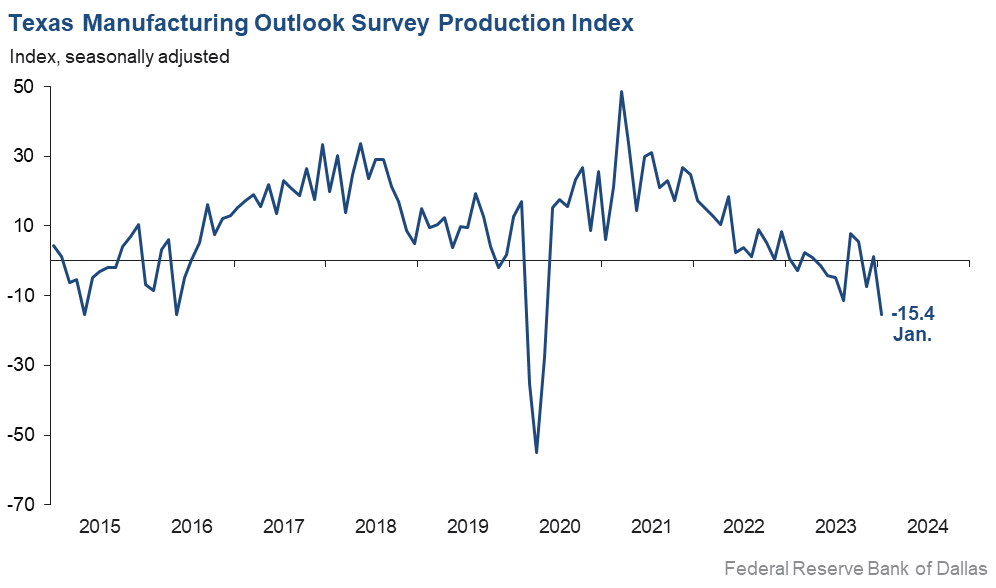
Philly Fed Manufacturing Business Outlook Survey in January 2024 continued to decline overall. The survey’s indicators for general activity, new orders, and shipments rose but remained negative. The survey’s broad indicators for future activity declined, suggesting less widespread expectations for overall growth over the next six months. The New York Feds manufacturing survey released earlier this week significantly declined.

The number of CEO changes in December 2023 at U.S. companies jumped 13% from 180 November CEO exits to 204 in December. This marks a 104% increase from the 100 CEOs who left their posts in the same month one year prior. Andrew Challenger, workplace expert and Senior Vice President of Challenger, Gray & Christmas, Inc stated:

Historically, we’ve seen large economic shifts preceded by a surge in CEO exits. Companies must consider the implications of younger C-level leaders to their future success. How do they get diverse talent – diverse in age, ethnicity, and ability – into their pipelines? How do they ensure those future leadership teams are successful? These is absolutely the questions companies are asking themselves in 2024,

Privately owned housing units authorized by building permits in December 2023 were 6.1% above December 2022. An estimated 1,469,800 housing units were authorized by building permits in 2023. This is 11.7 percent below the
2022 figure of 1,665,100. Privately‐owned housing starts were up 7.6% year-over-year. An estimated 1,413,100 housing units were started in 2023. This is 9.0 percent (±2.5 percent) below the 2022 figure of 1,552,600. Privately owned housing completions were up 8.4% year-over-year. An estimated 1,452,500 housing units were completed in 2023. This is 4.5 percent (±3.8 percent) above the 2022 figure of 1,390,500. Overall, 2023 was a good year for the construction of residential housing.

Accounting for 40% of containers entering and leaving the U.S., the container volumes in December 2023 through the Ports of Los Angeles and Long Beach were up 18% year-over-year for imports and up 6% for exports. The growing strength of imports suggests the U.S. economy is beginning to improve.

In the week ending January 13, the advance figure for seasonally adjusted initial unemployment claims 4-week moving average was 203,250, a decrease of 4,750 from the previous week’s revised average. The previous week’s average was revised up by 250 from 207,750 to 208,000.

Here is a summary of headlines we are reading today:

  • Protecting Coasts and Powering Homes: The Tidal Range Revolution
  • Climate Groups Defeat Norwegian Government In Court Battle
  • Red Sea Crisis Spurs Surge in Container Ship Rates
  • The World’s Coal-Fired Power Generation Hit a Record High in 2023
  • Tesla’s Aggressive Pricing Strategy Hits European Auto Stocks
  • Top Oil and Financial Firms Made $424 Billion in Windfall Profits in Two Years
  • Fed’s Raphael Bostic expects rate cuts to happen in the third quarter
  • Dow closes 200 points higher Thursday to shake off 3-day slump as Apple shares pop: Live updates
  • Red Sea attacks already bigger issue for supply chain than pandemic, maritime advisory warns
  • Weekly jobless claims post lowest reading since September 2022
  • Ballooning Credit & Rate Cuts: A Perfect Storm For Default
  • The Dow claws back earlier losses as tech rally resumes despite rate-cut uncertainty

Click on the “Read More” below to access these, other headlines, and the associated news summaries moving the markets today.

Short Term and Intermediate-Term Weather Outlooks for the U.S. and a Six-Day Forecast for the World: posted January 18, 2024

This article focuses on what we are paying attention to in the next 48 to 72 hours. The article also includes weather maps for longer-term U.S. outlooks and a six-day World weather outlook which can be very useful for travelers.

First the highlights from the NWS.

Short Range Forecast Discussion
NWS Weather Prediction Center College Park MD
Thu Jan 18 2024
Valid 12Z Thu Jan 18 2024 – 12Z Sat Jan 20 2024

…Heavy mountain snows for the Northwest/Rockies; additional ice over the
Columbia Basin…

…Bands of heavy lake-effect snow continue for the Great Lakes with
hazardous snow across the Midwest and Mid-Atlantic by Friday…

…Another Arctic blast expected late this week…
 

Please click on “Read More” below to access the full report issued today.

17 Jan 2023 Market Close & Major Financial Headlines: Another Down Day On Wall Street With Markets Opening Sharply Down, But recovering Enough To Close Moderately In The Red

Summary Of the Markets Today:

  • The Dow closed down 94 points or 0.25%,
  • Nasdaq closed down 0.59%,
  • S&P 500 closed down 0.56%,
  • Gold $2,009 down $21.20,
  • WTI crude oil settled at $73 up $0.30,
  • 10-year U.S. Treasury 4.100% up 0.034 points,
  • USD index $103.36 up $0.37,
  • Bitcoin $42,585 down $523 (1.271%),

*Stock data, cryptocurrency, and commodity prices at the market closing.


Click here to read our current Economic Forecast – January 2024 Economic Forecast: Our Index Turns Slightly Negative


Today’s Economic Releases Compiled by Steven Hansen, Publisher:

U.S. import prices declined 1.6% year-over-year in December 2023, after declining 1.5 percent in November. Prices for U.S. exports fell 3.2% year-over-year in December following a 5.2% decline the previous month. For all of 2023, it was cheaper to buy an imported product.

Advance estimates of U.S. retail and food services sales for December 2023 were up 5.6% above December 2022 – 2.2% inflation-adjusted. Retail sales have been gradually improving since May 2023.

Industrial production improved 1.0% year-over-year in December with components manufacturing up 1.2% year-over-year, mining up 4.3% year-over-year, and utilities down 4.9% year-over-year. This is the first month since February 2023 that manufacturing has grown year-over-year. Is the manufacturing recession over?

According to the Federal Reserve’s January 2024 Beige Book:

A majority of the twelve Federal Reserve Districts reported little or no change in economic activity since the prior Beige Book period. Of the four Districts that differed, three reported modest growth and one reported a moderate decline. Consumers delivered some seasonal relief over the holidays by meeting expectations in most Districts and by exceeding expectations in three Districts, including in New York, which noted strong holiday spending on apparel, toys, and sporting goods. In addition, seasonal demand lifted airfreight volume from ecommerce in Richmond and credit card lending in Philadelphia. Several Districts noted increased leisure travel, and a tourism contact described New York City as bustling. Contacts from nearly all Districts reported decreases in manufacturing activity. Districts continued to note that high interest rates were limiting auto sales and real estate deals; however, the prospect of falling interest rates was cited by numerous contacts in various sectors as a source of optimism. In contrast, concerns about the office market, weakening overall demand, and the 2024 political cycle were often cited as sources of economic uncertainty. Overall, most Districts indicated that expectations of their firms for future growth were positive, had improved, or both.

Here is a summary of headlines we are reading today:

  • China Hits 5.2% Growth Target Despite Population Challenges
  • U.S. Gasoline Prices End 2-Week Losing Streak
  • Europe’s Nuclear Power Renaissance
  • Tennessee Valley Authority Asks Customers To Conserve Power Amid Cold Spell
  • ran’s Strike in Pakistan Adds to Middle East Tensions
  • Jamie Dimon warns ‘all these very powerful forces’ will impact U.S. economy in 2024 and 2025
  • Dow closes lower Wednesday, notching third straight losing session as bond yields rise: Live updates
  • Samsung announces new Galaxy S24 lineup with AI-powered photo editing, search features
  • Trump says ‘I would love it’ when judge threatens to kick him out of E. Jean Carroll trial
  • Beige Book Finds “LIttle Or No Change” In Economic Activity But Optimism Rises On Hopes Of Lower Rates
  • 10-, 30-year Treasury yields hit five-week highs after December retail sales data
  • Tesla could be staring down a year of ‘growing pains,’ analyst cautions

Click on the “Read More” below to access these, other headlines, and the associated news summaries moving the markets today.

Our Report on the JAMSTEC Three-Season Forecast – Posted on January 17, 2024

The Japan Agency for Marine-Earth Science and Technology, or JAMSTEC, is a Japanese national research institute for marine-earth science and technology

From the JAMSTEC Discussion:

“The recent observation suggests that the El Niño reached its peak. The SINTEX-F ensemble mean predicts that the El Niño will decay and an El Niño Modoki will develop and persist at least until the next boreal spring. The model also predicts that a La Niña Modoki will occur in boreal autumn. However, there is a large uncertainty in the predicted amplitude.”

Although it is a World forecast, it includes a forecast for North America since North America is part of the World.

First, we take a look at the forecasted sea surface temperature anomalies (SSTA). JAMSTEC starts by forecasting the SSTA and Nino 3.4 Index on the first day of the month and from there it usually takes their models about two weeks to produce their seasonal forecast. I received it from JAMSTEC on January 10, 2024 which is a week before when NOAA will issue their Seasonal Update this month but I had so many articles to publish that I did not publish this JAMSTEC forecast immediately.  The JAMSTEC model runs are based on conditions as of January 1, 2024. The NOAA Seasonal Outlook will be based on conditions closer to the time when it is issued.

We have a full three-season forecast from JAMSTEC this month. We also have single-month forecasts for February, March and April 2024.

Let’s take a look.


This shows their forecast of sea surface temperature anomalies at three points in time. Red is warm and is associated with El Nino if it occurs in the Nino 3.4 measurement areas.  You can see the El Nino tongue of warm water extending from Peru to the west in the MAM image but look at that blob of warm water to the west i.e. by this point in time this has Modoki characteristics which impact the Walker circulation. JJA and SON show ENSO Neutral or La Nina.

JAMSTEC (and also NOAA) are showing very warm oceans in many parts of the world.  I have written about that before. It raises questions about the reliability of our current approach to thinking about the ENSO Cycle. This is covered in another article that can be accessed HERE. But JAMSTEC is showing a relatively normal ocean off the coast of much of the U.S. which probably explains their strange forecast.

JAMSTEC uses the same definition of Normal (climatology) as NOAA. JAMSTEC does a better job at characterizing La Ninas and El Ninos than NOAA. JAMSTEC provides me with a lot of other information that I do not include in my articles to keep them to a manageable size for readers.

JAMSTEC has been having some computational issues with its model. From the email I received from them: “Because of changes to the library in our computer, this time we could not complete all members”. Last month they were not able to publish at all. I do not know how to assess their message to me. In November they upgraded their model from 12 members to 36. Their goal is to go to 108. On the website, the images indicate that all members were included. It is not possible to accurately estimate the current conditions. So the technique in ensemble models is to perturb the assumptions slightly for multiple model runs (or use different physics models for some runs) and take the average (mean) of the solutions. Each solution is called a member of the group of solutions for which the mean was taken.  I am intrigued by the coincidence of this “change to the library in our computer” with their publication of this article. Based on the Japanese Culture they would not have released this forecast if they did not have confidence in it.

Some Readers will have to click on “Read More” to read the rest of the article which you need to read to see the forecasts. I can only include a certain amount of material in the lede.

Short Term and Intermediate-Term Weather Outlooks for the U.S. and a Six-Day Forecast for the World: posted January 17, 2024

This article focuses on what we are paying attention to in the next 48 to 72 hours. The article also includes weather maps for longer-term U.S. outlooks and a six-day World weather outlook which can be very useful for travelers.

First the highlights from the NWS.

Short Range Forecast Discussion
NWS Weather Prediction Center College Park MD
Wed Jan 17 2024
Valid 12Z Wed Jan 17 2024 – 12Z Fri Jan 19 2024

…Heavy mountain snows for the Northwest/Rockies; ice storm for portions
of the Pacific Northwest…

…Bands of heavy lake-effect snow continue for the Great Lakes…

…A return to more typical Winter temperatures for many Wednesday after
the brutal cold; another Arctic blast expected late this week…

Please click on “Read More” below to access the full report issued today.

America is a plutocracy!

America is a plutocracy!

America is deeply in trouble at home (Voters don’t want a Trump-Biden rematch in 2024. So how come they are still the frontrunners?) and abroad (US Foreign Policy Is a Scam Built on Corruption).

Why is that, profoundly?

America was founded by/of/for the rich, with money behind everything, from politics to justice, and remains so today. It is collapsing, finally!

In short, America is a plutocracy, finally collapsing!