Looking Back at July 2024 for the U.S.. and the World – Published August 17, 2024

Much of the information in this report comes from the monthly emails I receive from John Bateman. He does public outreach for NOAA and in particular NCEI. I could find the same information and more on the NCEI website but John Bateman produces a good summary so I use it or most of it. I also add additional information from NCEI or other NOAA websites. At the end of the article, I provide links that will get you to the full reports and much additional information.

I do not yet have John Bateman’s report for July so I extracted the information directly from the NOAA sources.

 My comments if any are in boxes like this one.

I start with the trends of July, 2024 Temperature looking at North America and then the World both land and water. There is a graphic for just CONUS but the format is different and it is not as easy to read.

This is the temperature trend for North America. It covers a larger geographical area than just CONUS but I find it easier to read. It almost looks like the temperature has plateaued.

The temperature for the world, land and ocean hit a new record.

The temperature for the world, (land only) hit a new record. Notice that land temperatures increase faster than land and ocean as water takes more energy.

To read the rest of this article some will have to click on “Read More”.

Today Through the Fourth Friday (22 to 28 days) Weather Outlook for the U.S. and a Six-Day Forecast for the World: posted August 17, 2024

This article focuses on what we are paying attention to in the next 48 to 72 hours. The article also includes weather maps for longer-term U.S. outlooks and a six-day World weather outlook which can be very useful for travelers.

First the NWS Short Range Forecast. The afternoon NWS text update can be found here after about 4 p.m. New York time but it is unlikely to have changed very much from the morning update. The images in this article automatically update.

Short Range Forecast Discussion
NWS Weather Prediction Center College Park MD
Sat Aug 17 2024
Valid 12Z Sat Aug 17 2024 – 12Z Mon Aug 19 2024

…There is a Slight Risk of excessive rainfall over parts of the
Mid-Atlantic on Saturday/Sunday and Southwest/Eastern Great Basin on
Saturday…

…There is a Slight Risk of severe thunderstorms over parts of the
Pacific Northwest, Great Basin, and Ohio Valley on Saturday and southern
Mid-Atlantic to Southeast/Lower Mississippi Valley on Sunday…

…There are Excessive Heat Warnings and Heat Advisories over parts of the
Southern Plains and Lower Mississippi Valley…

A front extending from the Great Lakes/Ohio Valley across the Middle
Mississippi Valley and then to the Central High Plains will move eastward
to the Mid-Atlantic/Southeast Coast and southward to the Southern Plains
by Monday. On Saturday, showers and thunderstorms will develop along and
ahead of the boundary from the Great Lakes/Ohio Valley to the
Tennessee/Lower Mississippi Valleys.

Additionally, upper-level energy will intersect a pool of tropical
moisture over the northern Mid-Atlantic, producing heavy rain. Therefore,
the WPC has issued a Slight Risk (level 2/4) of excessive rainfall over
parts of the northern Mid-Atlantic through Sunday morning. The associated
heavy rain will create mainly localized areas of flash flooding, with
urban areas, roads, small streams, and low-lying areas the most
vulnerable.

Furthermore, the boundary will trigger showers and severe thunderstorms
over parts of southwestern Ohio, eastern Kentucky, and extreme
north-central Tennessee. Therefore, the SPC has issued a Slight Risk
(level 2/5) of severe thunderstorms over parts of the Ohio/Tennessee
Valleys through Sunday morning. The hazards associated with these
thunderstorms are frequent lightning, severe thunderstorm wind gusts,
hail, and a few tornadoes.

Moreover, upper-level energy and a plume of monsoonal moisture will aid in
creating showers and thunderstorms with heavy rain over parts of southern
Utah and northwestern Arizona. Therefore, the WPC has issued a Slight Risk
(level 2/4) of excessive rainfall over parts of the Great Basin/Southwest
through Sunday morning. The associated heavy rain will create mainly
localized areas of flash flooding, with urban areas, roads, small streams,
and low-lying areas the most vulnerable.

In addition, the energy will produce showers and severe thunderstorms over
parts of the Great Basin. Therefore, the SPC has issued a Slight Risk
(level 2/5) of severe thunderstorms over parts of the Great Basin through
Sunday morning. The hazards associated with these thunderstorms are
frequent lightning, severe thunderstorm wind gusts, and a minimal threat
of hail and tornadoes.

Also, an upper-level low over the Pacific Northwest Coast and associated
energy will develop showers and severe thunderstorms over parts of Oregon
and Washington State on Saturday. Therefore, the SPC has issued a Slight
Risk (level 2/5) of severe thunderstorms over parts of the Pacific
Northwest through Sunday morning. The hazards associated with these
thunderstorms are frequent lightning, severe thunderstorm wind gusts,
hail, and a minimal threat of tornadoes.

On Sunday, as the front moves into the Mid-Atlantic, Southeast, and Lower
Mississippi Valley, showers and severe thunderstorms will develop along
and ahead of the boundary. Therefore, the SPC has issued a Slight Risk
(level 2/5) of severe thunderstorms over parts of the southern
Mid-Atlantic to Southeast/Lower Mississippi Valley from Sunday through
Monday morning. The hazards associated with these thunderstorms are
frequent lightning, severe thunderstorm wind gusts, hail, and a minimal
threat of tornadoes.

Further, a strong pool of moisture will be over the Mid-Atlantic on
Sunday, aiding in producing showers and thunderstorms with heavy rain over
parts of the northern Mid-Atlantic. Therefore, the WPC has issued a Slight
Risk (level 2/4) of excessive rainfall over parts of the northern
Mid-Atlantic from Sunday through Monday morning. The associated heavy
rain will create mainly localized areas of flash flooding, with urban
areas, roads, small streams, and low-lying areas the most vulnerable.

Moreover, monsoonal moisture and daytime heating will create showers and
thunderstorms over parts of the Southwest, Eastern Great Basin, and
Central Rockies from late afternoon into late evening on Sunday.
Additionally, the upper-level low over the Northwest will produce rain,
with maybe an embedded thunderstorm over the region on Sunday.

Meanwhile, upper-level ridging over parts of the Southern Plains and
Lower Mississippi Valley will produce high temperatures in the upper-90s
to low-100s with dew points in the low to mid-70s have prompted Excessive
Heat Warnings and Heat Advisories over parts of the Southern Plains and
Lower Mississippi Valley. The sweltering summer heat will continue over
the south. A prolonged stretch of high temperatures in the upper 90s and
triple digits will be focused over portions of the Southern Plains and
Gulf Coast through Monday. Low temperatures in the low-80s/upper-70s are
also forecast along the Gulf Coast, providing little relief from the heat
overnight. Moreover, the combination of summer heat and high humidity will
support daily maximum heat indices near 110F. People spending more time or
effort outdoors or in a building without cooling are at an increased risk
of heat-related illness.

To get your local forecast plus active alerts and warnings click HERE and enter your city, state or zip code.

Learn about wave patterns HERE.

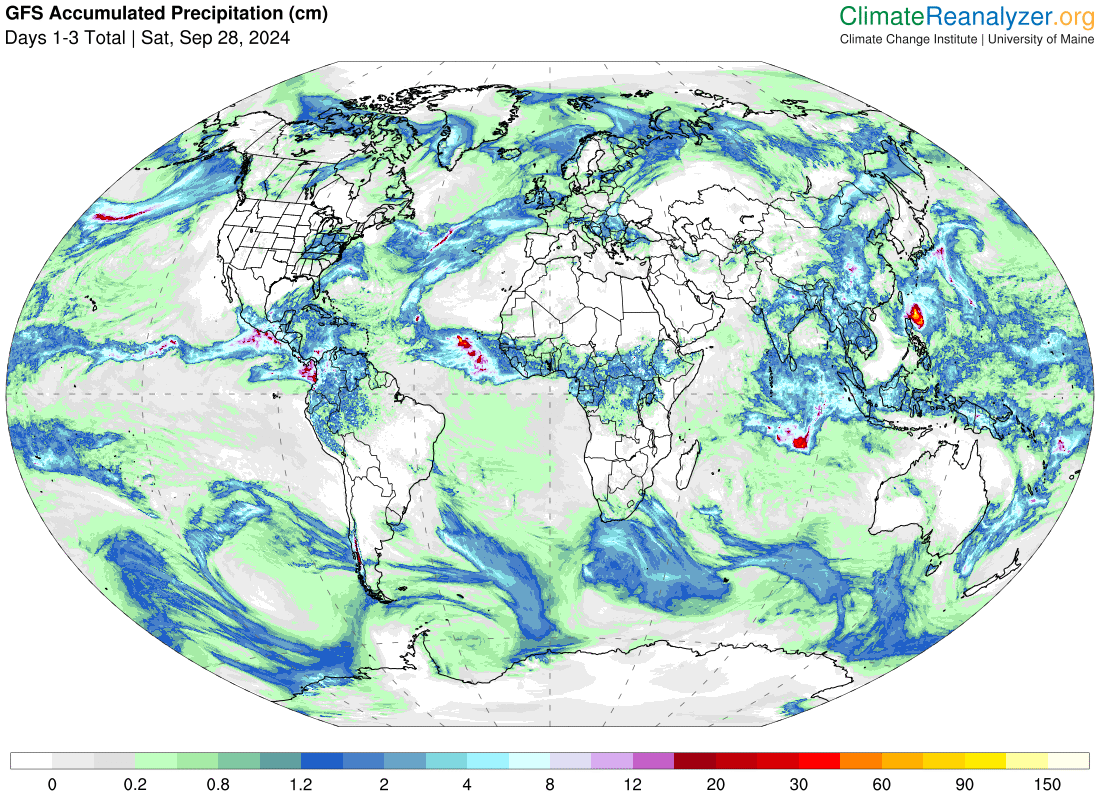
Then, looking at the world and of course, the U.S. shows here also. Today we are looking at precipitation.

Please click on “Read More” below to access the full Daily Report issued today.

16 AUG 2024 Market Close & Major Financial Headlines: Wall Street Opened Fractionally Higher, Continued To Trade Upward In A More Or Less Sideways Fashion Closing Fractionally Higher

Summary Of the Markets Today:

  • The Dow closed up 97 points or 0.24%,
  • Nasdaq closed up 0.21%,
  • S&P 500 closed up 0.20%,
  • Gold $2,546 up $53.00,
  • WTI crude oil settled at $77 down $1.44,
  • 10-year U.S. Treasury 3.883 down 0.043 points,
  • USD index $102.44 down $0.54,
  • Bitcoin $59,665 up $2,114 or 3.67%,
  • Baker Hughes Rig Count: U.S. -2 to 586 Canada unchanged at 217

*Stock data, cryptocurrency, and commodity prices at the market closing.

Today’s Highlights:

Stocks End in the Green: On Friday, the S&P 500 and Nasdaq Composite closed modestly higher, securing their best week of the year. Consumer Sentiment and Economic Data: The main economic data release on Friday showed an increase in consumer sentiment in August, marking the first rebound in five months. This positive sentiment, along with strong retail sales and Walmart’s earnings report, helped alleviate recession fears. Federal Reserve Rate Cut Expectations: Following the positive economic data, investors adjusted their expectations for Federal Reserve rate cuts. The odds of a 0.25% rate cut next month are now at 66%, while a 0.50% cut stands at 33%. This is a shift from the previous near-certainty of a 0.50% cut amid market turbulence. Upcoming Federal Reserve Update: Investors are looking ahead to next Friday when Fed Chair Jay Powell will speak at the annual Jackson Hole Symposium, which could provide further insights into the Fed’s monetary policy direction.


Click here to read our current Economic Forecast – August 2024 Economic Forecast: New Recession Flag


Today’s Economic Releases Compiled by Steven Hansen, Publisher:

Privately-owned housing units authorized by building permits in July 2024 was 7.0% below July 2023 rate. Privately-owned housing starts 16.0% below July 2023. Privately-owned housing completions was 13.8 % above July 2023 rate. Let’s put these numbers in perspective: permits, starts and completions are on the high side for the period since the 2007 Great Recession. So whilst the umbers are lower than the previous months – they are still economically positive.

Here is a summary of headlines we are reading today:

  • China’s Steel Industry Braces for Painful Consolidation
  • U.S. Oil and Gas Rig Count Falls for Second Week
  • China and Saudi Arabia Emerge as Largest Buyers of Russia’s Fuel Oil
  • Red Sea Ship Detours Boost Fuel Consumption by 500,000 Bpd
  • A Review of Geopolitical Risk in Russia and the Middle East
  • Stocks close higher Friday as market comeback lifts S&P 500 to best week of 2024: Live updates
  • The 60/40 portfolio excelled during the market storm — and Vanguard sees a strong decade ahead
  • Cadillac reveals new ‘Opulent Velocity’ performance EV concept
  • Ford upgrades Lincoln Navigator to include spa mode, 48-inch display for videos and gaming
  • Bayer shares soar 11% after key U.S. legal win against Roundup cancer claims
  • Gold Price Today: Yellow metal jumps by Rs 1,200/10 gram, silver dearer by Rs 2,500/kg. Here’s why
  • Treasury yields finish mostly lower following big spike on Thursday

Click on the “Read More” below to access these, other headlines, and the associated news summaries moving the markets today.

NOAA Updates its Seasonal Outlook on August 15, 2024 – Similar to the Outlook Issued last Month but Shifted Out a Month or Two – Posted on August 16, 2024

On the third Thursday of the month right on schedule NOAA issued their updated Seasonal Outlook which I describe as their Four-Season Outlook because it extends a bit more than one year into the future. The information released also included the Mid-Month Outlook for the following month plus the weather and drought outlook for the next three months.  I present the information issued by NOAA and try to add context to it. It is quite a challenge for NOAA to address the subsequent month, the subsequent three-month period as well as the twelve successive three-month periods for a year or a bit more.

With respect to the long-term part of the Outlook which I call the Four-Season Outlook, the timing of the transition from Neutral to LaNina is challenging to predict.  We are now in ENSO Neutral. La Nina is the likely scenario soon through winter and into Spring next year.

From the NOAA discussion:

“The major climate driver during the winter and early spring 2024-2025 is expected to be La Niña and the outlooks from DJF 2024-2025 through FMA 2025 reflect this with above-normal temperatures favored for the Southern Great Plains, Lower Mississippi Valley, and Southeast.”

“Later in the fall and into the 2024-2025 winter, the three-month precipitation outlooks are based largely on La Niña composites. The spatial coverage for below-normal precipitation probabilities exceeding 50 percent is largest during DJF and JFM across southeastern New Mexico, Texas, and parts of the Southeast where the dry signal is the strongest and occurs most frequently according to La Niña composites. Based on the same reasoning, above-normal precipitation probabilities are at their largest during DJF for the Pacific Northwest. Typically during La Niña, a tight gradient of dry to wet from the Gulf Coast to the Tennessee and Ohio Valleys becomes established during the winter and early spring.”

I personally would not have total confidence in this outlook given the uncertainty about there actually being a La Nina and its strength if it does happen.  I  do not have the JAMSTEC outlook yet but for sure they will lean towards a weak La Nina with Modoki characteristics. I do not have a lot of confidence that NOAA knows how to deal with a La Nina Modoki. But they may have it exactly correct.

Let’s Take a Look at the (mid-month) Outlook for September

It will be updated on the last day of August.

Then we look at a graphic that shows both the next month and the next three months.

The top row is what is now called the Mid-Month Outlook for next month which will be updated at the end of this month. There is a temperature map and a precipitation map. The second row is a three-month outlook that includes next month.  I think the outlook maps are self-explanatory. What is important to remember is that they show deviations from the current definition of normal which is the period 1991 through 2020.  So this is not a forecast of the absolute value of temperature or precipitation but the change from what is defined as normal or to use the technical term “climatology”.

Notice that the Outlook for next month and the three-month Outlook are fairly similar. This tells us that October and November will be fairly similar to September.

The full NOAA Seasonal Outlook extends through September/October/November of 2025 (yes that is more than a year out). All of these maps are in the body of the article. Large maps are provided for September and the three-month period September/October/November.  Small maps are provided beyond that through September/October/November of 2025 with a link to get larger versions of these maps.

NOAA provides a discussion to support the maps. It is included in the body of this article. In some cases, one will need to click on “read more” to read the full article. For those on my email list where I have sent the url of the article, that will not be necessary.

Today Through the Fourth Friday (22 to 28 days) Weather Outlook for the U.S. and a Six-Day Forecast for the World: posted August 16, 2024

This article focuses on what we are paying attention to in the next 48 to 72 hours. The article also includes weather maps for longer-term U.S. outlooks and a six-day World weather outlook which can be very useful for travelers.

First the NWS Short Range Forecast. The afternoon NWS text update can be found here after about 4 p.m. New York time but it is unlikely to have changed very much from the morning update. The images in this article automatically update.

Short Range Forecast Discussion
NWS Weather Prediction Center College Park MD
Fri Aug 16 2024
Valid 12Z Fri Aug 16 2024 – 12Z Sun Aug 18 2024

…There is a Slight Risk of excessive rainfall over parts of the
Tennessee Valley and Southern Appalachians on Friday…

…There is a Slight Risk of severe thunderstorms over parts of the
Central/Southern Plains on Friday…

…There are Excessive Heat Warnings and Heat Advisories over parts of the
Central/Southern Plains and Lower Mississippi/Tennessee Valleys…

A front extending from the Upper Great Lakes/Upper Mississippi Valley
across the Middle Mississippi Valley and then to the Central High Plains
will move eastward to the Lower Great Lakes/Mid-Atlantic, then westward to
the Southern Plains by Sunday. Showers and thunderstorms will develop
along and ahead of the boundary from the Great Lakes/Ohio Valley to the
Tennessee/Lower Mississippi Valleys into the Central/Southern Plains.

Additionally, the front will intersect a pool of tropical moisture over
the Tennessee Valley, producing heavy rain. Therefore, the WPC has issued
a Slight Risk (level 2/4) of excessive rainfall over parts of the
Tennessee Valley/Southern Appalachians through Saturday morning. The
associated heavy rain will create mainly localized areas of flash
flooding, with urban areas, roads, small streams, and low-lying areas the
most vulnerable.

Furthermore, upper-level energy moving over the Central Plains will
trigger showers and severe thunderstorms. Therefore, the SPC has issued a
Slight Risk (level 2/5) of severe thunderstorms over parts of the
Central/Southern Plains and adjacent areas through Saturday morning. The
hazards associated with these thunderstorms are frequent lightning, severe
thunderstorm wind gusts, hail, and a minimal threat of tornadoes.

On Saturday, as the front moves eastward, showers and thunderstorms will
develop over parts of the Lower Great Lakes/Eastern Ohio Valley, Central
Appalachians, Tennessee Valley, and Middle/Lower Mississippi Valley.

Elsewhere, monsoonal moisture and diurnal heating will produce showers and
thunderstorms over parts of the Southwest, Eastern Great Basin, and
Southern Rockies from late afternoon into late evening on Friday and
Saturday.

Moreover, upper-level energy and moisture moving over parts of the Pacific
Northwest will create rain with embedded thunderstorms over parts of the
Northwest on Saturday.

Meanwhile, upper-level ridging over parts of the Southern Plains and Lower
Mississippi Valley with high temperatures in the upper-90s to low-100s
with dew points in the low to mid-70s have prompted Excessive Heat
Warnings and Heat Advisories over parts of the Central/Southern Plains and
Lower Mississippi/Tennessee Valleys. The sweltering summer heat will
continue over the south. A prolonged stretch of high temperatures in the
upper 90s and triple digits will be focused over portions of the Southern
Plains and Gulf Coast through Sunday. Low temperatures around 80 degrees
are also forecast along the Gulf Coast. Moreover, the combination of
summer heat and high humidity will support daily maximum heat indices near
110F. People spending greater time or effort outdoors or in a building
without cooling is at an increased risk of heat-related illness.

To get your local forecast plus active alerts and warnings click HERE and enter your city, state or zip code.

Learn about wave patterns HERE.

Then, looking at the world and of course, the U.S. shows here also. Today we are looking at precipitation.

Please click on “Read More” below to access the full Daily Report issued today.

15 AUG 2024 Market Close & Major Financial Headlines: Wall Street Markets Gap Up At The Opening Bell, Continue To Trend Upward Pushing The Dow Over 550 Points, Indexes Closing Sharply Higher

Summary Of the Markets Today:

  • The Dow closed up 555 points or 1.39%,
  • Nasdaq closed up 2.34%,
  • S&P 500 closed up 1.61%,
  • Gold $2,493 up $13.30,
  • WTI crude oil settled at $78 up $1.00,
  • 10-year U.S. Treasury 3.919 up 0.097 points,
  • USD index $103.03 up $0.46,
  • Bitcoin $57,053 down $1,637 or 2.79%,

*Stock data, cryptocurrency, and commodity prices at the market closing.

Today’s Highlights:

Stocks surged on Thursday as Wall Street reacted to positive signals regarding the U.S. consumer and labor market. Key factors influencing the market included Walmart’s earnings report, government retail sales data, and jobless claims updates. Walmart’s Performance: Walmart’s stock jumped over 6% following a strong earnings report that exceeded expectations for both earnings and revenue. The company also raised its full-year outlook, projecting sales growth between 3.75% and 4.75% and adjusted earnings per share between $2.35 and $2.43. Retail Sales and Jobless Claims: Retail sales for July rose by 1%, significantly surpassing Wall Street’s 0.4% estimate, indicating a resilient U.S. consumer base. Additionally, weekly jobless claims fell to 227,000, defying expectations of an increase and contributing to the positive market sentiment. Market Recovery: After a challenging start to August, stocks have rebounded, driven by cooling recession fears. The S&P 500 and Nasdaq have recovered from earlier losses, with the S&P 500 up nearly 7% and the Nasdaq more than 8% since the sell-off on August 5. The Information Technology sector, led by companies like Nvidia, has been a significant driver of this recovery.


Click here to read our current Economic Forecast – August 2024 Economic Forecast: New Recession Flag


Today’s Economic Releases Compiled by Steven Hansen, Publisher:

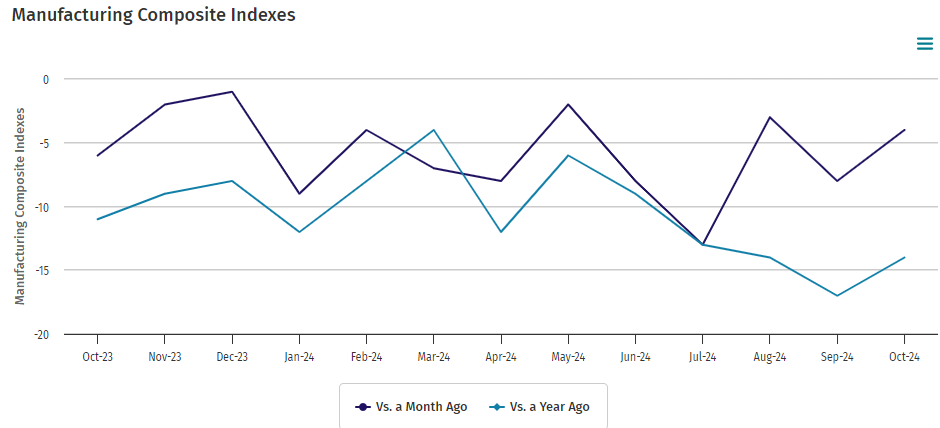
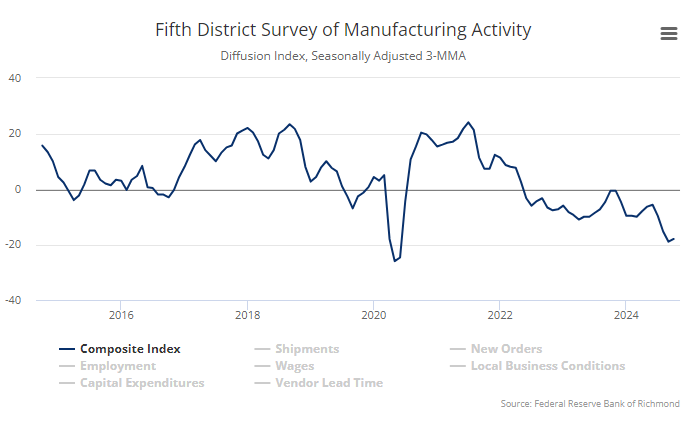
Industrial production fell to -0.2% year-over-year in July 2024 – down from 1.1% gain year-over-year in June. Components manufacturing was up 0.1% year-over-year (down from 0.6%), utilities declined 0.1% year-over-year (down from 7.9%), and mining declined 1.5% year-over-year (from -1.2% in June).  Capacity utilization moved down to 77.8 percent in July, a rate that is 1.9 percentage points below its long-run (1972–2023) average. The authors claim that Hurricane Beryl impacted industrial production by 0.3% which seems to ring true. However, these are not numbers that I would be bragging about as they indicate a very weak industrial sector. Note that the problem is not only in the U.S. as China’s factory output slowed for a third straight month in July.

The August 2024 Philly Fed Manufacturing Business Outlook Survey shows that manufacturing activity in the region softened overallThe survey’s indicators for current general activity, new orders, and shipments all declined, with the former turning negative. The employment index suggests declines in employment overall. The diffusion index for current general activity fell from 13.9 to -7.0, its first negative reading since January. The indexes for new orders and shipments also declined but remained positive for the second consecutive month: The new orders index decreased 6 points to 14.6, and the shipments index fell 19 points to 8.5. Poor growth data in the manufacturing sector continues. 

Business activity edged slightly lower according to the August 2024 New York Fed Empire State Manufacturing Survey. The headline general business conditions index was little changed at -4.7. New orders declined modestly, while shipments held steady. There is little good news in the manufacturing sector.

Job seekers’ relocating for new jobs rose to 2.7% in the second quarter, up from 2.1% in the first quarter* and 2.4% in the same quarter last year. While the rate is rising after falling to historic lows in 2023, it is still not at levels seen pre-pandemic. Andrew Challenger, Senior Vice President and economic expert for Challenger, Gray & Christmas added:

The rise in the relocation rate suggests finding jobs close to home is becoming a bit more difficult. With more companies mandating time in the office, job seekers are beginning to recognize the need to move to where the jobs are.

Prices for U.S. imports ticked up to 1.6% year-over-year in July 2024 from 1.5% the previous month. Export prices likewise rose from 1.0% year-over-year in June to 1.4% in July. Import price increases affect retail prices.

Retail trade sales were up 2.6% year-over-year in July 2024 – and increase from June’s flat sales. Nonstore retailers were up 6.7 percent (±1.4 percent) from last year, while food services and drinking places were up 3.4 percent (±2.1 percent) from July 2023. The data in many sectors was weak but the non-store retailers (say Amazon) were the bright spot of this report. However, I was personally surprised by the strength of this data – and this should work against those who believe the economy is weakening and therefore the Fed should cut the federal funds rate.

In the week ending August 10, the advance figure for seasonally adjusted initial unemployment claims 4-week moving average was 236,500, a decrease of 4,500 from the previous week’s revised average. The previous week’s average was revised up by 250 from 240,750 to 241,000. There is little indication in unemployment claims that the economy is weakening.

Here is a summary of headlines we are reading today:

  • Russia Expands ‘Dark Fleet’ to Evade LNG Sanctions
  • The Real Reason Iran Hasn’t Retaliated Against Israel
  • Supply Chain Woes Worsen After Chinese Port Closure
  • Oil Prices Climb 2% as Gaza Ceasefire Talks Begin
  • U.S. Set to Slowly Refill SPR as Crude Buys Extend Into 2025
  • Stocks close higher, S&P 500, Nasdaq notch six-day winning streak as comeback rally gains steam: Live updates
  • Ex-Google CEO Eric Schmidt sees Nvidia as big AI winner: ‘You know what to do in the stock market’
  • Here’s the deflation breakdown for July 2024 — in one chart
  • Meta CEO Mark Zuckerberg receives letter from lawmakers concerned about illicit drug ads on Facebook and Instagram
  • Walmart says prices are coming down — except in one key area
  • US Inflation falls to 3-year low, clearing the way for Fed to begin cutting rates
  • 2-year Treasury yield jumps by most in 4 months on positive retail-sales data

Click on the “Read More” below to access these, other headlines, and the associated news summaries moving the markets today.
Today Through the Fourth Friday (22 to 28 days) Weather Outlook for the U.S. and a Six-Day Forecast for the World: posted August 15, 2024

This article focuses on what we are paying attention to in the next 48 to 72 hours. The article also includes weather maps for longer-term U.S. outlooks and a six-day World weather outlook which can be very useful for travelers.

First the NWS Short Range Forecast. The afternoon NWS text update can be found here after about 4 p.m. New York time but it is unlikely to have changed very much from the morning update. The images in this article automatically update.

Short Range Forecast Discussion
NWS Weather Prediction Center College Park MD
Thu Aug 15 2024
Valid 12Z Thu Aug 15 2024 – 12Z Sat Aug 17 2024

…Flash flooding and severe weather threat continues over the Midwest the
next couple of days…

…Potentially dangerous heat anticipated across the southern Plains,
lower Mississippi Valley, and Gulf Coast…

A low pressure/frontal system traversing the center of the country
continues to help trigger rounds of showers and thunderstorms leading to
the threat of some flash flooding and severe weather. The low pressure
center is forecast to gradually push eastward through the Upper Midwest
today and reach the Great Lakes by the end of the week. A broad warm
sector supported by plentiful moisture, instability, and deep-layer shear
will allow for storms to potentially turn severe and contain heavy
rainfall throughout Missouri, Illinois, and into the lower Ohio Valley.
Storms should redevelop during the afternoon, increasing in coverage into
the evening, with a Slight Risk (level 2/4) of Excessive Rainfall in
effect given the threat for some intense downpours and potential training
convection leading to instances of flash flooding. A Slight Risk (level
2/5) of severe weather similarly covers the chance for some instances of
large hail and damaging winds. The system will push into the Lower Great
Lakes and Ohio/Tennessee Valleys by Friday and Saturday, with storms
likely to spread as far east as the Appalachians and Mid-Atlantic. Some
chances of isolated flash flooding and severe weather are forecast.

Heat will remain the major weather story throughout much of the
south-central U.S. into the beginning of this weekend and likely beyond.
Widespread highs into the upper 90s and triple digits are forecast to span
from the Southwest to the central Gulf Coast. Elevated humidity levels
will soar heat indices up to around 110 degrees for areas outside of the
Southwest and southern High Plains. However, actual high temperatures in
these more arid regions will be higher and well into the triple digits for
some locations. Low temperatures are anticipated to only drop into the
upper 70s and 80s for many locations, which could break several daily
records. This level of heat can affect anyone without effective cooling
and/or adequate hydration. Therefore, it is imperative to follow proper
heat safety and check on vulnerable individuals.

Elsewhere, some showers and storms will continue over New England as an
upper-level low churns over Nova Scotia. To the south, portions of
central/south Florida will also see scattered storm chances the next
couple of days as a cold front slowly pushes through. Some thunderstorms
will also be possible with a shortwave passing over portions of the
northern Great Basin today and into the northern Rockies by tonight.
Monsoonal moisture and storm chances are set to return to the Southwest
and central Great Basin by Saturday, where isolated flash flooding is the
greatest concern. Forecast high temperatures are expected to generally be
around average along the East Coast with mid- to upper 80s expected. Areas
of the Great Lakes/Upper Midwest behind the passing storm system will be
cooler with highs in the 70s. More temperatures near or above average are
expected over the northern/central Plains with highs in the 80s and 90s.
Highs across the northern tier of the West will remain below average, with
70s for the Pacific Northwest and low 80s into the northern Great Basin,
warming closer to average into the central Great Basin with mid-80s to low
90s.

To get your local forecast plus active alerts and warnings click HERE and enter your city, state or zip code.

Learn about wave patterns HERE.

Then, looking at the world and of course, the U.S. shows here also. Today we are looking at precipitation.

Please click on “Read More” below to access the full Daily Report issued today.

14 AUG 2024 Market Close & Major Financial Headlines: The Dow Has Made Back To Back Gains As CPI Inflation rises 2.9% in July, less than expected

Summary Of the Markets Today:

  • The Dow closed up 243 points or 0.61%,
  • Nasdaq closed up 0.03%,
  • S&P 500 closed up 0.38%,
  • Gold $2,484 down $23.30,
  • WTI crude oil settled at $77 down $1.20,
  • 10-year U.S. Treasury 3.837 down 0.017 points,
  • USD index $102.61 up $0.05,
  • Bitcoin $58,981 down $1,622 or 2.68%,

*Stock data, cryptocurrency, and commodity prices at the market closing.

Today’s Highlights:

US Stocks Edge Higher: On Wednesday, US stocks mostly rose as Wall Street reacted positively to new consumer price data. Inflation Data: The Consumer Price Index (CPI) indicated that price increases remained steady in July, with consumer prices rising 2.9% year-over-year, marking the first time headline inflation has dipped below 3% since 2021. Core inflation, excluding food and energy, rose 3.2% year-over-year, aligning with Wall Street forecasts. Impact on Federal Reserve Policy: The inflation data strengthens the case for a possible interest rate cut by the Federal Reserve. The Producer Price Index, which measures wholesale inflation, rose 2.2% year-over-year, close to the Fed’s 2% target. These signals suggest the Fed might be closer to a rate cut, with traders speculating on whether the cut will be 25 or 50 basis points.


Click here to read our current Economic Forecast – August 2024 Economic Forecast: New Recession Flag


Today’s Economic Releases Compiled by Steven Hansen, Publisher:

The Consumer Price Index (CPI) declined modestly from 3.0% year-over-year in June to 2.9% in July 2024. The index for all items less food and energy also modestly declined from 3.3% year-over-year in June to 3.2% in July 2024. Looking at the individual components, they were mixed and the bottom line is that together they added up to little change in the CPI. You need to step back to understand that in June 2023, the CPI stood at 3.1% and 13 months later the CPI stands at 2.9%. IMO, nothing short of a recession will force a drastic change in inflation. For the time being, it is endemic in the economy. 

The National Federation of Independent Business (NFIB) has released the 11th edition of its quadrennial report, “Small Business Problems and Priorities,” based on a nationwide survey of small business owners. This 2024 report highlights the challenges faced by small businesses, focusing on 75 critical issues impacting Main Street. Key findings from the report include:

  • Cost Pressures: The “Cost of Health Insurance” continues to be the top issue for small business owners since 1986. The “Cost of Supplies/Inventories” has risen significantly in importance due to historic inflation, moving from 12th place in 2020 to 2nd in 2024. Additionally, the costs of fuels and electricity are significant concerns, with “Interest Rates” also rising dramatically in importance from 56th to 13th place since 2020.
  • Tax-Related Issues: “Federal Taxes on Business Income” is the most severe tax-related problem, ranked 4th, with concerns about the potential expiration of the Small Business Deduction in 2025. “State Taxes on Business Income” is also a critical issue for many business owners.
  • Uncertainty: Economic and governmental uncertainties have increased in importance. “Uncertainty over Economic Conditions” is now the 3rd most severe problem, while “Uncertainty over Government Actions” ranks 8th. Additionally, finding qualified employees remains a critical issue, ranking 5th.

The report underscores the need for policymakers to address these challenges to support small businesses, which employ nearly half of the private sector workforce.

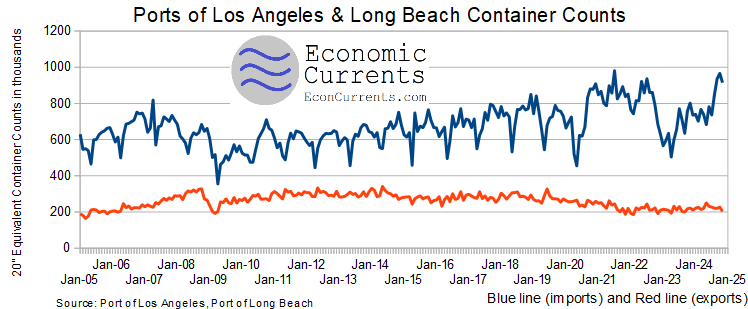
The Ports of Los Angeles and Long Beach which account for 40% of the high value container shipments in and out of the U.S. had a significant increase in July 2024. Imports are up 47% year-over-year whilst exports are up 10% year-over-year. This suggests the U.S. economy is strengthening and/or manufacturing is declining and being replaced by imports.


Here is a summary of headlines we are reading today:

  • Brent Crude Falls Below $80
  • Iron Ore Prices Plunge Below $100
  • Jet Fuel Demand Recovery Grinds to a Halt
  • Oil Prices Fall After the EIA Reports an Inventory Build
  • U.S. Inflation Drops Below 3%, Boosting Hopes of an Interest Rate Cut
  • Here’s the inflation breakdown for July 2024 — in one chart
  • Mortgage refinancing surges 35% in one week, as interest rates hit lowest level in over a year
  • S&P 500 closes higher for fifth straight day as easing inflation bolsters rate cut hopes: Live updates
  • DraftKings reverses plans for a tax on customers as FanDuel parent Flutter wows Wall Street
  • Crypto investors weigh new inflation data that clears way for potential rate cuts: CNBC Crypto World
  • Mortgage Refi Activity Jump Most Since 2020 As Lenders See Gloom Ending
  • Crypto Tumbles As ‘Harris/Biden’ Admin Moves Another 10,000 ‘Silk Road’ Bitcoin To Coinbase

Click on the “Read More” below to access these, other headlines, and the associated news summaries moving the markets today.

Today Through the Fourth Friday (22 to 28 days) Weather Outlook for the U.S. and a Six-Day Forecast for the World: posted August 14, 2024

This article focuses on what we are paying attention to in the next 48 to 72 hours. The article also includes weather maps for longer-term U.S. outlooks and a six-day World weather outlook which can be very useful for travelers.

First the NWS Short Range Forecast. The afternoon NWS text update can be found here after about 4 p.m. New York time but it is unlikely to have changed very much from the morning update. The images in this article automatically update.

Short Range Forecast Discussion
NWS Weather Prediction Center College Park MD
Wed Aug 14 2024
Valid 12Z Wed Aug 14 2024 – 12Z Fri Aug 16 2024

…Flash flooding and severe weather threat forecast to stretch from the
central/northern Plains to the Midwest over the next few days…

…Potentially dangerous heat anticipated across the southern Plains,
lower Mississippi Valley, and Gulf Coast…

A developing storm system progressing from the central U.S. to the Great
Lakes by the end of the week is expected to spark numerous showers and
thunderstorms that could produce areas of hazardous weather conditions. As
the area of low pressure begins to organize and consolidate over the
northern Plains today, slow-moving thunderstorms may form across parts of
central North Dakota while also containing intense rainfall rates.
Additionally, a gradually lifting warm front extending from the central
Plains to the Ozarks may produce another focus for heavy rainfall through
tonight before the flash flooding threat centers over the mid-Mississippi
and lower Ohio valleys on Thursday. Scattered flash flooding will be
possible where the heaviest rainfall occurs, with urban areas and poor
drainage locations most at risk. Severe weather will also remain possible
today and extend into Thursday as developing thunderstorms grow upscale
and potentially contain damaging wind gusts and large hail. The most
likely regions at risk for severe weather include the mid-Missouri Valley
region today and much of Missouri and Illinois on Thursday. A couple of
tornadoes can’t be ruled out as well.

Elsewhere, an upper-level low displaced to the east of New England will
aid in scattered thunderstorm activity throughout the region over the next
couple of days. Further south, a cold front progressing over the Florida
Peninsula and lingering near the central Gulf Coast will also produce
areas of scattered summer convection. Be sure to remain weather aware if
spending time outdoors and seek shelter should storms begin to produce
lightning.

Heat will remain and major weather story throughout much of the
south-central U.S. through the end of this week and likely beyond.
Widespread highs into the upper 90s and triple digits are forecast to span
from the Southwest to the central Gulf Coast. Elevated humidity levels
will soar heat indices up to around 110 degrees in the southern Plains,
lower Mississippi Valley, and central Gulf Coast. Low temperatures are
anticipated to only drop into the upper 70s and 80s for many locations,
which could break several daily records. This level of heat can affect
anyone without effective cooling and/or adequate hydration. Therefore, it
is imperative to follow proper heat safety and check on vulnerable
individuals.

To get your local forecast plus active alerts and warnings click HERE and enter your city, state or zip code.

Learn about wave patterns HERE.

Then, looking at the world and of course, the U.S. shows here also. Today we are looking at precipitation.

Please click on “Read More” below to access the full Daily Report issued today.