Short Term and Intermediate-Term Weather Outlooks for the U.S. and a Six-Day Forecast for the World: posted October 23, 2023

Here is what we are paying attention to in the next 48 to 72 hours. The article also includes weather maps for longer-term outlooks and a six-day World weather outlook.

We start with the U.S. Information. You can update this section here but these are 48 to 72-hour forecasts so if I have not been able to update this area twice daily, what is shown is still valid and the images in the body of the article update automatically but sometimes they are a bit slow to update.

Short Range Forecast Discussion
NWS Weather Prediction Center College Park MD
Mon Oct 23 2023
Valid 12Z Mon Oct 23 2023 – 12Z Wed Oct 25 2023

…Heavy rain chances and flash flood potential increases across the
Southern Plains early this week…

…Some locally heavy rainfall possible for the Upper Great Lakes
Tuesday…

…Impactful snow to enter parts of the Northwest, Northern Rockies, and
northern High Plains on Tuesday…

cone graphic

cone graphic

Mortgage Debt and Inflation: Part 4

Note:  A major addition was added to the conclusion at 1:43 a.m. EDT on October 23, 2023.

This article concludes the analysis of the correlation patterns between Mortgage Debt and Consumer Inflation (CPI).  The last of the three types of inflation patterns (time periods with no significant inflation trends) is the subject of analysis here.  The other two types of patterns (inflation surges1 and disinflation/deflation surges2) were analyzed previously.  The conclusion discusses the correlation patterns for all time periods, looks for any common threads, and identifies important differences across time periods and types of correlation patterns.


From a photo by The Agent on Unsplash.

Short Term and Intermediate-Term Weather Outlooks for the U.S. and a Six-Day Forecast for the World: posted October 22, 2023

Here is what we are paying attention to in the next 48 to 72 hours. The article also includes weather maps for longer-term outlooks and a six-day World weather outlook.

We start with the U.S. Information. You can update this section here but these are 48 to 72-hour forecasts so if I have not been able to update this area twice daily, what is shown is still valid and the images in the body of the article update automatically but sometimes they are a bit slow to update.

Short Range Forecast Discussion
NWS Weather Prediction Center College Park MD
Sun Oct 22 2023
Valid 12Z Sun Oct 22 2023 – 12Z Tue Oct 24 2023

…Cool Sunday for the Northeast with a freeze possible in the Upper Ohio
Valley Monday morning…

…Much above average high temperatures continue for much of the central
and western U.S…

…Frontal system brings precipitation chances inland from the West Coast
to the Northern Rockies/Plains…

cone graphic

cone graphic

Our Report on the JAMSTEC Three-Season Weather Forecast – October 21, 2023

The Japan Agency for Marine-Earth Science and Technology, or JAMSTEC, is a Japanese national research institute for marine-earth science and technology

From the JAMSTEC Discussion:

As predicted, the recent observation confirms further development of the El Niño. The SINTEX-F ensemble mean predicts that the El Niño will reach its peak in the boreal winter and persist at least until the next boreal spring. However, there is a large uncertainty in the predicted amplitude.

Although it is a World forecast, it includes a forecast for North America since North America is part of the World. The JAMSTEC discussion does not address it but the maps show the U.S. being an area that has a lot of area that is not warmer than Climatology which I interpret as a fairly cold winter but surprisingly dry in the Southwest.

First, we take a look at the forecasted sea surface temperature anomalies (SSTA). JAMSTEC starts by forecasting the SSTA and Nino 3.4 Index on the first day of the month and from there it usually takes their models about two weeks to produce their seasonal forecast. I received it from JAMSTEC on October 20, 2023 which is when NOAA issued their Seasonal Update.  The JAMSTEC model runs are based on conditions as of October 1, 2023. The NOAA Seasonal Outlook was based on conditions closer to the time when it is issued.

We do not have a three-season forecast from JAMSTEC this month. We have three forecasts but the first covers NDJ and the second covers DJF so they are just a month apart. This is because JAMSTEC prefers to work with the Meteorological Seasons so we have Winter and Spring and the first map which is one month of Autumn with two months of winter so they are very similar.

One might question their winter forecast for the Southwest but it is somewhat consistent with the below.

This shows their forecast of sea surface temperature anomalies at three points in time. Red is warm and is associated with El Nino.  You can see the El Nino tongue of warm water extending from Peru to the west in all three time periods. It seems to be stronger in the 1st and 2nd time periods which overlap a lot. The warmest water shifts was bit west in the third period exhibiting some Modoki characteristics.

JAMSTEC (and also NOAA) are showing very warm oceans. I have written about that before. It raises questions about the reliability of our current approach to thinking about the ENSO Cycle. This is covered in another article that can be accessed HERE. But JAMSTEC is showing a relatively normal ocean off the coast of much of the U.S. which probably explains their strange forecast.

JAMSTEC uses the same definition of Normal (climatology as NOAA). They do a better job at characterizing La Ninas and El Ninos than NOAA. JAMSTEC provides me with a lot of other information that I do not include in my articles to keep them to a manageable size for readers.

Short Term and Intermediate-Term Weather Outlooks for the U.S. and a Six-Day Forecast for the World: posted October 21, 2023

Here is what we are paying attention to in the next 48 to 72 hours. The article also includes weather maps for longer-term outlooks and a six-day World weather outlook.

We start with the U.S. Information. You can update this section here but these are 48 to 72-hour forecasts so if I have not been able to update this area twice daily, what is shown is still valid and the images in the body of the article update automatically but sometimes they are a bit slow to update.

Short Range Forecast Discussion
WS Weather Prediction Center College Park MD
Sat Oct 21 2023
Valid 12Z Sat Oct 21 2023 – 12Z Mon Oct 23 2023

…Showers and storms expected from the Great Lakes into the Northeast
Saturday, with some locally heavy rainfall possible in New England…

…Much above average temperatures continue this weekend for portions of
the central and western U.S…

…Increasing precipitation chances from the Pacific Northwest to the
Northern Rockies Sunday…

cone graphic

cone graphic

20 Oct 2023 Market Close & Major Financial Headlines: Wall Street’s Three Main Indexes Slump After 10-Year Treasury Yield Crosses 5%, S&P 500 Records Fifth Straight Day Of Losses

Summary Of the Markets Today:

  • The Dow closed down 287 points or 0.86%,
  • Nasdaq closed down 1.53%,
  • S&P 500 closed down 1.26%,  (Low 4224)
  • Gold $1,994 up $13.10,
  • WTI crude oil settled at $89 down $0.35,
  • 10-year U.S. Treasury 4.918% down 0.007 points,
  • USD Index $106.18 down $0.080,
  • Bitcoin $29,548 up $776,
  • Baker Hughes Rig Count: U.S. +2 to 624 Canada +5 to 198

*Stock data, cryptocurrency, and commodity prices at the market closing.


Click here to read our Economic Forecast for October 2023


Today’s Economic Releases Compiled by Steven Hansen, Publisher:

No releases today

Here is a summary of headlines we are reading today:

  • Aluminum Prices Swing Amid U.S.-EU Tariff Talks
  • Aluminium Demand Gets Boost From Backlog In Aircraft Production
  • Top U.S. Oil ETF Gets Largest Inflows Since 2020 As Oil Prices Surge
  • The U.S. Is Running Out Of Ways To Influence Oil Prices
  • Dow closes nearly 300 points lower after 10-year Treasury yield tops 5% for the first time since 2007: Live updates
  • Nike is among the most overbought stocks in the S&P 500. Here are the others
  • Stocks making the biggest moves midday: SolarEdge, Regions Financial, Merck and more
  • As mortgage rates hit 8%, home ‘affordability is incredibly difficult,’ economist says
  • “Al Capone Style”: Musk Reveals “We Unloaded Entire Drum of Tommy Gun” Into Cybertuck
  • Market Snapshot: U.S. stocks drop, putting S&P 500 on track for worst week in a month after rise in Treasury yields, oil prices

Click on the “Read More” below to access these, other headlines, and the associated news summaries moving the markets today.

NOAA Updates its Seasonal Outlook October 19, 2023 – Reduction in Drought

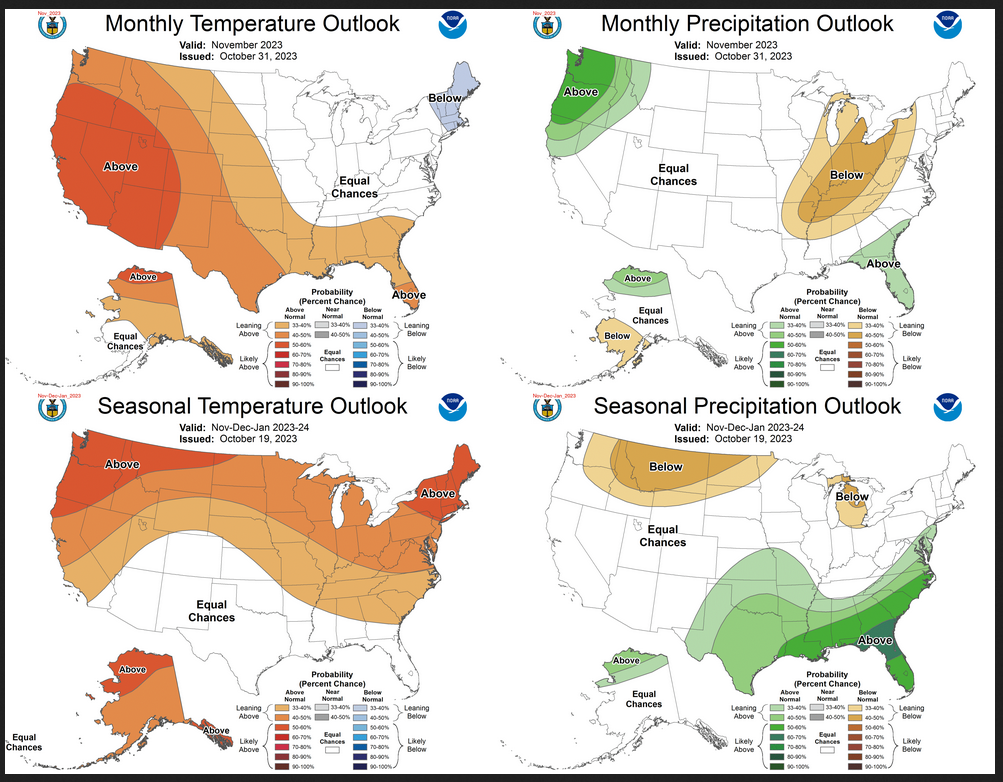
On the third Thursday of the month right on schedule NOAA issued their updated Seasonal Outlook which I describe as their Four-Season Outlook because it extends a bit more than one year into the future. The information released also included the Mid-Month Outlook for the following month plus the weather and drought outlook for the next three months.  I present the information issued by NOAA and try to add context to it. It is quite a challenge for NOAA to address the subsequent month, the subsequent three-month period as well as the twelve successive three-month periods for a year or a bit more.

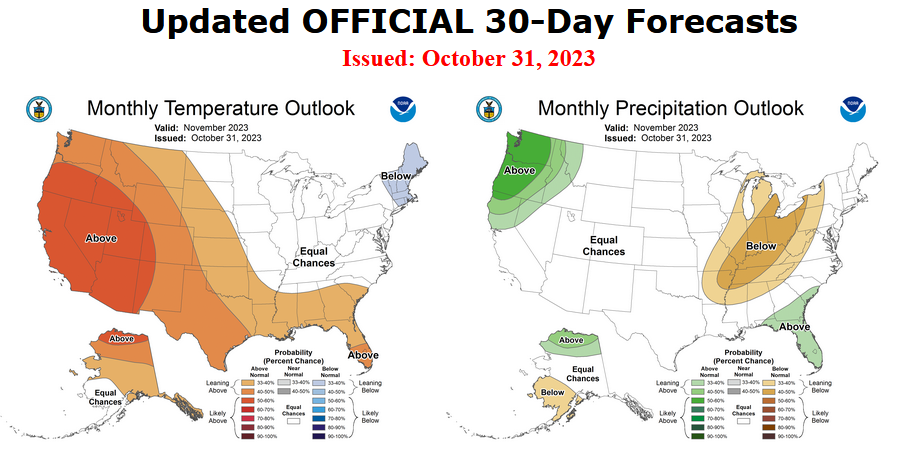
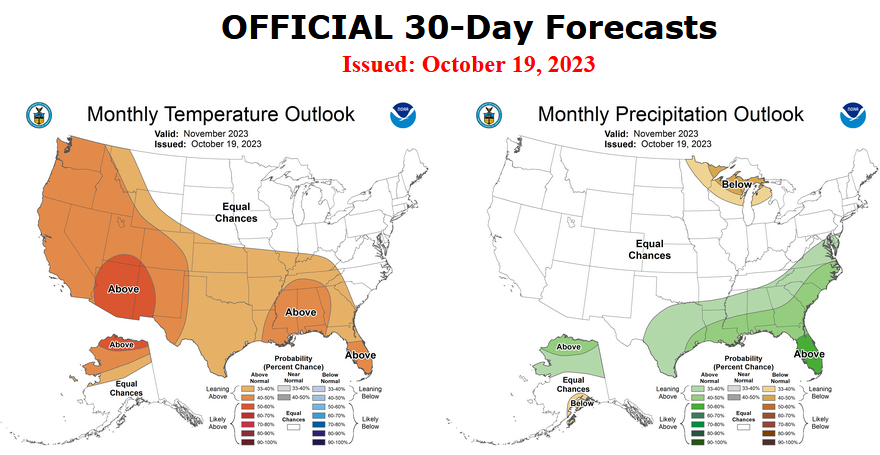
First, Let’s Take a Look at the (mid-month) Outlook for November. It will be updated on the last day of October.


Then I present a graphic that shows both the preliminary Outlook for November and the three-month outlook for NDJ 2023-2024. So you get the full picture in one graphic. For some, that may be all they are interested in. Others will be interested in the longer-term predictions and also the rationale supporting the predictions which is mostly provided by the NOAA discussion.

The top row is what is now called the Mid-Month Outlook for next month which will be updated at the end of this month. There is a temperature map and a precipitation map. The second row is a three-month outlook that includes next month.  I think the outlook maps are self-explanatory. What is important to remember is that they show deviations from the current definition of normal which is the period 1991 through 2020.  So this is not a forecast of the absolute value of temperature or precipitation but the change from what is defined as normal or to use the technical term “climatology”.

Notice that the outlook for next month and the three-month outlooks are somewhat different with respect to temperature and also to some extent precipitation.  This tells us that December and January will be different than November to some extent.

The full NOAA Seasonal Outlook extends through November/December/January of 2025. All of these maps are in the body of the article. Large maps are there for November and the three-month period Nov/Dec/Jan.  Small maps are provided beyond that through January of 2025 with a link to get larger versions of these maps.

NOAA provides an excellent discussion to support the maps.[Author’s Note: many other meteorological agencies see this El Nino being stronger than NOAA does so there is more than usual uncertainty relating to the more distant months.]

Short Term and Intermediate-Term Weather Outlooks for the U.S. and a Six-Day Forecast for the World: posted October 20, 2023

Here is what we are paying attention to in the next 48 to 72 hours. The article also includes weather maps for longer-term outlooks and a six-day World weather outlook.

We start with the U.S. Information. You can update this section here but these are 48 to 72-hour forecasts so if I have not been able to update this area twice daily, what is shown is still valid and the images in the body of the article update automatically but sometimes they are a bit slow to update.

Short Range Forecast Discussion
NWS Weather Prediction Center College Park MD
Fri Oct 20 2023
Valid 12Z Fri Oct 20 2023 – 12Z Sun Oct 22 2023

…Storm system to bring showers and thunderstorms to the East into the
weekend…

…Much above average, record-tying/breaking warmth for much of the
central-western U.S…

cone graphic

cone graphic

19 Oct 2023 Market Close & Major Financial Headlines: Wall Street Witnesses Wild Trading Swings As Powell Says Inflation Is Too High And 10-Year Yield Approaches 5%

Summary Of the Markets Today:

  • The Dow closed down 251 points or 0.75%,
  • Nasdaq closed down 0.96%,
  • S&P 500 closed down 0.85%,
  • Gold $1,988 up $20.10,
  • WTI crude oil settled at $90 up $2.16,
  • 10-year U.S. Treasury 4.977% up 0.005 points,
  • USD Index $106.21 down $0.350,
  • Bitcoin $28,768 up $502,

*Stock data, cryptocurrency, and commodity prices at the market closing.


Click here to read our Economic Forecast for October 2023


Today’s Economic Releases Compiled by Steven Hansen, Publisher:

The October 2023 Philadelphia Fed’s Manufacturing Business Outlook Survey shows general activity remained negative, while new orders and shipments were positive but low. The employment index turned positive, and both price indexes indicate overall increases in prices. Manufacturing remains in a recession in the USA.

In the week ending October 14, the advance figure for seasonally adjusted initial unemployment claims 4-week moving average was 205,750, a decrease of 1,000 from the previous week’s revised average. The previous week’s average was revised up by 500 from 206,250 to 206,750.

Existing home sales in September 2023 declined 15.4% from one year ago (blue line on the graph below). The median existing-home sales price grew 2.8% from one year ago to $394,300 but has been declining for the last three months (red line on the graph below). The inventory of unsold existing homes is equivalent to 3.4 months’ supply at the current monthly sales pace.

The Conference Board Leading Economic Index (LEI) for the U.S. declined by 0.7 percent in September 2023 to 104.6 (2016=100), following a decline of 0.5 percent in August. The LEI is down 3.4 percent over the six-month period between March and September 2023, an improvement from its 4.6 percent contraction over the previous six months (September 2022 to March 2023). Note that the Conference Board is still forecasting a recession. Justyna Zabinska-La Monica, Senior Manager, Business Cycle Indicators, at The Conference Board stated:

The LEI for the US fell again in September, marking a year and a half of consecutive monthly declines since April 2022. In September, negative or flat contributions from nine of the index’s ten components more than offset fewer initial claims for unemployment insurance. Although the six-month growth rate in the LEI is somewhat less negative, and the recession signal did not sound, it still signals risk of economic weakness ahead. So far, the US economy has shown considerable resilience despite pressures from rising interest rates and high inflation. Nonetheless, The Conference Board forecasts that this trend will not be sustained for much longer, and a shallow recession is likely in the first half of 2024.


Here is a summary of headlines we are reading today:

  • Groundbreaking Dual-Purpose Batteries Store Energy And Capture CO2
  • Drone Attacks Syrian Gas Field as Israel Conflict Escalates
  • Most Americans Wouldn’t Buy An Electric Vehicle
  • Musk Expresses Uncertainty About Cybertruck’s Production And Profitability
  • Venezuela Could Boost Oil Production By 25% After U.S. Eases Sanctions
  • Powell says inflation is still too high and lower economic growth is likely needed to bring it down
  • U.S. State Department issues ‘worldwide caution’ alert as tensions in the Middle East soar
  • Dow closes more than 200 points lower as 10-year Treasury yield nears 5%: Live updates
  • 10-year Treasury yield hovers near 16-year high as Powell talks inflation, economy
  • Oil Surges After Report US Destroyer Shoots Down Multiple Houthi Missiles
  • Economic Report: Defense spending boosts economy as U.S. mulls more aid for Ukraine and Israel

Click on the “Read More” below to access these, other headlines, and the associated news summaries moving the markets today.

Crop Report October 19, 2023 – More Corn was Planted and More Corn was Harvested.

This article is based primarily on the October 17, 2023, USDA Crop Bulletin which covers the week ending October 15, 2023.  The full USDA Crop Bulletin can be accessed HERE

It is back to looking like an average crop or perhaps even a bit less than average. But there is lots of corn which is usually more profitable than soybeans.

This article includes a short international review of agricultural conditions which are generally favorable. I also included U.S. crop-related weather forecasts. And there is a report on production forecasts. It is a long report and we show the Table of Contents, a summary of key points, and the link to the full report.

We first take a look at the frost/Freeze and other warnings.

Now on to the National Agriculture Summary.  The Tables below the summary have additional data. The boxes with my comments may be incomplete so for crops of interest check the data out yourself to be sure.