Preparing to Say Goodbye to La Nina Early in 2023
Today is the third Thursday of the month so right on schedule NOAA has issued what I describe as their Four-Season Outlook. The information released also includes the Early Outlook for the single month of September plus the weather and drought outlook for the next three months. I present the information issued and try to add context to it. It is quite a challenge for NOAA to address the subsequent month, the subsequent three-month period as well as successive three-month periods for a year or a bit more.
“The La Niña signature is likely to fade during FMA and MAM 2023, given that La Niña and ENSO-neutral are about even odds”
You can take La Nina out of the forecast, but the warming trend continues. But the Outlook is for a wetter CONUS starting in AMJ 2023. For many parts of CONUS, 2023 will be wetter than 2022. At least that is what NOAA is predicting right now.

| Announcement: We now publish a Daily weather report that includes a 48-hour forecast and links to weather outlook maps for an intermediate period of time. We also have a map of weather hazards for Week 1 and Week 2 which we update weekly and you can click on a link to get the latest version. On Fridays, we show the maps so that you do not have to click on links. Our intermediate-term outlook on Friday extends for 28 days. We also provide links to tropical conditions for the Western Atlantic, Gulf of Mexico, Eastern, Central and Western Pacific. There is a two-week forecast map for tropical activity worldwide. You can always find this report at Econcurents.com and over time there will be more and more interesting articles at that website. It makes it possible to access a lot of useful information without having to visit a number of different websites. |
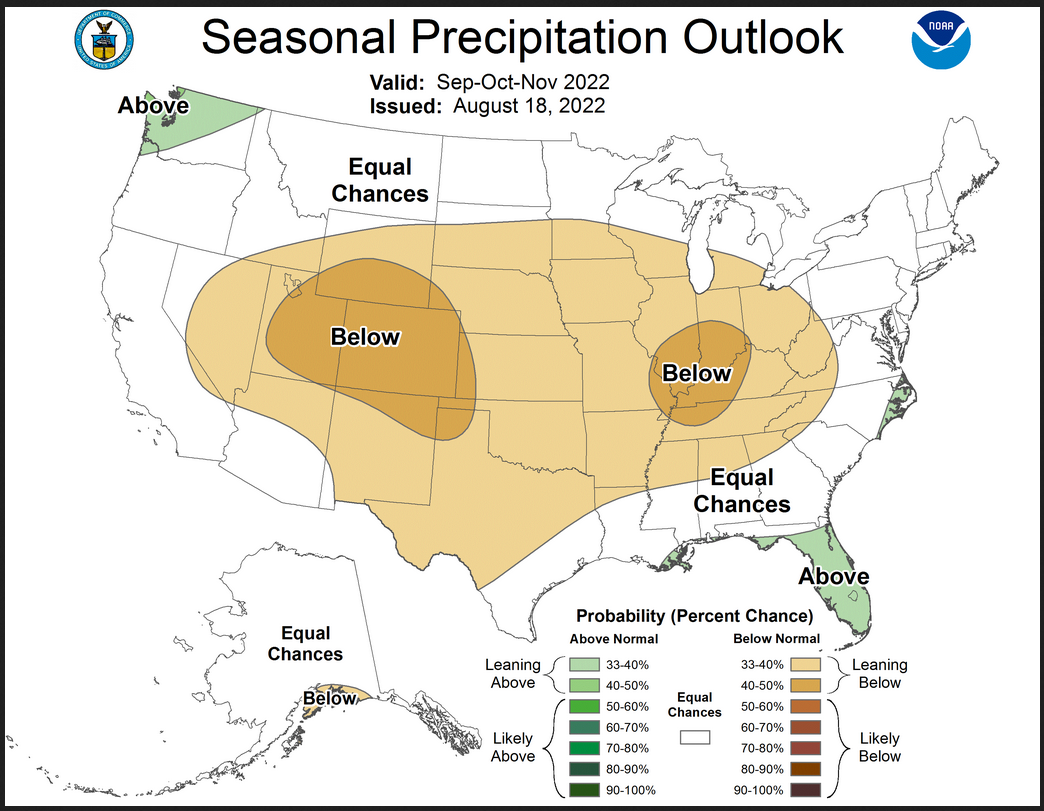
Combination Early Outlook for September and the Three-Month Outlook
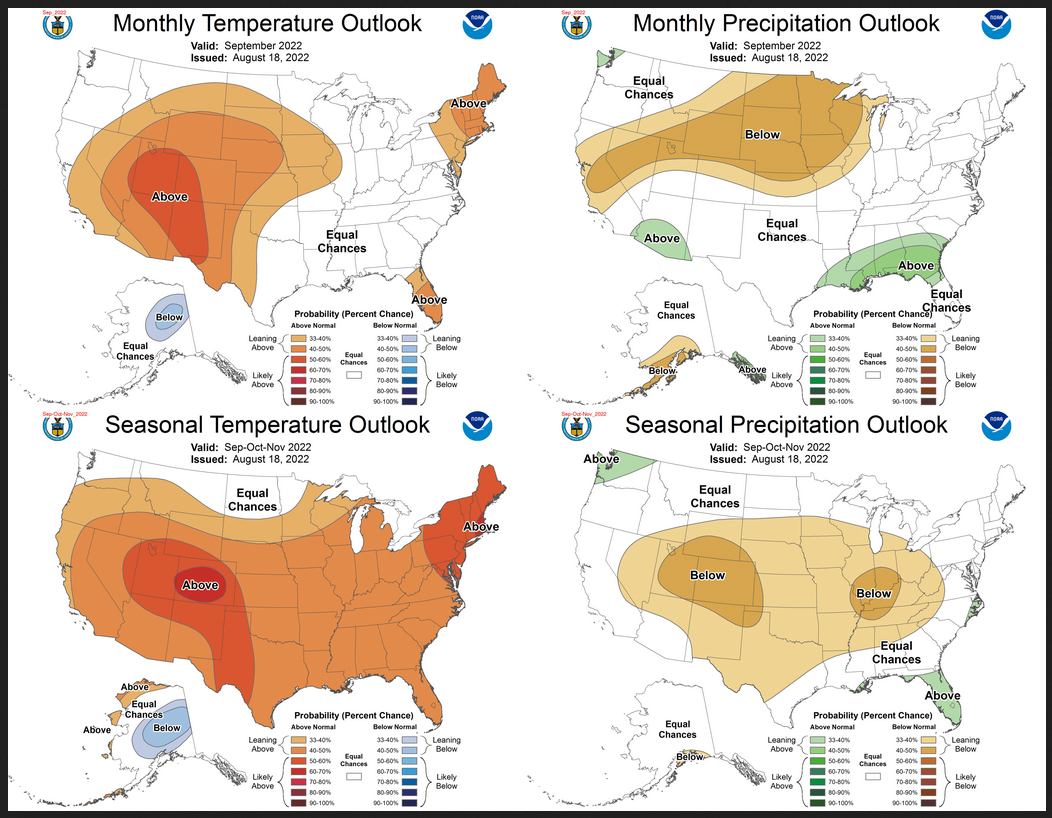
The top row is the so-called Early Outlook for September which will be updated at the end of August. There is a temperature map and a precipitation map. The second row is a three-month outlook that includes September. I think the outlook maps are self-explanatory. What is important to remember is that they show deviations from the current definition of normal which is the period 1991 through 2020. So this is not a forecast of the absolute value of temperature or precipitation but the change from what is defined as normal or to use the technical term climatology.
| Notice that for temperature, the September and three-month outlooks are very similar. This suggests that the October/November outlook is also similar to both the September and the three-month outlook. It is almost the same situation for precipitation. But the Monsoon is stronger than normal in September but not for the three-month period. |
| For both temperature and precipitation, if you assume the colors in the maps are assigned correctly, it is a simple algebra equation to solve the month two/three anomaly probability for a given location = (3XThree-Month Probability – Month One Probability)/2*. So you can derive the month two/three outlook this way. You can do that calculation easily for where you live or for the entire map. |
Here are larger versions of the Temperature and Precipitation outlook maps for the single month of September
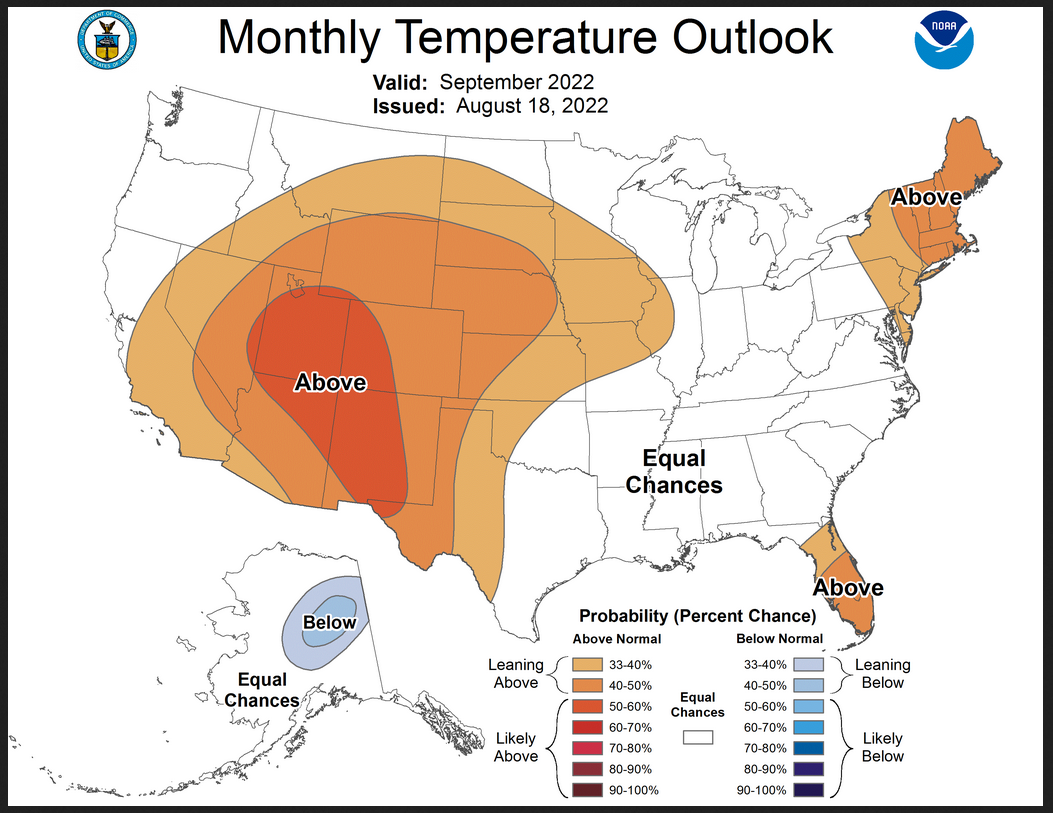
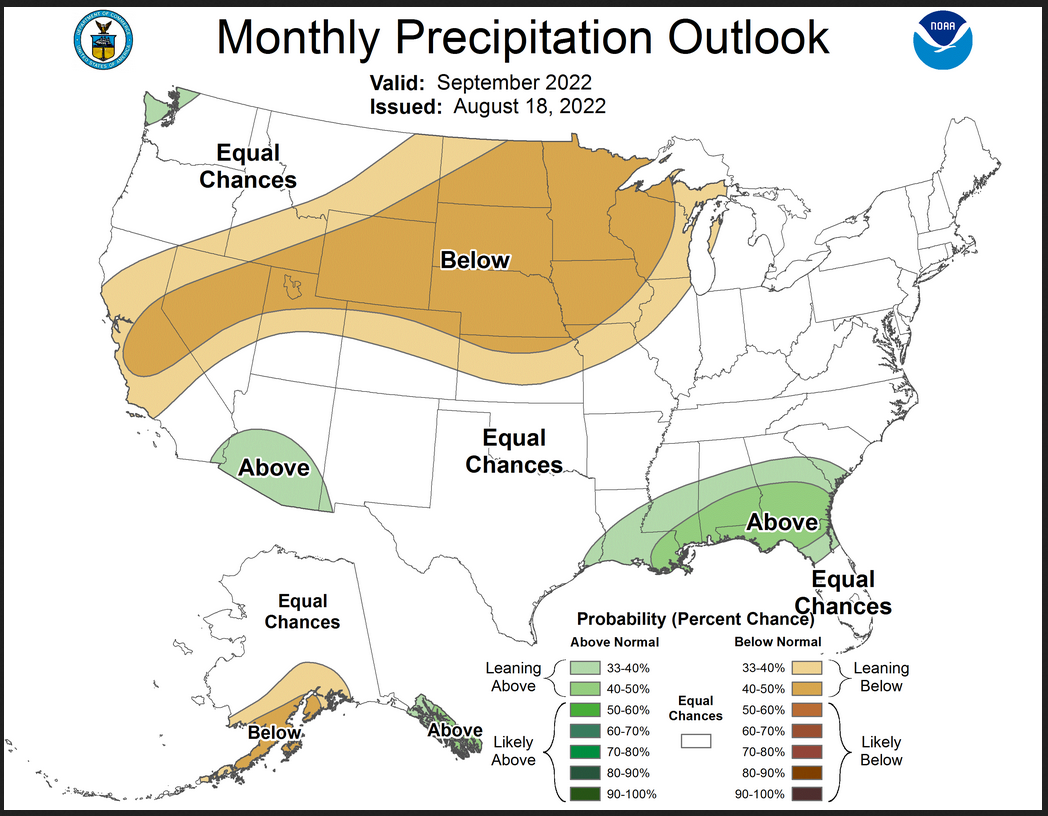
The maps are pretty clear in terms of the outlook.
And here are large versions of the three-month ASO Outlook maps starting with temperature followed by precipitation.
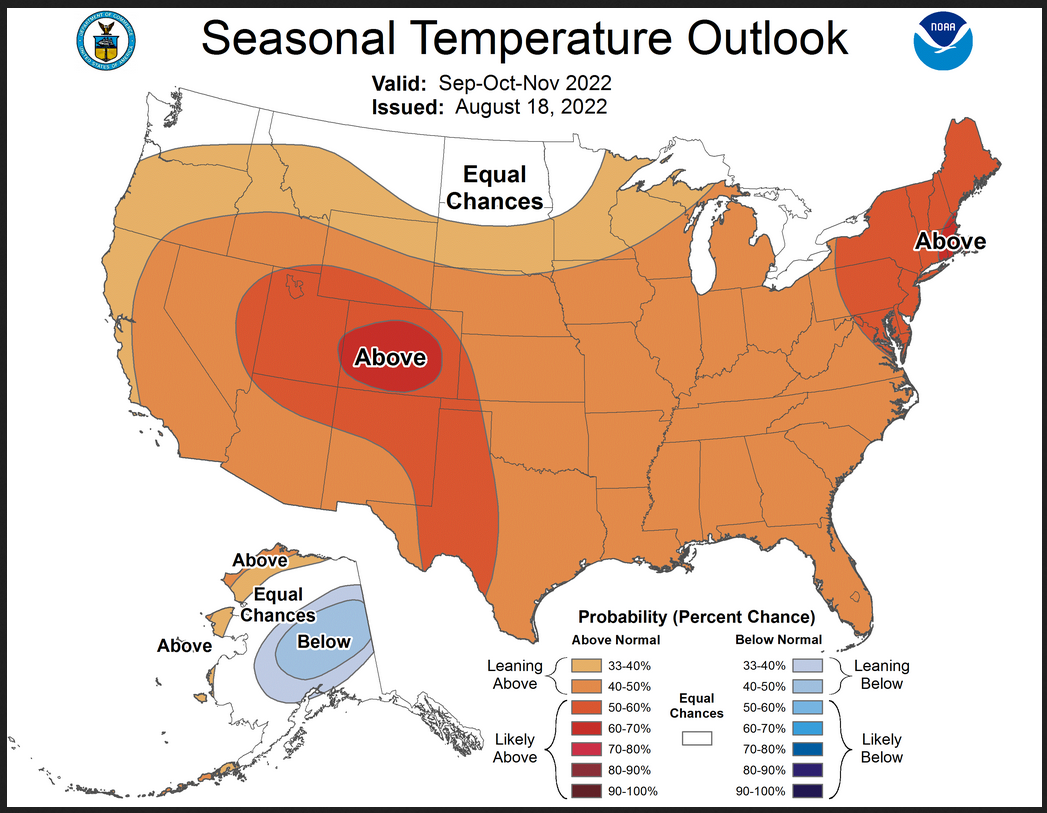
The maps are larger versions of what was shown in the first graphic that had smaller versions of all four of these maps.
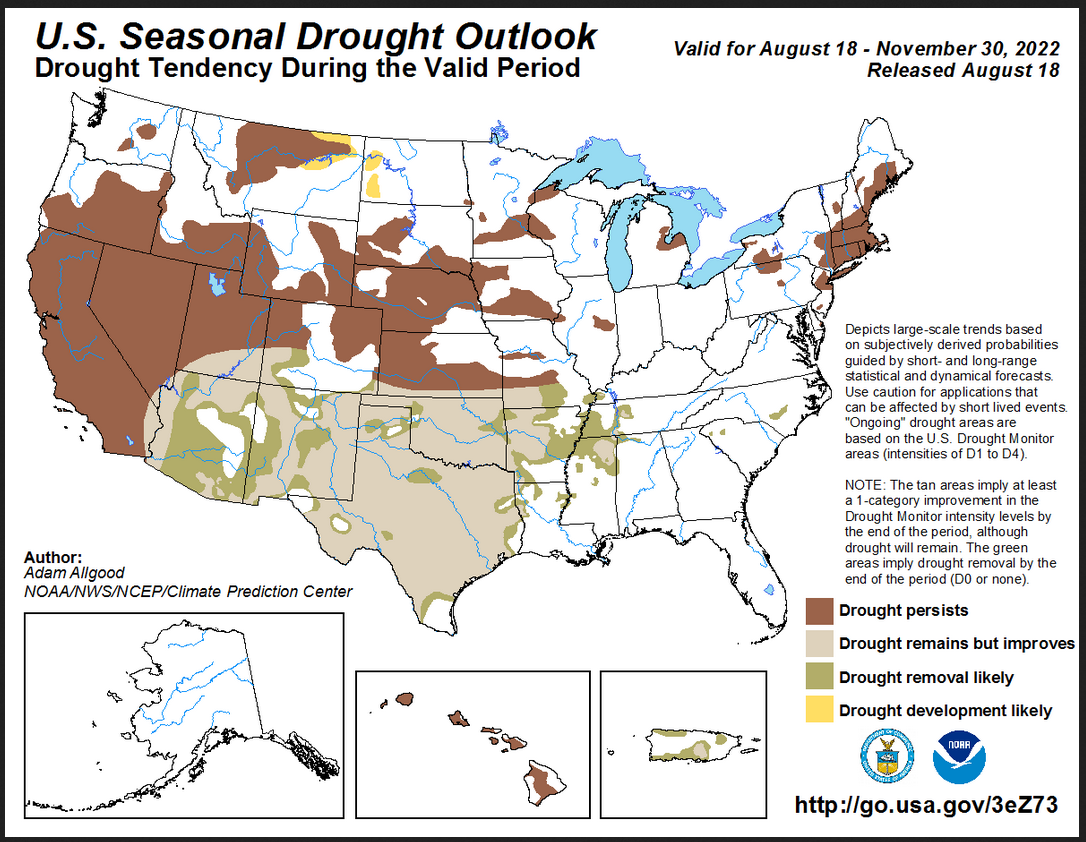
Drought Outlook
–
|
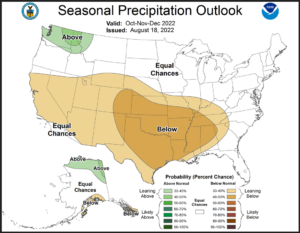
The yellow is the bad news. And this is a three-month outlook plus the remainder of August. There is considerable temporary partial relief. Updates are available each month here https://www.cpc.ncep.noaa.gov/products/expert_assessment/sdo_summary.php.
|
Short CPC Drought Discussion
Latest Seasonal Assessment – During the past month, persistently enhanced monsoonal convection brought widespread drought relief to the Four Corners region and the Great Basin, with frequent localized flash flooding events observed in many areas. Periods of heavy rainfall also reversed the trend of rapid drought onset across the central Corn Belt and Ohio River Valley, but also generated historical flooding across mountainous portions of eastern Kentucky. In contrast, episodes of extreme heat and dryness between these two wetter regions caused significant drought expansion across the Plains and western Corn Belt. Generous rainfall eased drought conditions across the Southeast, while more lackluster precipitation and several heatwaves resulted in continued degradations across portions of New Jersey, southeastern New York, and southern New England.
The autumn months are a highly transitional time of year, as Gulf moisture retreats southward and climatological precipitation decreases across the Plains, and the wet season begins to ramp up across the Northwest. Decreasing sunlight and falling temperatures reduces evapotranspiration rates, while ripening crops reduces the impacts of short term drought conditions. Through the end of August, dynamical models strongly favor a continuation of enhanced rainfall across the monsoon regions of the Southwest, with heavy rainfall extending eastward across the Southern Plains and lower Mississippi Valley. Some model solutions depict copious rainfall overspreading portions of Texas. This short and medium range rainfall would result in widespread drought amelioration extending from the Four Corners through Texas and Oklahoma and the lower Mississippi River Valley. Drought conditions are also favored to continue improving across the Southeast. In contrast, in the absence of a clear wet signal through the next several months, drought conditions are unlikely to substantially improve across the Northeast, where streamflows remain extremely low and drought conditions have persisted for an unusually long period of time. While early season storm systems will likely bring some soil moisture recharge to the Northeast, drought conditions may continue to degrade in the short term given forecasts for above-normal temperatures. Drought persistence is favored for the West ahead of the core wet season, and a fairly dry September and SON outlook favors drought persistence for the north-central CONUS and the Great Lakes region, with drought development possible across portions of northeastern Montana and western North Dakota.
Looking out Four Seasons.
Twelve Temperature Maps
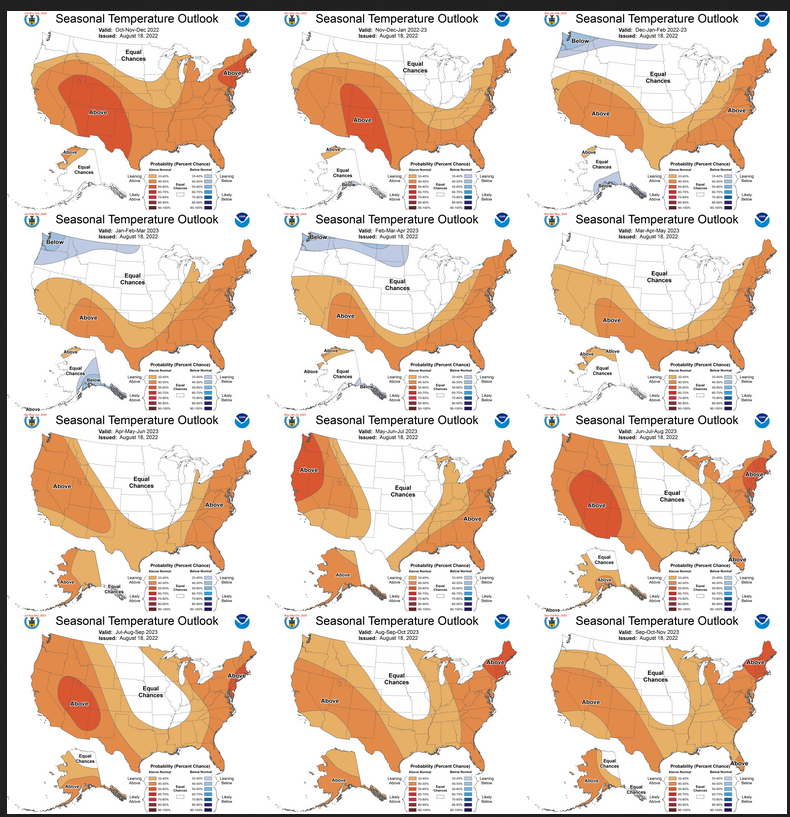
Notice that this presentation starts with October/November/December (OND) since SON is considered the near-term and is covered earlier in the presentation. The changes over time are generally discussed in the discussion but you can see the changes easier in the maps.
|
|
|
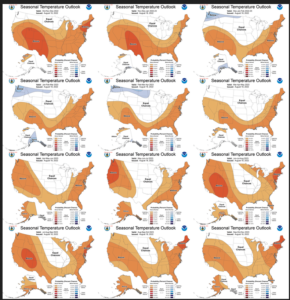
| If you look closely you can see that it is similar to what was shown last month but that there is a change in MJJ 2023 but this is not different from last month. |
Twelve Precipitation Maps
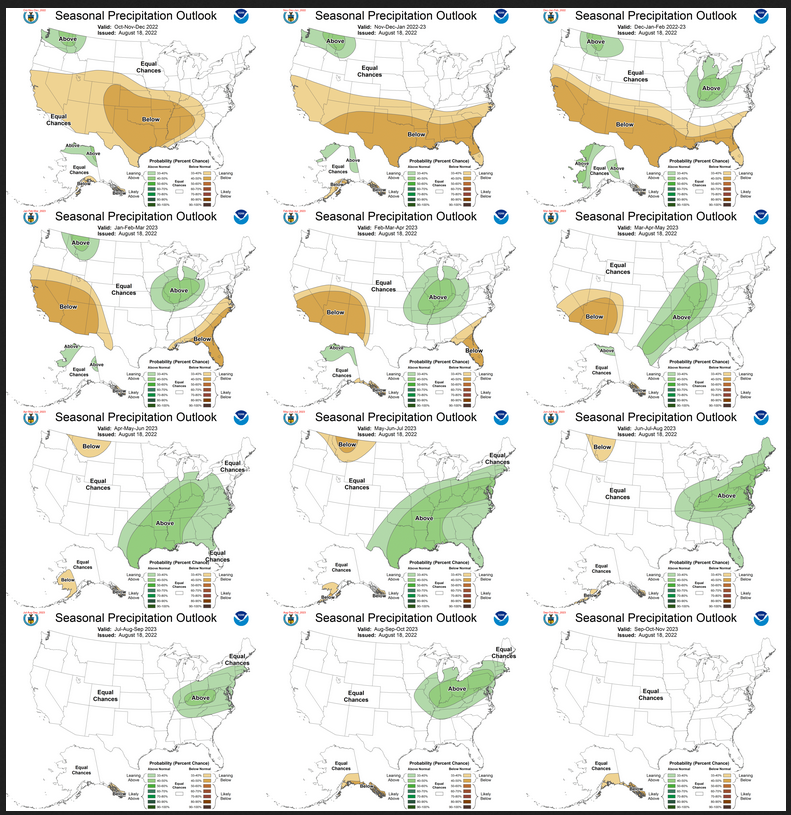
Similar to Temperature in terms of the organization of the twelve overlapping three-month outlooks. The changes over time are generally discussed in the discussion but you can see the changes easier in the maps.
|
|
|
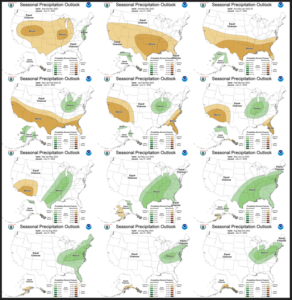
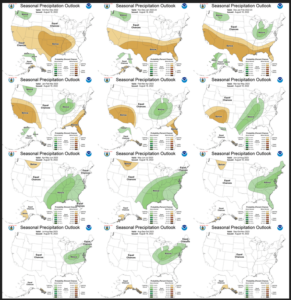
| If you look closely you can see that there is a new Northwest wet anomaly through DJF 2022-2023 and then just like last month there is a major change that starts in JFM 2023 and then an even more major change that starts in AMJ 2023. |
NOAA Discussion
Maps tell a story but to really understand what is going you need to read the discussion. I combine the 30-day discussion with the long-term discussion and rearrange it a bit and add a few additional titles (where they are not all caps the titles are my additions). Readers may also wish to take a look at the article we published last week on the NOAA ENSO forecast. That can be accessed here.
I will use bold type to highlight some things that are especially important. My comments, if any, are enclosed in brackets [ ].
CURRENT ATMOSPHERIC AND OCEANIC CONDITIONS
Oceanic and atmospheric observations across the equatorial Pacific are consistent with the persistence of La Niña conditions. The observed weekly SSTs show negative anomalies across most of the central and eastern equatorial Pacific, with the largest negative anomalies of greater than -1 degree C generally near the Date Line and over the far eastern Pacific near the coast of South America. SSTs from 150W to 110W have cooled about 1 degree C since mid July, as the influence of a downwelling Kelvin wave subsided. Correspondingly, subsurface temperature anomalies returned to negative values from about 160W to 110W to a depth of about 200 meters. There are currently almost no areas of above normal ocean temperatures in the eastern Pacific along the equator, a shift from early July. Low-level easterly and upper-level westerly wind anomalies persisted from July into August, with very strong trade winds across much of the Pacific. Suppressed convection continues near and to the west of the Date Line, primarily south of the equator, with enhanced convection over parts of the Maritime Continent. Positive (negative) SST anomalies remain near the south (west) coast of Alaska and along most of the east coast of the CONUS, potentially influencing local climate conditions.
PROGNOSTIC DISCUSSION OF SST FORECASTS
The CPC SST Consolidation for the Niño 3.4 region indicates a slight decrease in the magnitude of the negative anomalies this summer, followed by increasingly negative anomalies peaking around -1.1 degrees C during the autumn, with a return to ENSO-neutral by spring of 2023. The spread among ensemble members of the North America Multi-Model Ensemble (NMME) for the Nino 3.4 forecast for autumn ranges from a strong La Niña with anomalies around -1.7 C to near zero. Niño 3.4 forecasts by statistical tools range from anomalies exceeding -1.3 C for the Constructed Analog (CA) to about -0.2 C for the Canonical Correlation Analysis (CCA). The NMME maintains a La Niña with negative anomalies averaged for the Niño 3.4 region at or below -0.5 degrees C persisting through JFM 2023. As of early August, the CPC ENSO forecast has probabilities in excess of 70 percent for the continuation of La Niña through the NDJ 2022-2023. The official outlook has even odds for La Niña or ENSO-neutral by JFM 2023.
30-DAY OUTLOOK DISCUSSION FOR SEPTEMBER 2022
The September 2022 outlooks are issued against the backdrop of an ongoing La Niña and a weak Madden Julian Oscillation (MJO) signal. The latest Niño 3.4 weekly sea surface temperature (SST) departures stood at -1.1 degrees Celsius. A significant cold pool has emerged at depth across much of the central and eastern Pacific while a reservoir of warmer than normal water is evident across the western Pacific below 100 meters. Meanwhile, the magnitude of the Real-time Multivariate (RMM) based MJO index has weakened during early August, with the amplitude of the signal falling back within the RMM unit circle after a period of enhanced MJO activity in late July. Although the MJO is forecast to strengthen over the Indian Ocean during the next two weeks, its longevity is uncertain due to the ongoing strong atmospheric response associated with La Niña. Farther to the north, across the extratropics of the Northern Hemisphere, both the Arctic Oscillation (AO) and the North Atlantic Oscillation (NAO) have been predominantly positive during early August while the Pacific North America (PNA) index has exhibited a weak signal. Combined natural analog composites derived from the recent evolution of equatorial Pacific, MJO, and extratropical indices depict a 500-hPa flow pattern for the month of September dominated by below normal heights across most of the higher latitudes of the northern Western Hemisphere, including most of Mainland Alaska and the Panhandle. Anomalous ridging is generally favored across the Aleutians and the western Contiguous United States (CONUS). Farther to the east, natural analog composites depict above normal heights across the western North Atlantic and upstream troughing over the eastern CONUS. Meanwhile, trends during the last 10 years favor above normal heights across most of the forecast domain during the month of September, with the strongest positive anomalies over the north-central CONUS. Natural analog composites, trends , and dynamical guidance from the Copernicus Climate Change Service (C3S), North America Multi-Model Ensemble (NMME), and the Couple Forecast System Version 2 (CFSv2) form the basis of the September outlooks. Antecedent conditions such as extratropical sea surface temperatures, sea ice extent, and soil moisture conditions were also considered where appropriate.
Temperature
Above normal temperatures are favored for most of the west-central CONUS, consistent with anomalous ridging. The strongest probabilities (greater than 50 percent) of above normal temperatures are indicated near the Four Corners region southeastward to extreme western Texas, where dynamical and statistical guidance show the strongest agreement. Enhanced above normal temperature probabilities extend eastward, to parts of the Corn Belt, where trends indicate the strongest warm signal. Above normal temperatures are also favored for the Florida Peninsula and the Northeast, ahead of anomalous troughing suggested by the natural analogs over the eastern CONUS. Equal chances (EC) of above, near, and below normal temperatures are indicated for the remainder of the eastern CONUS as a cold signal associated with anomalous troughing in the natural analogs is mitigated by warmer dynamical model guidance and trends . Increased chances of below normal temperatures are indicated for parts of Mainland Alaska due to overwhelming support among the natural analogs for anomalous troughing and below normal heights across much of the state. However, probabilities of below normal temperatures were tempered due to relatively warmer dynamical model guidance, trends , and below normal sea ice extent across the Arctic.
Precipitation
Above normal precipitation is favored for parts of the Southwest, as an active monsoon is forecast to persist by the CFSv2 and weeks 3-4 guidance from the European Centre for Median-Range Weather Forecasts (ECMWF). Below normal precipitation is most likely farther to the north, from central California eastward across parts of the Great Basin and Rockies, consistent with anomalous ridging over the western CONUS and supported by the C3S and natural analogs . Below normal precipitation is also the most likely scenario across most of the north-central CONUS behind anomalous troughing depicted by natural analog composites. Conversely, above normal precipitation is favored across much of the Gulf Coast region and parts of the Southeast, near and ahead of this trough and supported by the C3S and the CFSv2. Predicted above normal tropical cyclone activity in the Atlantic Basin may also potentially add to monthly precipitation totals across this region. Above normal precipitation is also favored for the Alaska Panhandle, due to support from the C3S and CFSv2, and consistent with anomalous troughing depicted by natural analog composites. Below normal precipitation is favored for much of the South Coast of Mainland Alaska westward to the Alaska Peninsula, due to anomalous offshore 500-hPa flow and associated dry signals indicated by natural analog composites.
Prognostic Discussion for Long-Lead Seasonal Outlooks
SUMMARY OF THE OUTLOOK FOR NON-TECHNICAL USERS (Focus on September/October/November
Temperature
The September-October-November (SON) 2022 temperature outlook predicts elevated probabilities of above-normal seasonal mean temperatures across most of the Contiguous United States (CONUS). The largest probabilities of above-normal temperatures exceed 60 percent for parts of New England and portions of the Central Rockies.
Precipitation
The SON precipitation outlook predicts elevated probabilities of above-normal precipitation for portions of the Gulf Coast, Florida, and the Mid-Atlantic Coast, as well as a small portion of the Pacific Northwest. Below-normal precipitation is more likely from the Great Basin to the Western Great Lakes, southward to the Southern Appalachians, and southwest to the Rio Grande Valley. The area of below-normal precipitation encompasses and includes much of the Great Plains. Below-normal precipitation is also favored for portions of southern Mainland Alaska. Equal chances (EC) of above, near, and below normal temperature or precipitation are forecast in areas where the likelihood of seasonal mean temperatures or seasonal accumulated precipitation amounts are expected to be similar to climatological probabilities.
A La Niña advisory remains in effect and equatorial sea surface temperatures (SSTs) are below average across the central and eastern Pacific Ocean. The tropical Pacific atmosphere is consistent with a La Niña, with enhanced low-level easterly winds and suppressed convection near the Date Line. La Niña is expected to continue, with chances for La Niña gradually decreasing from 86% in the coming season to 60% during December-February 2022-23.
BASIS AND SUMMARY OF THE CURRENT LONG-LEAD OUTLOOKS
PROGNOSTIC TOOLS USED FOR U.S. TEMPERATURE AND PRECIPITATION OUTLOOKS
Dynamical model guidance from NMME and the Calibration, Bridging, and Merging (CBaM) version of the NMME were used through lead 5. La Niña temperature and precipitation impacts based on regressions on Niño-3.4 SST anomalies were also included for seasons from NDJ 2022 through February-March-April (FMA) 2023. An ENSO-OCN tool that uses the consolidation forecasts of the Niño-3.4 SST anomalies plus decadal trends to predict temperature and precipitation was also considered for all leads. The consolidation tool, which combines both the NMME and various statistical tools as inputs, was used through all seasonal leads. At longer leads, from April-May-June (AMJ) to SON 2023, decadal trends represented by the optimum climate normals (OCN) were the primary driver of the climate outlooks.
PROGNOSTIC DISCUSSION OF OUTLOOKS – SON 2022 TO SON 2023
TEMPERATURE
Above-normal temperatures are favored throughout much of the CONUS during SON 2022, with probabilities that vary regionally. The areas with highest probabilities for above-normal temperatures are across the Central Rockies and New England, where dynamical model outputs and statistical tools reflect similar signals . The current SON outlook has lower probabilities for above-normal temperatures across the Pacific Northwest and Northern California to reflect the latest model guidance from the NMME. Chances of above-normal temperatures are increased from the previous SON and October-November-December (OND) outlooks across portions of the Northern Plains. The outlook for OND2022 reflects similar changes over the Pacific Northwest and Northern California, as well as the Northern Plains. Across Alaska, recent guidance, as consolidated in the NMME/statistical tools consolidation, indicates mixed signals across the western portions of the state with some indications of below-normal temperatures across the interior portions of the state, which are included in the current outlook for SON. The outlook for December-January-February (DJF) 2022-2023 now slightly favors below-normal temperatures from the Pacific Northwest to the Northern Plains, reflecting current guidance and a bit more certainty in the La Niña continuing through early portions of 2023. Correspondingly, the outlooks for JFM and FMA 2023 are also colder across the Northern Great Plains. Outlooks for March-April-May (MAM) through SON 2023 are based on the consolidation of the statistical tools and ENSO/decadal trend tool, and are largely unchanged from the previous release.
PRECIPITATION
During SON 2022, above-normal precipitation is favored for small portions of the Pacific Northwest, Gulf Coast, and southeast Coast, supported by the NMME and statistical consolidation. The consolidation also supports a broad area of below-normal across much of the CONUS with the highest probabilities across the Central and Southern Rockies, reflective of the end of the monsoon and influenced by La Niña later in the season. Outlooks from OND2022 through JFM2023 are largely similar to the July outlooks but with minor changes. One minor change is the addition of an area where above-normal precipitation is favored across the Pacific Northwest and Northern Rockies. Another minor change is the slight increase in probabilities for below-normal precipitation across the Southwest and Southern California, reflecting the greater certainty in La Niña persisting through the winter. The La Niña signature is likely to fade during FMA and MAM2023, given that La Niña and ENSO-neutral are about even odds. Outlooks for AMJ through June-July-August (JJA) reflect the consolidation, which now includes a small area of below-normal precipitation across the Northern Rockies, largely coming from trends . Across the eastern CONUS, the AMJ through August-September-October (ASO) outlooks are unchanged. For Alaska, below-normal precipitation is favored across southern Mainland Alaska and the Alaska Panhandle during OND2022 and DJF2022-2023 with above-normal precipitation across the North Slope and near the border with Canada. During DJF, odds for above-normal precipitation peak along the west coast of Alaska, and thereafter diminish through MAM2023. From AMJ through JJA, below normal precipitation is favored for southwest mainland Alaska and the Alaska Panhandle, largely reflective of trends.
Review of the ENSO Assumptions utilized by NOAA (CPC) in Preparing this Four-Season Outlook
It is useful to review the ENSO forecasts used by NOAA to produce this Four-Season Outlook. We reported on that last week and you can read that article by clicking here
The key information used by NOAA follows.
IRI CPC ENSO STATE Probability Distribution (IRI stands for the International Research Institute for Climate and Society)
Here are the new forecast probabilities. This information is released twice a month and the first release is based on a survey of Meteorologists, the second is based on model results. The probabilities are for three-month periods e.g. JAS stands for July/August/September.
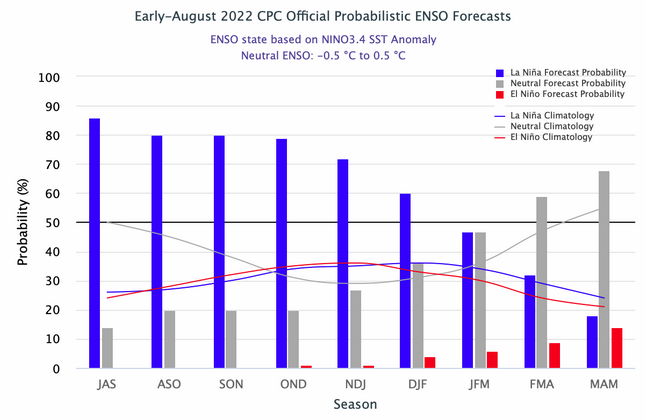
| Notice for JFM 2023 the probability of La Nina and ENSO Neutral is about equal. One way of looking at that is that the Nino 3.4 Index is likely to be close to -0.5C. But for FMA the probability for ENSO Neutral Exceeds that for La Nina. So maybe March is when the ocean conditions will be consistent with ENSO Neutral but the impact on our weather may lag a month or so. So we really seem to be looking a La Nina weather into Spring. |
Here is the forecast from Last Month. It is not very different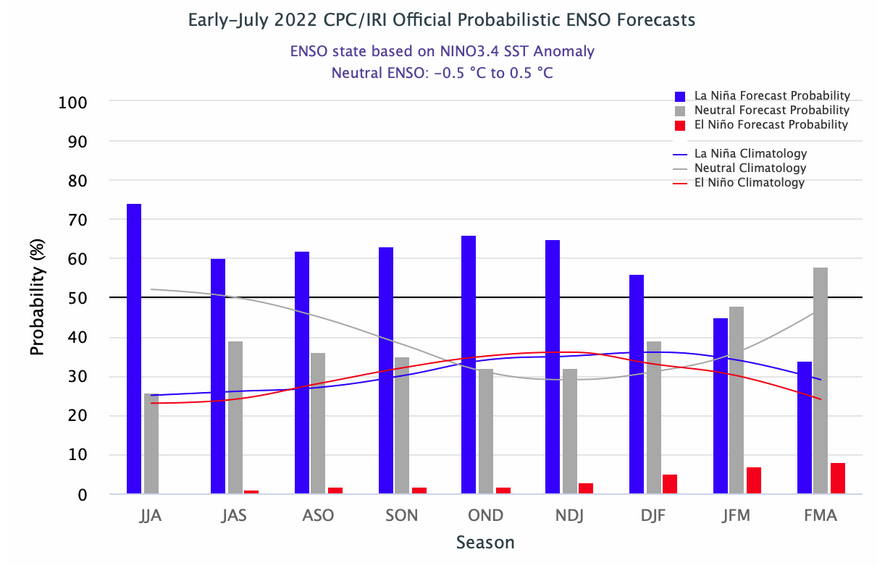
Analysis of the current and prior first and second Forecasts in each month.
IRI actually makes two forecasts a month. The first which is based on a survey of meteorologists is the one that NOAA relies on when they prepare their seasonal outlook. The second is a summary of the forecasts made by a set of computer models.
I am only showing one set of these forecasts in the article tonight. It shows the two most recent forecasts while above we show the first forecast in July and the first Forecast in August so it can be confusing.
| It is important to realize that there is not much difference between ENSO Neutral with a La Nina Bias meaning the NINO 3.4 Index is close to -0.5C and a very weak La Nina where the NINO 3.4 Index is just slightly colder than -0.5C. The + and – thresholds are somewhat arbitrary. In Australia, they use + or – 0.8C as their threshold which appears to make more sense for that part of the World. Notice for JFM 2023 the probability of La Nina and ENSO Neutral is about equal. One way of looking at that is that the Nino 3.4 Index is likely to be close to -0.5C. |
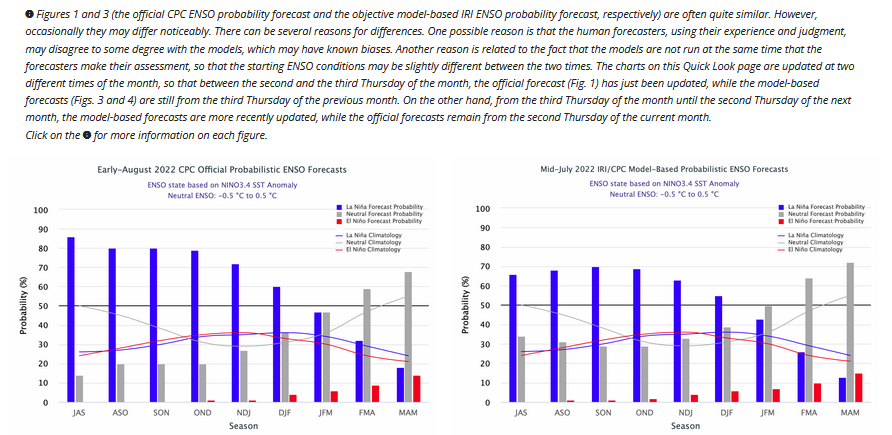
This repeats the graphics shown earlier but shows them side by side for easy comparison.
| Early July | Early August |
|
|
|

| There has not been a lot of change over the last month. |
Tropical Subsurface Temperature Anomalies
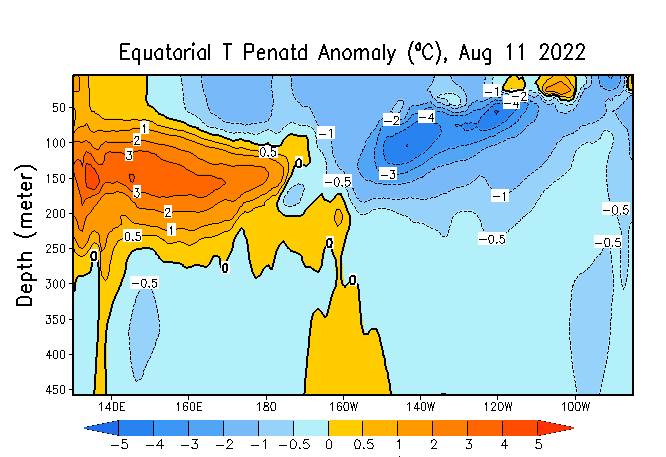
| This may be a week later than the information that NOAA used but there has been little if any change in the Subtropical Pacific. From what I see here, I do not know when the La Nina will end but I am reporting what NOAA says. |
We do benefit from now having the plume of forecasts. This is what was issued last month. We will have a new version in a week or so.
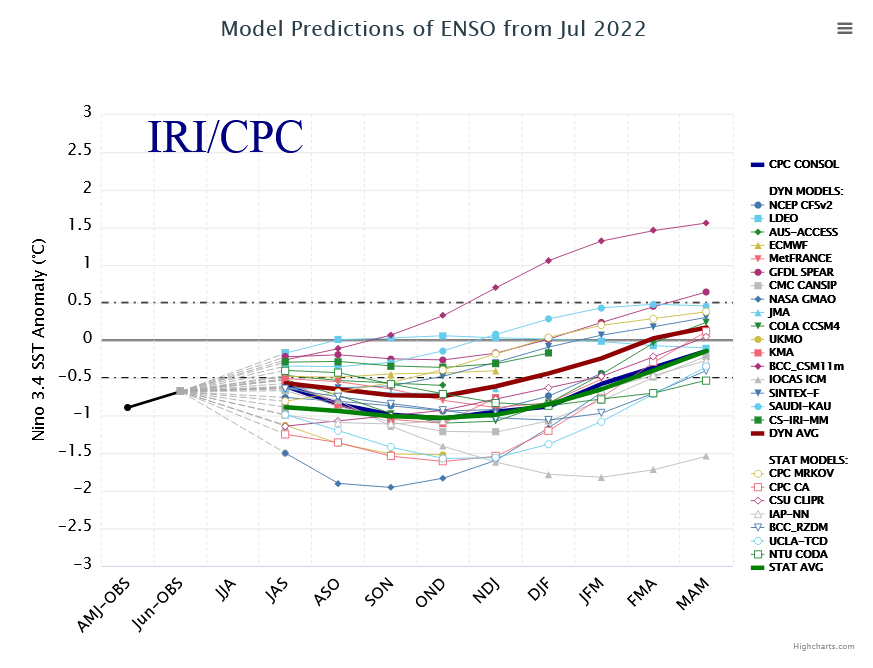
| This is a little tricky to read because there are a lot of models and three subtotals: dynamic models, statistical models and all the models. In general, the dynamic models are the more accurate. It is kind of the thick purple line and it seems to show ENSO Neutral happened around DJF 2022/2023 which is maybe a month or two earlier than the IRI analysis. We should have a new version of the above in a week. |
And we include one more graphic namely the NOAA proprietary ENSO model. It is not the primary tool that NOAA uses but we find it to be useful.
 –
–
| The above will not auto-update. But the image will update if you click HERE. https://www.cpc.ncep.noaa.gov/products/people/wwang/cfsv2fcst/images3/nino34SeaadjPDFSPRDC.gif
NOAA relies more on the IRI Forecast. But perhaps this model is now showing that we may become ENSO Neutral for Late Fall or early Winter. This is my interpretation not the formal forecast of NOAA. The differences in most analyses are a month or two. |
Monsoon Update
North American Monsoon (NAM)
The SOn Outlook is shown earlier. But that may not extend through the Monsoon. So I am showing one additional Outlook Map that extends farther in time.
I am showing them side by side. On the left is SON and on the right is OND
|
|
|

| You can see that in SON the above-normal intensity of the Monsoon has already withdrawn from Eastern New Mexico and for SON we are back in drought to the north. Taking a look at OND on the right there is almost no sign of a Monsoon other than a little area that shows EC for precipitation. Here is a pretty good write-up on the North American Monsoon. Click Here to read. |
Resources
The link for the drought outlook map and some discussions that come with the map can be found by clicking HERE.
| I hope you found this article useful and interesting. |