One of the time periods without significant inflation changes is incorrectly specified in Part 15.1 This post corrects that error.

Photo by Brett Jordan on Unsplash
Introduction
In the previous post, 1927-1928 was incorrectly identified as a time period when inflation had no significant changes (≥ 4%). The correct time period was one year longer, 1927-1929. The data, analysis, and conclusions affected by this change are corrected here.
Data
The time periods with no significant inflation changes are shown in the corrected Table 1.
Table 1. Periods without Significant Inflation Trends 1914-2022
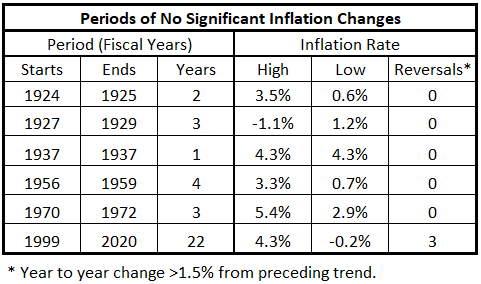
Table 1 shows the data summary for the 35 years not part of a significant inflation surge (≥ 4%), up or down, during the years 1914-2022.
Analysis
We use the same data as previously. First, we determine the time series and correlations for the two data sets coincident for each federal fiscal year. In addition, we calculate correlations for inflation offsets of ±3, ±6, ±9, ±12, ±18, and ±24 months with respect to the fiscal years. The thirteen data tables are in Part 13A, Appendix 1.2
Table 1 shows the time periods with no significant changes in inflation (increases or decreases).
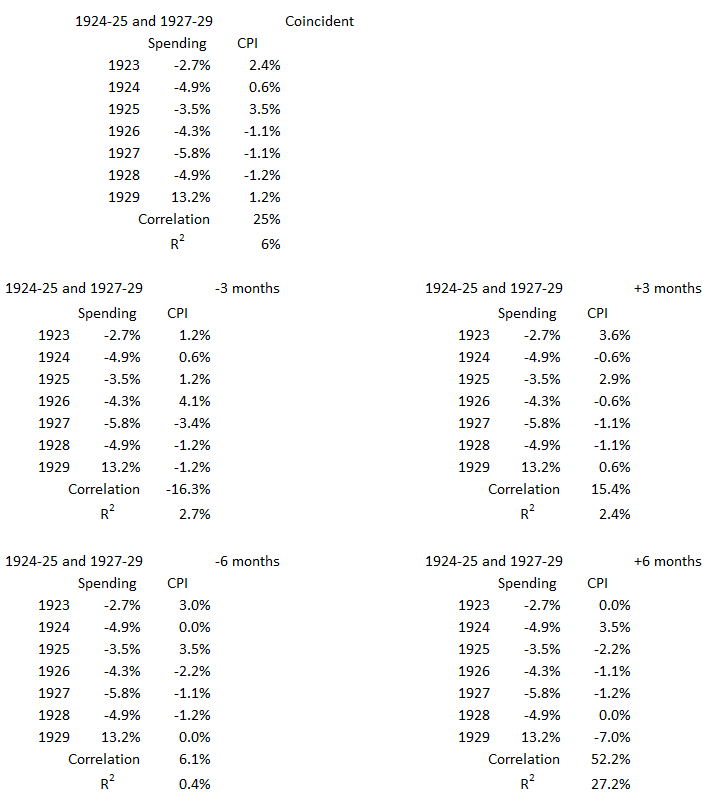
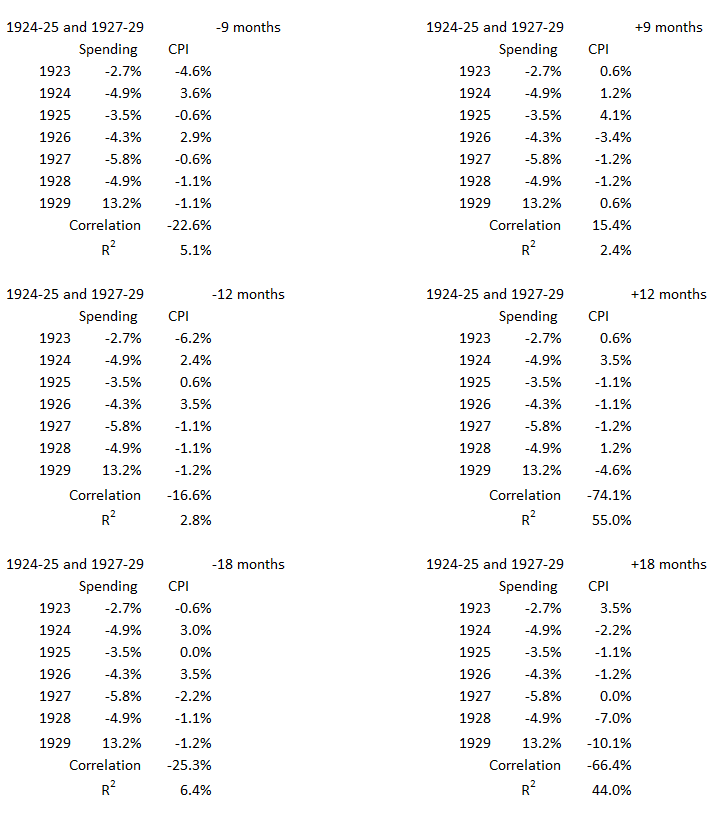
1924-1925 and 1927-1929
The 1920s saw two years of surging inflation (1922-1923), three years of surging deflation (1920-1921 and 1926), and five years where inflation was not increasing or decreasing significantly (1924-1925 and 1927-1929).
Figure 1. U.S. Federal Deficit Spending and Inflation for the Fiscal Years 1923 – 1929
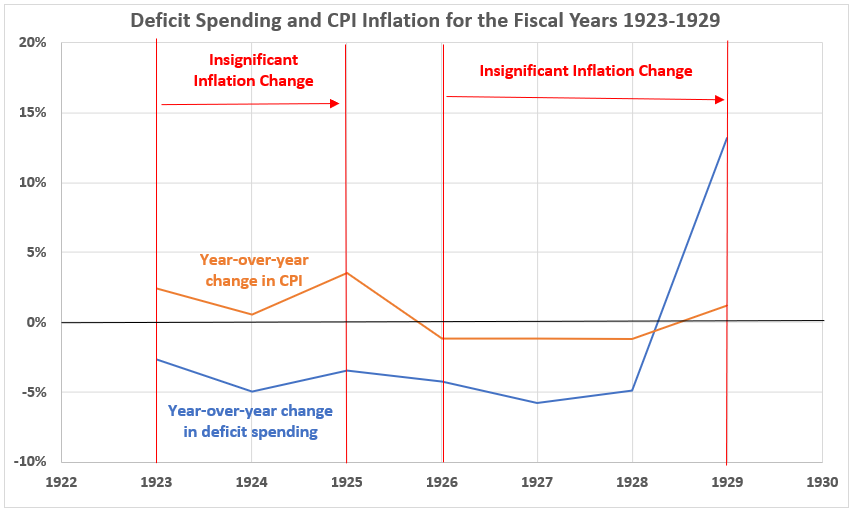
In the 1920s, federal budgets were consistently in surplus (1929 excepted), and only two of the years were part of an inflation surge. Figure 1 shows the changes in federal spending and consumer inflation for the years 1923-1929, which includes the two periods without significant inflation changes.
Figure 2. Annual Changes in Deficit Spending vs. Inflation for the Fiscal Years 1923-1929
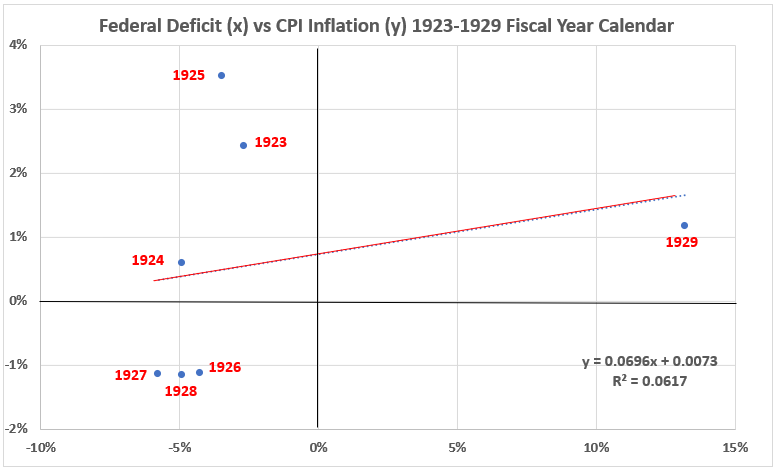
The years 1923-1928, which cover two periods with insignificant inflation, have a weak positive correlation (R2 = 6%, R =25%). The year, 1929, clearly falls outside the group of the other years because of the surge in the federal deficit, and that is the reason for the weak correlation.
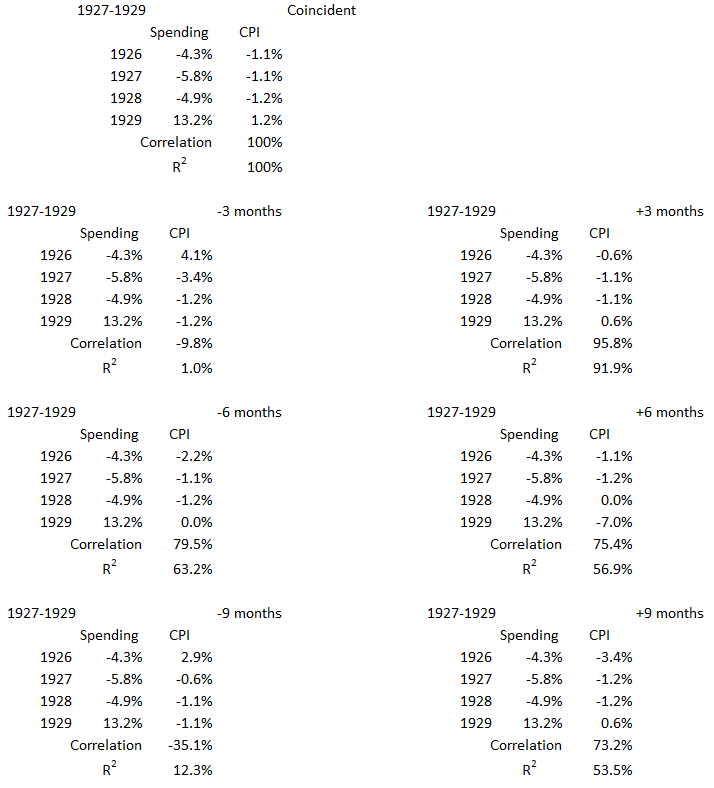
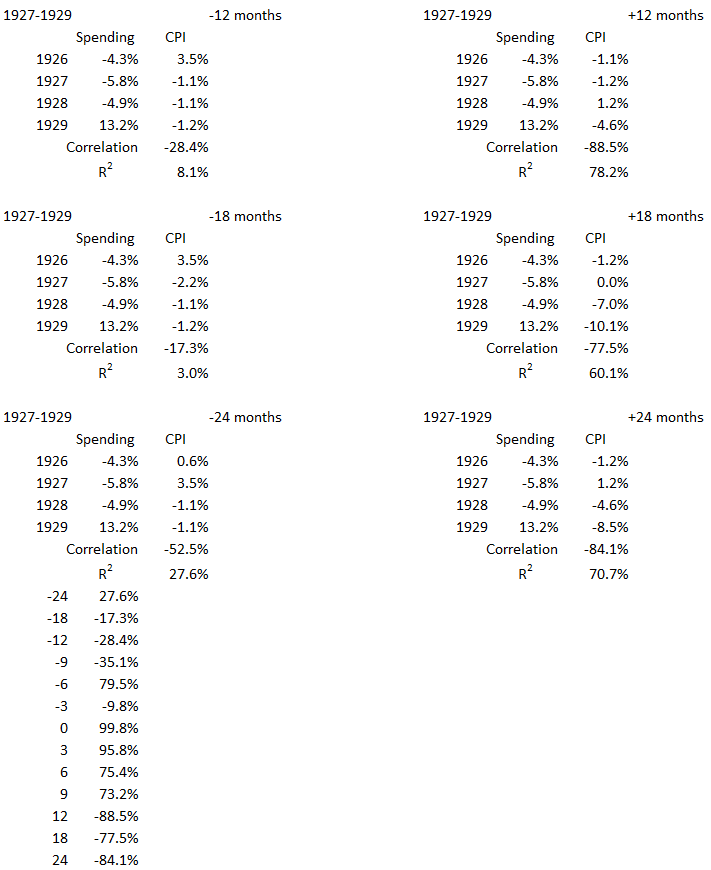
Figure 3. Correlation Between Deficit Spending and Inflation 1927-1929
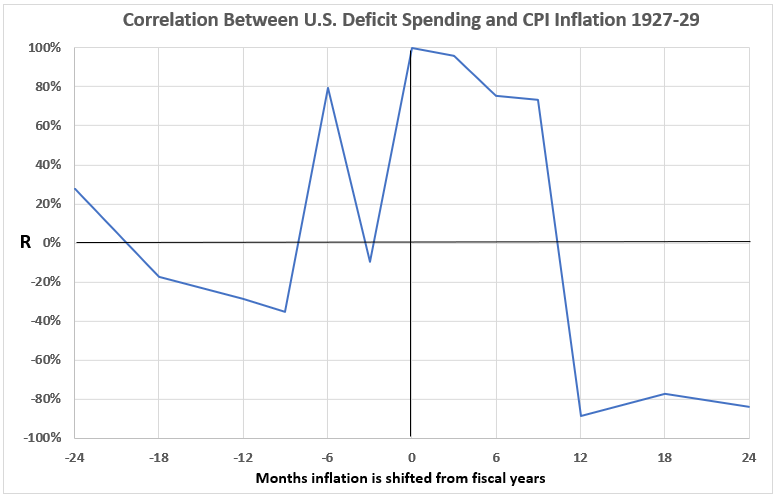
The data displayed in Figure 1 and Figure 2 are for inflation data and deficit spending data, both aligned to the fiscal year (July 1, 1923 – June 30, 1924 for federal fiscal year 1924). Figure 3, shows correlations for shifting inflation data by ±3, ±6, ±9, ±12, ±18, and ±24 months with respect to the fiscal year calendar. The purpose is to see if inflation changes might lead to fiscal spending changes or vice versa.
Figure 3 shows significant correlations for coincident data and for shifts near coincident. Note that significant correlations are more numerous when inflation shifts to come after deficit spending (+3, +6, and +9 months).
These results suggest that inflation changes caused by federal spending changes are possible during this time period. Also, it is possible that federal spending changes might result from inflation changes (-6 months result). But the results are not proof of cause and effect. Thus, determining the possibilities of cause and effect requires additional data.
Conclusion
Table 2 shows definitions for correlations in this study.
Table 2. Definitions Regarding Correlations

Table 3, using the classifications in Table 2, summarizes the analysis results. This table is identical to the previous Table 31 except for the second line, which now shows the results for 1927-1929 instead of the prior 1927-1928.
Table 3. Correlations for Inflation w/o Surges and Federal Deficits 1914-2022

All the significant cells contain a red S, and all the null and negative cells have light gray shading to improve focus when scanning the table.
From Table 3, we draw the following conclusions:
- It is possible that inflation causes deficit spending, and deficit spending causes inflation for the three time periods before World War II (1924-25, 1927-29, and 1937).
- After World War II, the likelihood of cause-and-effect relationships between inflation and federal deficit spending diminished.
- In the 21st century, cause-and-effect relationships do not seem likely between inflation and deficit spending for the years 1999 through 2020.
The next and final installment in this series will review all work done. This will be here next week.
Appendix
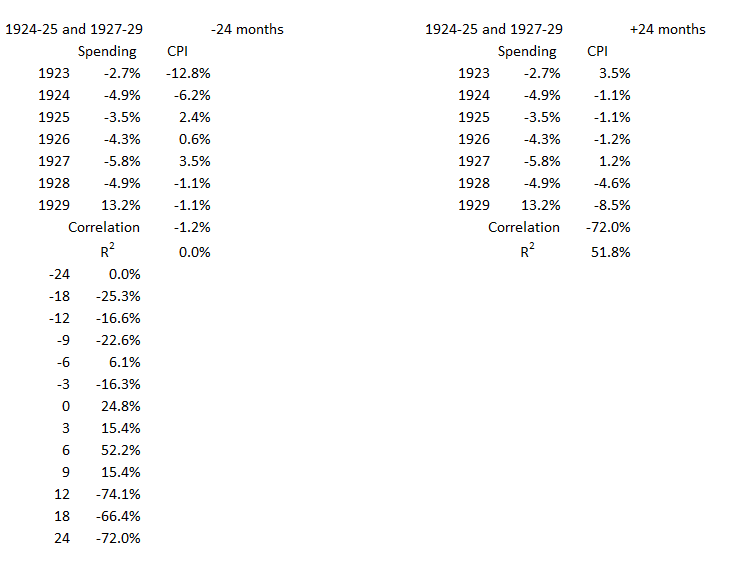
n this appendix, we show all the data selections used to analyze each of the periods without significant surges of inflation, either up or down. The data are from the tables in Part 13A, Appendix 1.2
1927-1929
1924-1925 and 1927-1929
Footnotes
1. Lounsbury, John, “Government Spending and Inflation. Part 15”, EconCurrents, July 23, 2023. https://econcurrents.com/2023/07/23/government-spending-and-inflation-part-15/
2. Lounsbury, John, “Government Spending and Inflation. Part 13A”, EconCurrents, June 4, 2023. https://econcurrents.com/2023/06/04/government-spending-and-inflation-part-13a/