On the third Thursday of the month right on schedule NOAA issued what I describe as their Four-Season Outlook. The information released also included the Mid-Month Outlook for the single month of July plus the weather and drought outlook for the next three months. I present the information issued by NOAA and try to add context to it. It is quite a challenge for NOAA to address the subsequent month, the subsequent three-month period as well as successive three-month periods for a year or a bit more. A seasonal drought outlook is also issued.
It is very useful to read the excellent discussion that NOAA issues with this Seasonal Outlook. The overall level of confidence in the Seasonal Outlook is addressed in the NOAA discussion. It is best to read the full discussion but here are some of the highlights:
Re ENSO:
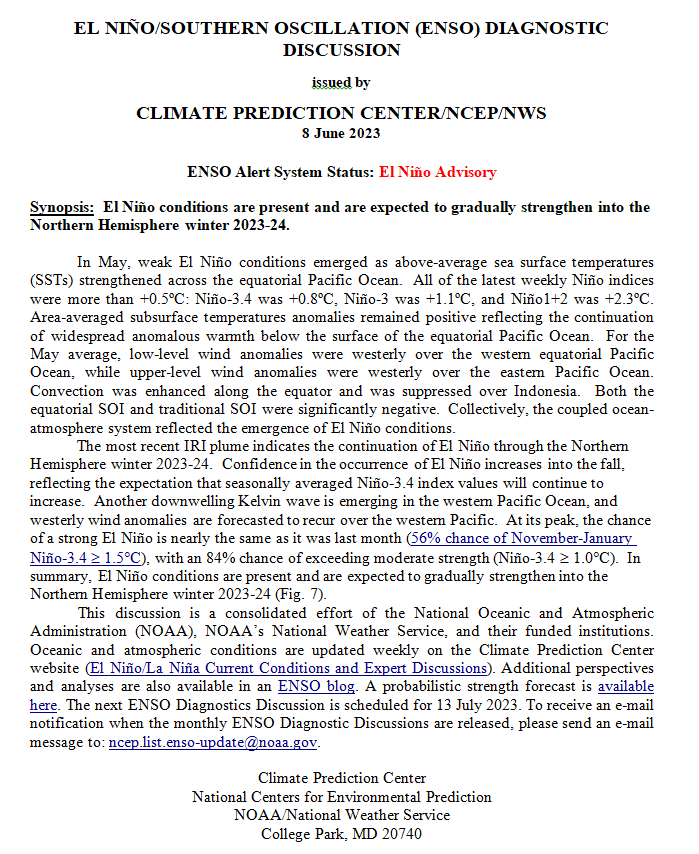
- “NOAA’s CPC forecast calls for more than a 90 percent chance of El Niño persisting through JFM 2024 with a 56 percent chance of a strong El Niño (> 1.5 degrees C) during NDJ 2023.”
For July:
- “Above normal temperatures are favored from the Four Corners region, across the central and southern Great Plains, the Southeast, and the Northeast.”
- “A weakened monsoon during July across eastern Arizona and New Mexico is predicted”
- “a strong subtropical ridge, which would favor above-normal precipitation from the southern Great Plains northward and into the Mid-Atlantic”
- “a storm track across the northern Great Plains and into the Ohio River valley”
For JAS 2023:
- “The highest probabilities (more than 50 percent) of above-normal temperatures are forecast across parts of California, the Pacific Northwest, Great Basin, Southwest, Gulf Coast, and East.”
- “elevated probabilities of below-normal precipitation for parts of the Southwest, Pacific Northwest, and Great Lakes, while above-normal precipitation is favored across much of the Great Plains, parts of the Middle to Lower Mississippi Valley, Northern Rockies, and Florida Peninsula.”
Beyond JAS 2023:
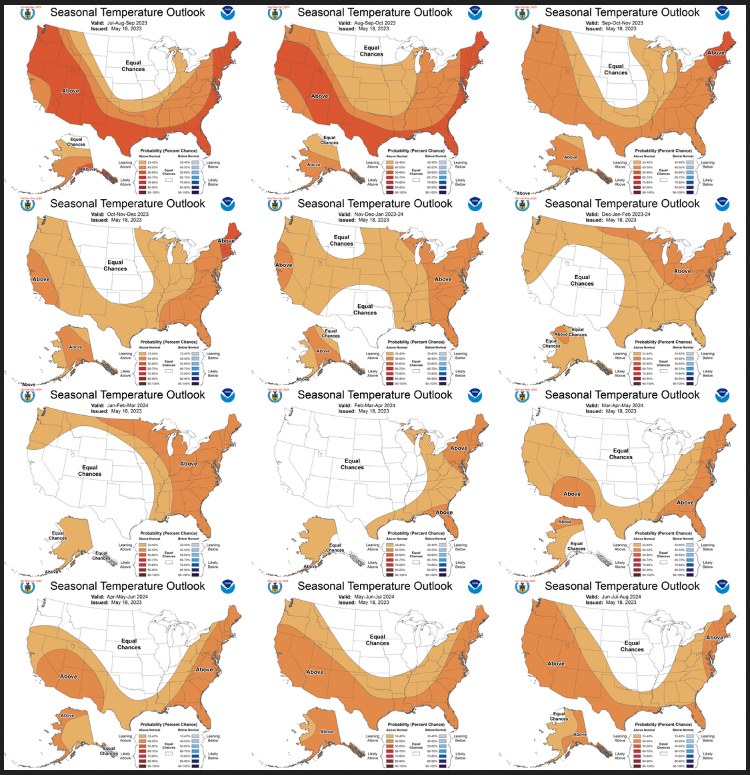
- “Above-normal temperatures remain the most likely outcome throughout much of the U.S. from ASO to OND 2023.”
- “Beginning in NDJ 2023-24 through JFM 2024, predicted El Niño conditions result in enhanced chances for above-normal temperatures across the northern tier of the CONUS”
- “During the winter 2023-24, above-normal temperatures are favored across the East”
- “Precipitation outlooks during the fall 2023 through the winter 2023-24 relied upon El Niño composites and the consolidation tool with an increased chance of above (below)-normal precipitation across the southern (northern) tier of the CONUS.”
- “The largest probabilities (50 percent for above) are forecast across parts of the Southeast from NDJ 2023-24 through JFM 2024 based on a strong, reliable wet signal associated with El Niño.
- “During the spring and summer 2023, the precipitation outlooks are based mostly on decadal trends.”

| The current weather report is always available at econcurrents.com To return to this article, hit the return arrow in the upper left-hand corner of your screen. |
Let’s Take a Look at the Mid-Month Outlook for June.
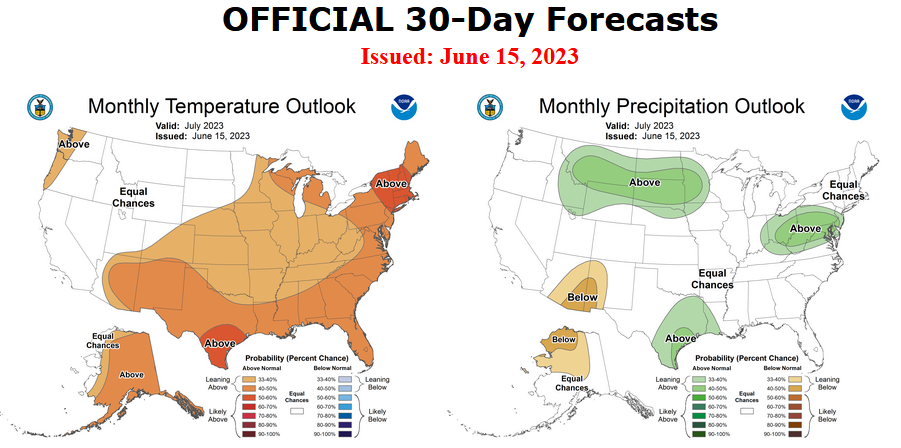
Combination Mid-Month Outlook for next month (July) and the Three-Month Outlook
The top row is what is now called the Mid-Month Outlook for next month which will be updated at the end of this month. There is a temperature map and a precipitation map. The second row is a three-month outlook that includes next month. I think the outlook maps are self-explanatory. What is important to remember is that they show deviations from the current definition of normal which is the period 1991 through 2020. So this is not a forecast of the absolute value of temperature or precipitation but the change from what is defined as normal or to use the technical term “climatology”.
| Notice that the outlook for next month and the three-month outlooks are somewhat different. This always raises the question of what will month two and month three look like. |
| For both temperature and precipitation, if you assume the colors in the maps are assigned correctly, it is a simple algebra equation to solve the month two/three anomaly probability for a given location = (3XThree-Month Probability – Month One Probability)/2*. So you can derive the month two/three outlook this way. You can do that calculation easily for where you live or for the entire map. |
Here are larger versions of the Temperature and Precipitation Outlook maps for next month.
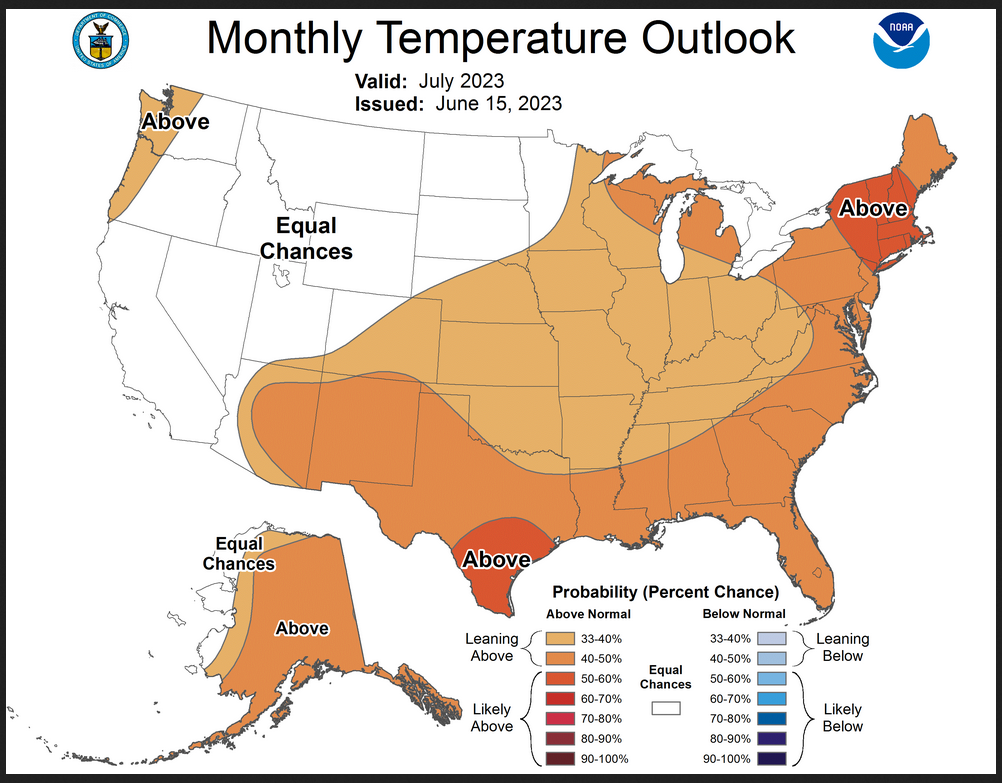
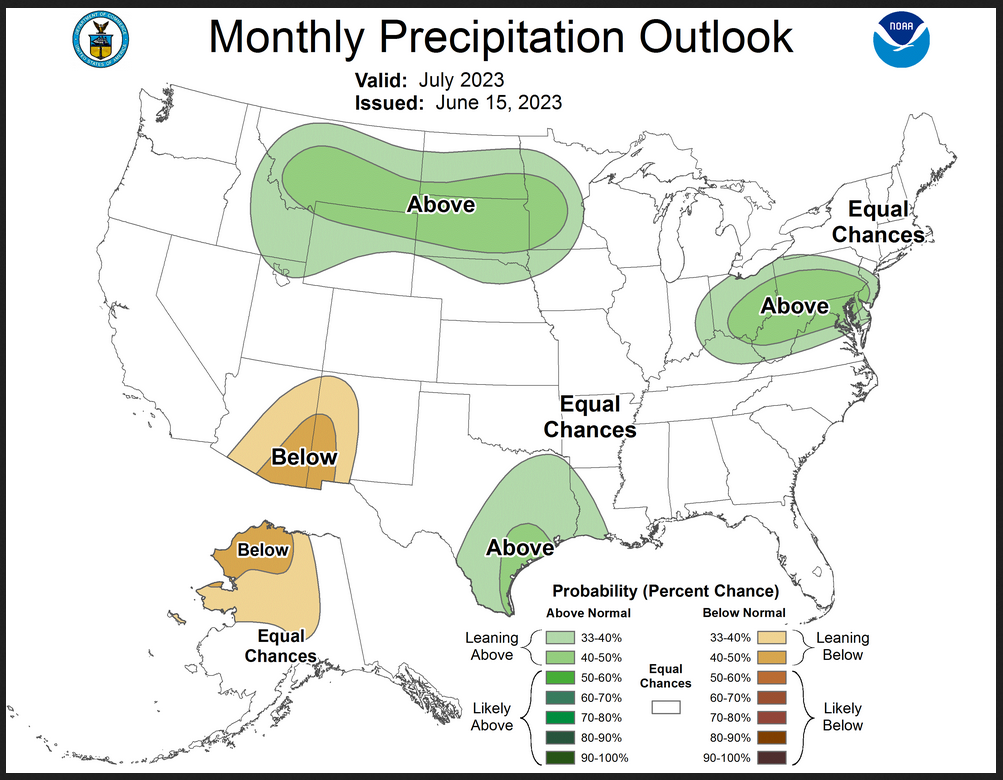
The maps are pretty clear in terms of the outlook.
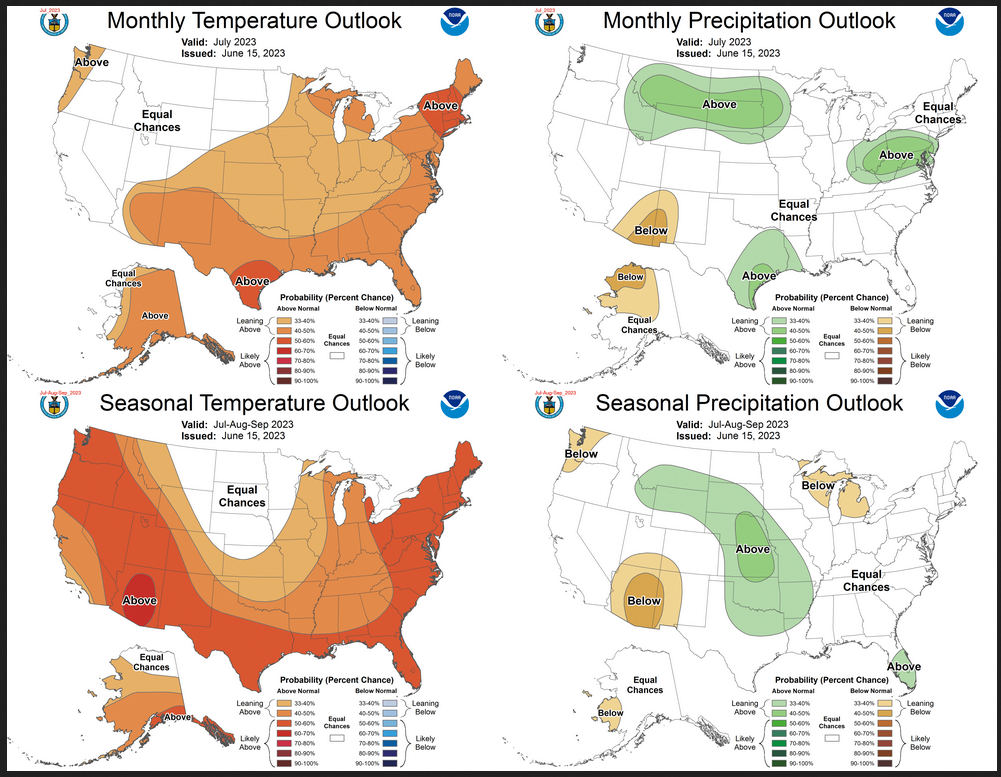
And here are large versions of the three-month JAS 2023 Outlook
First temperature followed by precipitation.
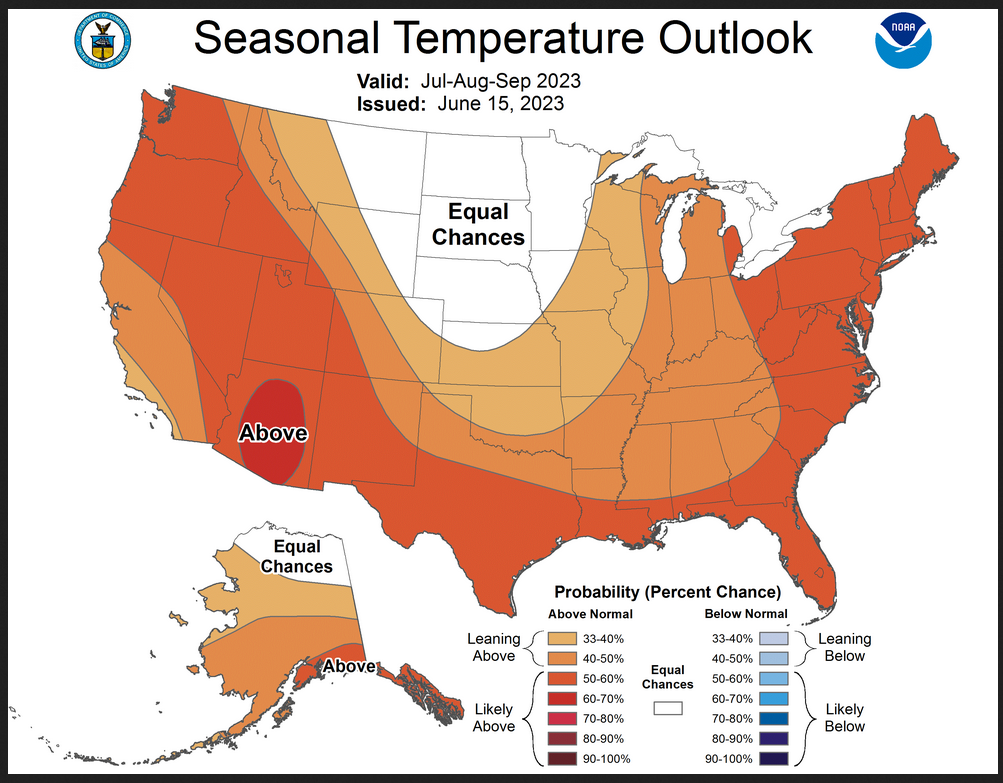
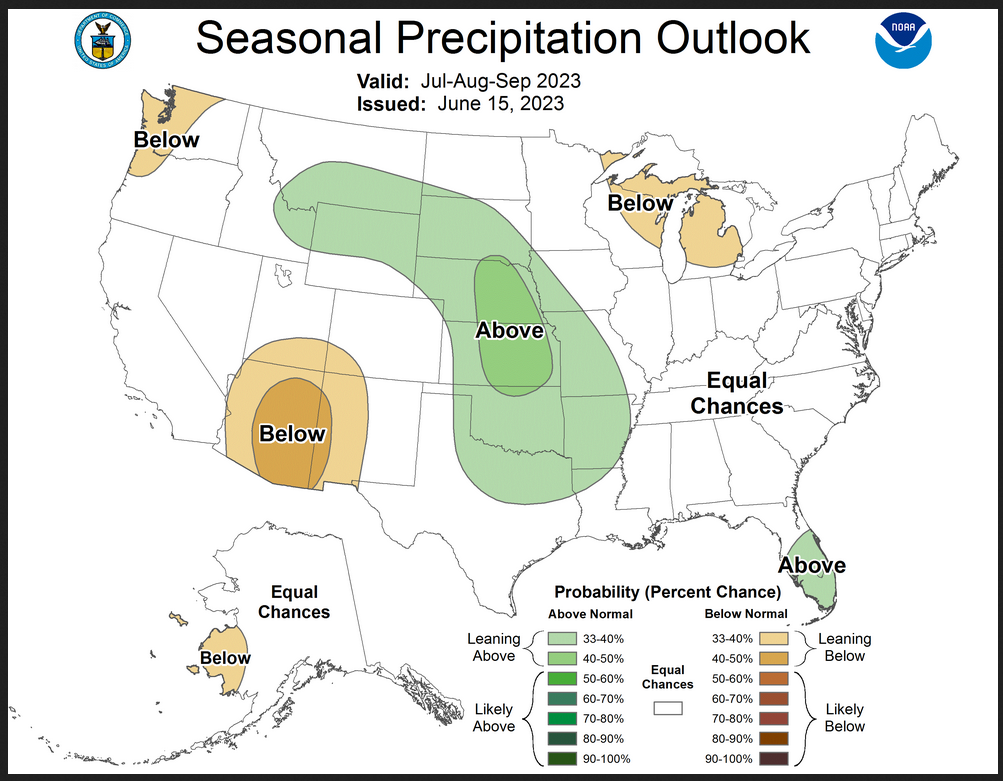
| These maps are larger versions of what was shown earlier. The JAS precipitation pattern is classic for a weak Southwest Monsoon. The drivers of a weak Monson or delayed Monsoon at least early on benefit the area shown in the Great Plains as wetter than normal. The reverse tends to happen with a strong Southwest Monsoon. |
Drought Outlook
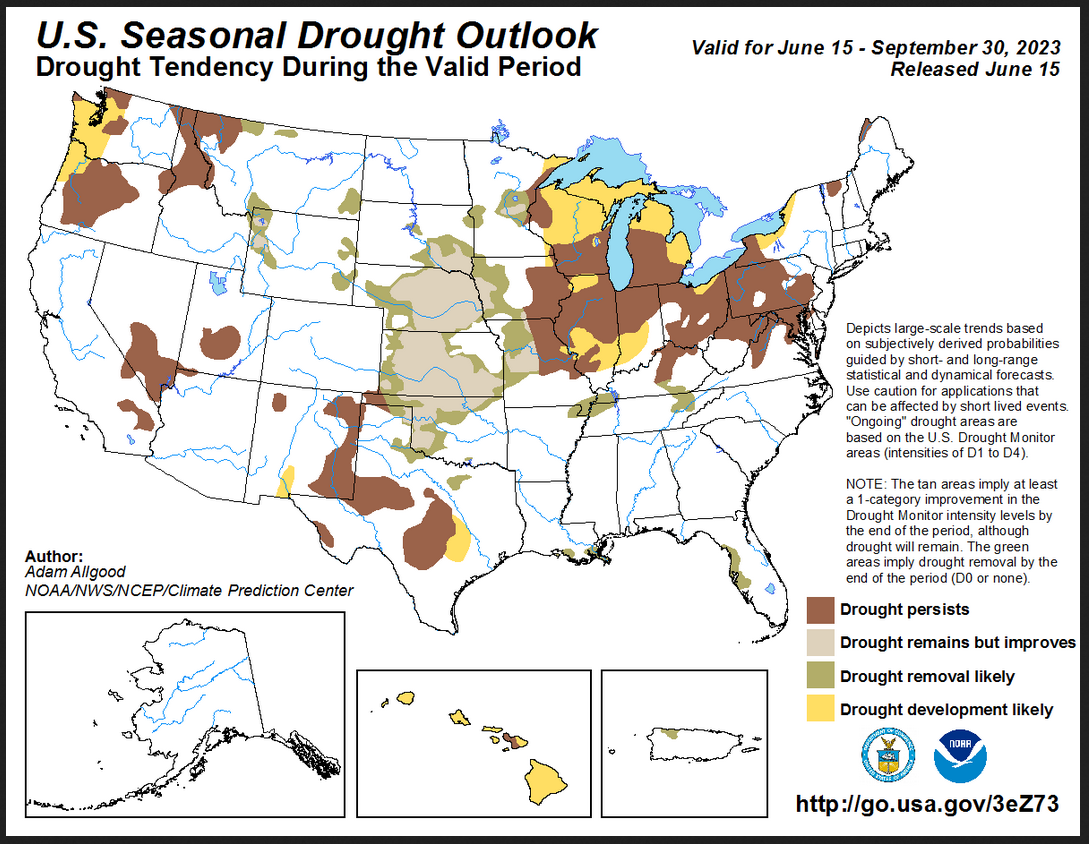
| The yellow is the bad news and there is hardly any yellow showing. The area with drought improvement is quite large. But the area of existing drought and drought enhancement is very concerning for corn and other crops. |
Short CPC Drought Discussion
Drought Summary
Latest Seasonal Assessment – During the past month, frequent storminess brought widespread drought reductions to the Plains, though large areas of extreme to exceptional drought remain entrenched across portions of Kansas and eastern Nebraska. Late season moisture and hot temperatures resulted in a rapid melting of the winter snowpack, which both helped ameliorate drought conditions across the Northern Rockies,. Drier, warm conditions across the Northwest promoted some drought expansion across the Cascades and coastal Washington. East of the Plains, a persistent blocking pattern promoted persistently below-normal rainfall, resulting in a rapid onset of drought and abnormal dryness across much of the Corn Belt, Mid-Atlantic and Northeast. Further south, the onset of Florida’s seabreeze-driven convective rainy season began to ease drought conditions, while mild temperatures across the remainder of the Southeast helped keep widespread drought expansion at bay.
The seasonal drought outlook for July – September 2023 is based on official forecasts at various time scales, climatology, and an anticipated response in the midlatitude pattern to developing El Niño conditions across the equatorial Pacific. A potentially below-average Southwest monsoon favors drought persistence across the California deserts, Great Basin, and Four Corners regions, though wet antecedent conditions should preclude widespread drought expansion. Some development is possible across southern New Mexico. Gradual drought development is also possible for the Pacific Northwest, due to below-average precipitation favored in the official CPC outlook for JAS. East of the continental divide, wetter conditions favor continued drought reductions across the northern and central Plains, though heat and dryness across Texas early in the period may promote some drought expansion. More widespread drought development is anticipated for the central Corn Belt, Great Lakes region, and western New York, with long range forecasts favoring below-normal precipitation and above-normal temperatures. Forecast confidence is very low for the mid-Atlantic and Northeast, as periods of rainfall may help prevent further degradation, but low streamflows and soil moisture content ahead of the climatologically hottest month of the year will be tough to completely overcome. In contrast, short term forecasts for widespread heavy rainfall across the Southeast preclude short term drought development, and convective thunderstorm activity should continue to ease lingering drought across southern Louisiana and Florida.
No drought is currently depicted across Alaska, and drought is not anticipated to develop through the end of September. In contrast, El Niño conditions generally favor suppressed rainfall across Hawaii, favoring widespread drought development. While the Caribbean region typically experiences subnormal rainfall during El Niño summers, dynamical model forecasts and the NMME favor enhanced precipitation for the islands along the northern rim of the Caribbean Sea. Therefore, drought removal is favored for northern Puerto Rico.
Looking out Four Seasons.
Twelve Temperature Maps. These are overlapping three-month maps (larger versions of these and other maps can be accessed HERE)
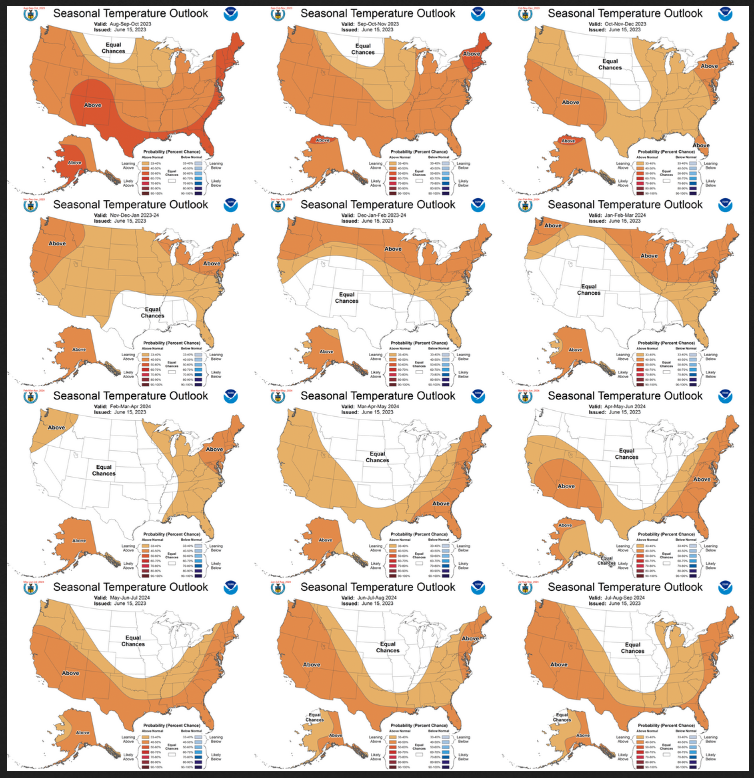
Notice that this presentation starts with August/September/October 2023 (ASO) since JAS is considered the near-term and is covered earlier in the presentation. The changes over time are generally discussed in the discussion but you can see the changes easier in the maps.
Comparing the new outlook with the prior Outlook,
The 12 temperature maps issued last month.
The easiest way to do the comparison is to print out both maps. If you have a color printer that is great but not needed. What I do is number the images from last month 1 – 12 starting with “1” and going left to right and then dropping down one row. Then for the new set of images, I number them 2 – 13. That is because one image from last month in the upper left is now discarded and a new image on the lower right is added. Once you get used to it, it is not difficult. In theory, the changes are discussed in the NOAA discussion but I usually find more changes. It is not necessarily important. I try to identify the changes but believe it would make this article overly long to enumerate them. The information is here for anyone who wishes to examine the changes. I comment below on some of the changes from the prior report by NOAA and important changes over time in the pattern.
| The only major change I saw was in the DJF 2023/2024 and JFM 2024 Temperature Outlooks. It is an interesting change in which the area that is not warmer than climatology is expanded. It is not surprising that NOAA has added more El Nino to the forecast this month as they gain confidence in the forecast for El Nino. |
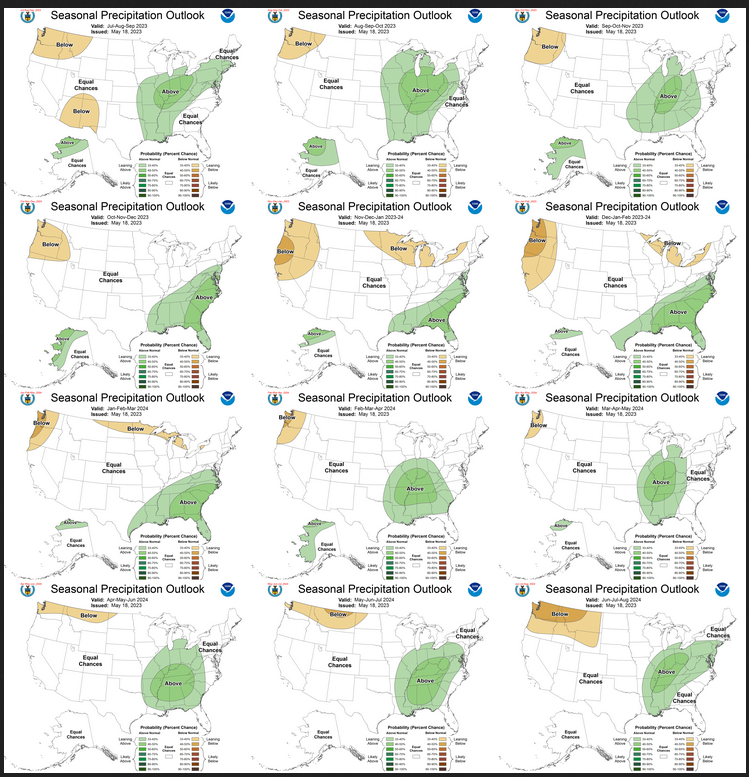
Now the Twelve New Precipitation Maps
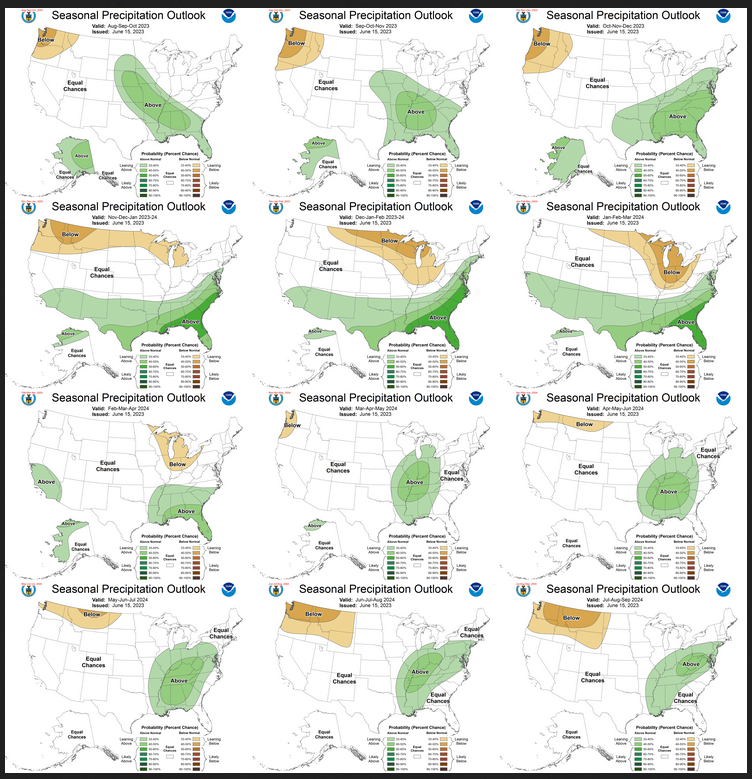
Similar to Temperature in terms of the organization of the twelve overlapping three-month outlooks.
Comparing the new outlook with the prior Outlook,
The maps that were released last month.
A good approach for doing this comparison is provided with the temperature discussion.
| Last month I was surprised that there were no major changes between the April and the May predictions. I assumed that such changes would happen this month and they did mostly for NDJ 2023/2024 through JFM 2024. They added more El Nino to the Outlooks. |
NOAA Discussion
Maps tell a story but to really understand what is going you need to read the discussion. I combine the 30-day discussion with the long-term discussion and rearrange it a bit and add a few additional titles (where they are not all caps the titles are my additions). Readers may also wish to take a look at the article we published last week on the NOAA ENSO forecast. That can be accessed here.
I will use bold type to highlight some things that are especially important. My comments, if any, are enclosed in brackets [ ].
CURRENT ATMOSPHERIC AND OCEANIC CONDITIONS
Oceanic and atmospheric observations across the equatorial Pacific reflect El Niño conditions. The observed weekly SSTs, centered on June 7, feature positive anomalies throughout the equatorial Pacific with the largest anomalies of more than +1 degree C generally east of 140°W. The latest weekly SST departure for the Niño 3.4 region is at +0.9 degrees C. Equatorial upper-ocean heat anomalies (averaged between 180 to 100 °W and 0-300m depth) remain strongly positive. From May 13 to June 7, low-level (850-hPa) westerly wind anomalies were observed across the western equatorial Pacific. Consistent with El Niño conditions, negative OLR anomalies (enhanced convection) were located east of Papua New Guinea and also near the equator across the eastern Pacific. Positive OLR anomalies (suppressed convection) were observed throughout much of Southeast Asia and Indonesia.
Although the Real-time Multivariate (RMM) index depicts a weak Madden-Julian Oscillation (MJO) propagating east from the Indian Ocean to the Maritime Continent during early June, the 200-hPa velocity potential field features a coherent and more robust MJO. Dynamical model forecasts indicate that the MJO is likely to continue propagating east to the Western Hemisphere by late June. The MJO is likely to constructively interfere with El Niño during the latter half of June and is expected to provide an increasingly favorable large-scale environment for tropical cyclone development across the East Pacific from late June into the beginning of July. However, the MJO was not a factor in the seasonal outlooks.
Negative SST anomalies have persisted across the eastern Bering Sea since the beginning of May, while SSTs are near average along much of the West Coast. The northern Gulf of Mexico cooled recently with near or below-normal SSTs observed during early June. Positive SST anomalies strengthened across the eastern tropical Atlantic since May.
PROGNOSTIC DISCUSSION OF SST FORECASTS
The CPC SST Consolidation for the Niño 3.4 region indicates an increase in the magnitude of positive anomalies this summer and fall to around +1 degree C, followed by a decline to more neutral ENSO conditions during spring 2024. The CFSv2 depicts a strong El Niño by ASO, while the North American Multi-Model Ensemble (NMME) keeps the anomalies below 1.5 degrees C. The statistical tools vary with the strength of the El Niño during the next six months. As of early June, NOAA’s CPC forecast calls for more than a 90 percent chance of El Niño persisting through JFM 2024 with a 56 percent chance of a strong El Niño (> 1.5 degrees C) during NDJ 2023.
30-DAY OUTLOOK DISCUSSION FOR JULY 2023
The July 2023 temperature and precipitation outlooks are based on the North American Multi-Model Ensemble (NMME), CPC’s statistical tools, consolidations of those inputs, the Copernicus (C3S) model systems data for July, the week 3-4 model solutions, and antecedent soil moisture conditions. An El Niño advisory was recently issued, though the ocean-atmosphere coupling is not yet strong enough to contribute majorly to the variability over Alaska and the Contiguous United States (CONUS) during July. The Madden-Julian Oscillation (MJO) remains active with its enhanced phase over the Maritime Continent. The MJO is forecast to weaken by many of the global models. Typically in July, the main pathway of MJO related influence on the mid-latitude circulation pattern is through modulation of tropical cyclone activity. An MJO contributing to a relative burst in East Pacific tropical cyclone activity could result in moisture surges into the Southwest, and later more tropical cyclone activity in the Atlantic, though July is relatively a quiet time of year for tropical activity in the Atlantic.
Temperature
Above normal temperatures are favored from the Four Corners region, across the central and southern Great Plains, the Southeast, and the Northeast. The highest odds are across the Rio Grande Valley and the Northeast, where NMME and statistical tool outputs are aligned. From Southern California to the Great Basin, Northern Rockies and portions of the northern Great Plains, the NMME and C3S solutions were much cooler than the statistical tools, and recent soil moisture conditions are quite anomalous in those regions, so uncertainty is higher there compared to other parts of the forecast domain. Trends (Optimal Climate Normals) in those regions also show patterns opposite of many other tools, so OCN are discounted in favor of Equal Chances of above, near, and below Normal Temperatures (EC). Across Alaska, most modeling systems and statistical tools favored above normal temperatures, with the highest odds across the southern portions of Mainland Alaska. Recent below-normal sea surface temperatures (SSTs) and late season sea ice breakup mitigate odds near the west coast of Alaska.
Precipitation
A weakened monsoon during July across eastern Arizona and New Mexico is predicted in many of the NMME input systems and some of the statistical tools, so that signal makes it into the final consolidation. Again, trends are showing opposite signals across the Great Basin and portions of the Rockies, so forecast probabilities are a bit muted, and the trends are largely discounted. NMME output favors above-normal precipitation across the Rio Grande while statistical tools have a signal further east, so the official outlook is a compromise between those two. Upper-level height anomalies from the NMME imply a strong subtropical ridge, which would favor above-normal precipitation from the southern Great Plains northward and into the Mid-Atlantic. The mid-latitude portion of the NMME signal would also favor a storm track across the northern Great Plains and into the Ohio River valley, so above-normal precipitation is favored across those two regions. The NMME has strong signals for below-normal precipitation across Northern Mainland Alaska, with a weak storm track further south. Many of the statistical tools have low skill during July in Alaska, and the coupling to the tropics is not influential in Alaska during the summer, so the NMME had a larger influence on the outlook.
SUMMARY OF THE OUTLOOK FOR NON-TECHNICAL USERS (Focus on July, August and September)
El Niño conditions are present and equatorial sea surface temperatures (SSTs) are above average across the central and eastern equatorial Pacific Ocean. El Niño is expected to strengthen and persist through the winter 2023-24.
Temperature
The July-August-September (JAS) 2023 temperature outlook favors above-normal seasonal mean temperatures across a majority of the U.S. The highest probabilities (more than 50 percent) of above-normal temperatures are forecast across parts of California, the Pacific Northwest, Great Basin, Southwest, Gulf Coast, and East.
Precipitation
The JAS precipitation outlook depicts elevated probabilities of below-normal precipitation for parts of the Southwest, Pacific Northwest, and Great Lakes, while above-normal precipitation is favored across much of the Great Plains, parts of the Middle to Lower Mississippi Valley, Northern Rockies, and Florida Peninsula. Equal chances (EC) are forecast in areas where the likelihood of seasonal mean temperatures or seasonal accumulated precipitation amounts are expected to be similar to climatological probabilities.
BASIS AND SUMMARY OF THE CURRENT LONG-LEAD OUTLOOKS
PROGNOSTIC TOOLS USED FOR U.S. TEMPERATURE AND PRECIPITATION OUTLOOKS
Tools used for the seasonal outlooks included dynamical model guidance such as the NMME, the Calibration, Bridging, and Merging (CBaM) post-processing of the NMME, and the Copernicus Climate Change Service (C3S) seasonal model contributions. In addition, the consolidation tool, which includes NMME input and various statistical tools, was used. Current soil moisture conditions were a consideration across the Midwest and Corn Belt in the JAS temperature outlook. El Niño temperature and precipitation composites were relied upon from JAS 2023 through JFM 2024 and these composites were weighed most heavily from NDJ 2023-24 through JFM 2024. Decadal trends in temperature and precipitation were a factor at all time leads but relied upon the most, beginning in the spring 2024.
PROGNOSTIC DISCUSSION OF OUTLOOKS – JAS 2023 through JAS 2024
TEMPERATURE
Above-normal temperatures are favored throughout a majority of the U.S. during JAS with the highest probabilities (above 50 percent) forecast for much of the West, Gulf Coast, and East, consistent with dynamical model guidance and decadal trends . Although the July outlook depicts equal chances (EC) of below, near, or above-normal temperatures for the interior West, the enhanced probabilities (greater than 50 percent) for this region during JAS are justified for a three-month period with support from the consolidation tool and decadal trends . Based on the CBaM and an expectation of a weak monsoon, probabilities for above-normal temperatures exceed 60 percent across Arizona. Compared to the previous outlook, above-normal temperature probabilities were increased across the Corn Belt and Great Lakes due to a notable warming trend in the NMME from last month along with low soil moisture heading into July. Based on the latest NMME, lower probabilities (33 to 40 percent) are forecast for coastal central to southern California. EC is forecast across the north-central CONUS where large differences exist among the NMME, CBaM, and El Niño composites. The consolidation tool and El Niño composites support increased above-normal temperature probabilities across much of Alaska, although EC is forecast for Northern Mainland Alaska where the warm signal is weaker among the statistical tools. Above-normal temperatures remain the most likely outcome throughout much of the U.S. from ASO to OND 2023. Beginning in NDJ 2023-24 through JFM 2024, predicted El Niño conditions result in enhanced chances for above-normal temperatures across the northern tier of the CONUS with an increasing coverage of EC across California, the Southwest, Southern Great Plains, and Lower Mississippi Valley. During the winter 2023-24, above-normal temperatures are favored across the East based on the statistical consolidation. During the spring and summer 2024, the temperature outlook is consistent with decadal trends .
PRECIPITATION
Following this past winter and spring with above-normal snowfall across the West and current soil moisture above the 70th percentile, a sluggish start to the monsoon is likely for the Southwest during July. Based on good model continuity and agreement, forecast confidence is relatively high for a weak monsoon and therefore, below-normal precipitation is favored across the Southwest during JAS. Consistent with a predicted weaker Monsoon and supported by the NMME and El Niño composites, elevated chances for above-normal precipitation are forecast for much of the Great Plains extending west to the Northern Rockies. Given the strong dry signal apparent among the statistical tools across Ontario and bordering Great Lakes, the JAS outlook leans towards below-normal precipitation across most of Michigan and northeastern Wisconsin. Based on the latest NMME, slightly elevated probabilities for above-normal precipitation are forecast across the Florida Peninsula. Although recent dynamical model output backed off on the dry signal across the Pacific Northwest, statistical tools support a continuation of favored below-normal precipitation for parts of Oregon and Washington. Also, this is consistent with an increasing dry signal, associated with El Niño, during the fall season. Although decadal trends support above-normal precipitation for the Mid-Atlantic during JAS, EC is forecast for this region due to the drier El Niño composites and the absence of a wet signal in the NMME. Given inconsistent model output the past two months and conflicting signals among the tools, EC is also forecast for much of Alaska during JAS. However, below-normal precipitation is slightly favored for parts of western Mainland Alaska based on the NMME. Precipitation outlooks during the fall 2023 through the winter 2023-24 relied upon El Niño composites and the consolidation tool with an increased chance of above (below)-normal precipitation across the southern (northern) tier of the CONUS. The largest probabilities (50 percent for above) are forecast across parts of the Southeast from NDJ 2023-24 through JFM 2024 based on a strong, reliable wet signal associated with El Niño. During the spring and summer 2023, the precipitation outlooks are based mostly on decadal trends.
Review of the ENSO Assumptions utilized by NOAA (CPC) in Preparing this Four-Season Outlook
It is useful to review the ENSO forecasts used by NOAA to produce this Four-Season Outlook.
We did not report on that last week. I did not receive the notice from NOAA. But that is no excuse since I know that report is issued on the second Thursday of the month. Here is the discussion from the NOAA Climate Prediction Center:
The key information used by NOAA follows.
IRI CPC ENSO STATE Probability Distribution (IRI stands for the International Research Institute for Climate and Society)
Here are the new forecast probabilities. This information is released twice a month and the first release is based on a survey of Meteorologists, the second is based on model results. The probabilities are for three-month periods e.g. MAM stands for March/April/May. I am just showing the first release which is what we have and presumably what NOAA (actually their CPC Division) worked from.
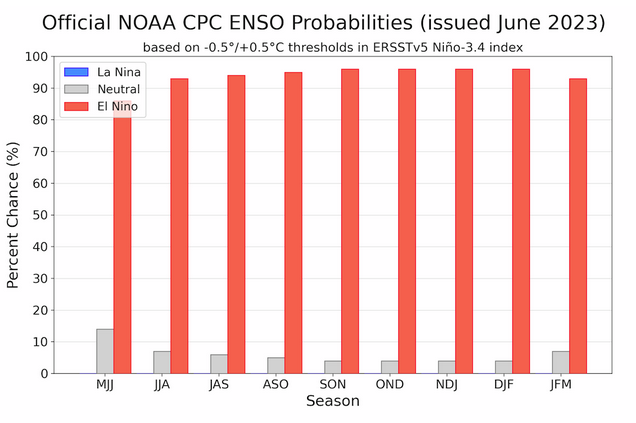
| It looks like El Nino through the forecast period. |
Tropical Subsurface Temperature Anomalies
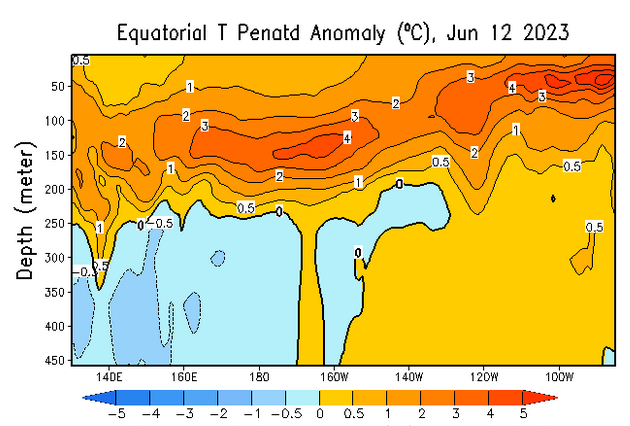
| You can update this graphic by clicking HERE and scrolling down to “Mean and anomalous equatorial temperatures“. One has to differentiate between the surface and at depth. Last month the surface still fit with ENSO Neutral but below the surface, there was a lot of anomalously warm water. Now the ocean clearly is consistent with El Nino and based on the new NOAA CPC Division Advisory, the atmosphere has confirmed that we are in El Nino. That is why this looks like a very sustainable El Nino. |

| The image will update if you click HERE. This model is predicting a fairly strong El Nino lasting a while. |
Resources
–
| I hope you found this article interesting and useful. |
–

