Two studies have been performed on the correlations between U.S. Federal Deficit Spending and CPI Inflation. The first used federal deficits for fiscal years between 1914 and 2022. The second study used the quarterly data available for federal deficit spending starting in 1966. This article is the second to compare the results of the two studies.

Photo by Adi Goldstein on Unsplash
Introduction
In these studies, the inflation time series has periods of inflationary surges, deflationary surges, and years when inflation/disinflation/deflation have trends with <4% change uninterrupted by countertrend moves >1.5%. However, the data organizations were different for each of the two studies.
In the first study, annual inflation was used to determine periods of inflation and deflationary surges. In the second study, inflation was examined quarterly. This led to different definitions of inflation and disinflation periods. These differences may or may not have produced different conclusions about the associations between deficit spending and inflation. These differences are examined here for the years 1966 through 2022. Quarterly deficit spending data is not available before 1966.
In a previous article,1 we analyzed data for inflationary surges. Here, we analyze the data for deflationary surges and periods with no surges.
Data
Annualized Inflation
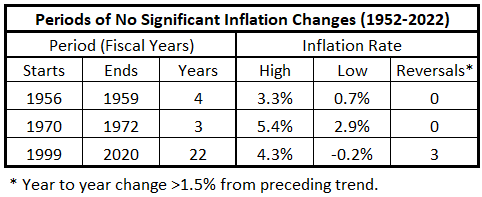
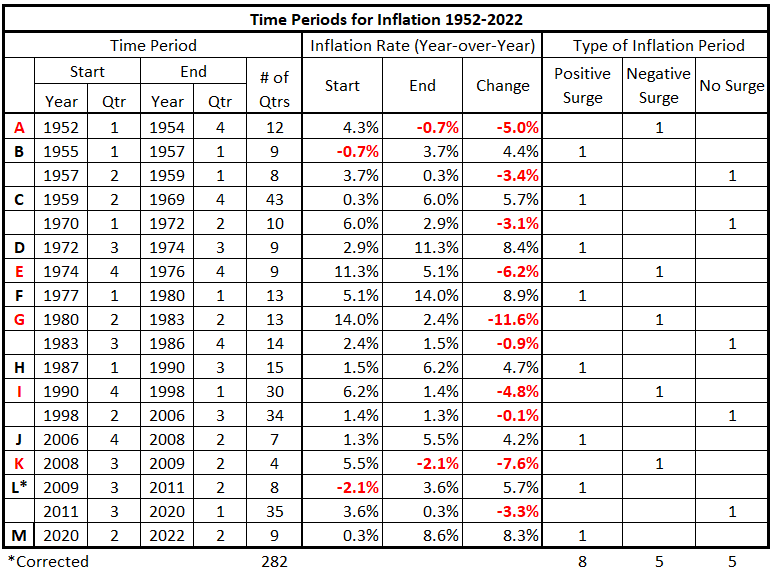
Inflationary period definitions were made in the original federal deficit spending and consumer inflation study.2 The three types of inflationary periods (inflationary surges, disinflationary surges, and no surges) from 1952 to 2022 are in Tables 1-3. For the definition of the various periods, see “Government Spending and Inflation: Reprise and Summary”.2
Table 1. Periods of Significant Increases of Inflation 1952-2022
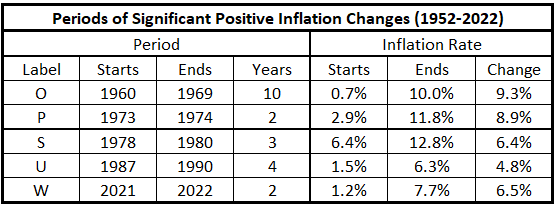
Table 2. Periods of Significant Decreases of Inflation 1952-2022
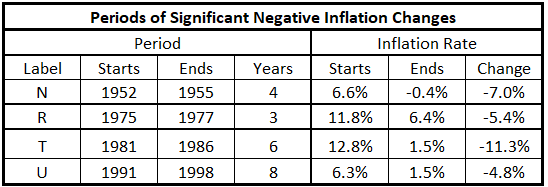
Table 3. Periods without Significant Inflation Trends 1952-2022
The previous work,2 using annual data, produced the inflation time series graph shown in Figure 1.
Figure 1. CPI Annual Inflation 1914-2022 with Significant Changes in Inflation Noted
(Each letter identifies the end of a significant move.)
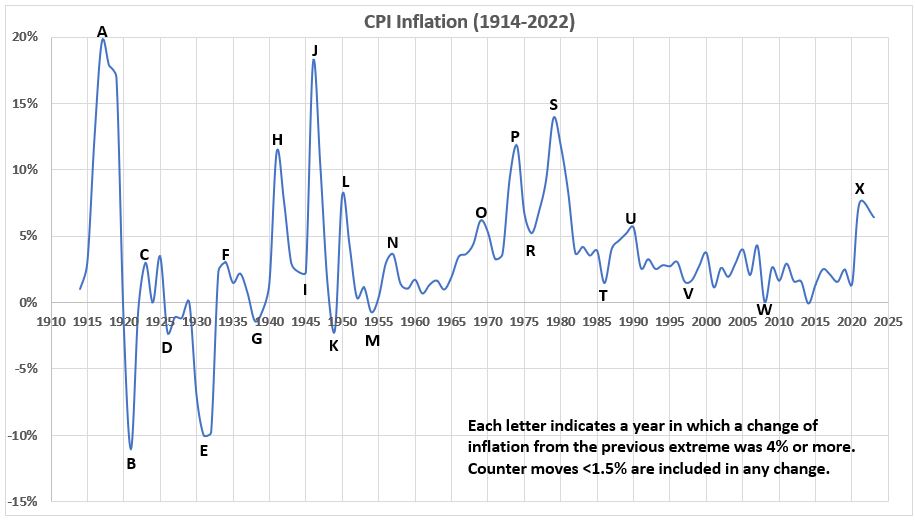
The data in Figure 1 produced Tables 1-3.
Inflation Measured Quarterly
Figure 2 shows the rolling four-quarter inflation using quarterly data. This results in four times as many data points for 12 months of inflation over the same 109 years.
Figure 2. CPI Rolling Four Quarter Inflation 1914-2022
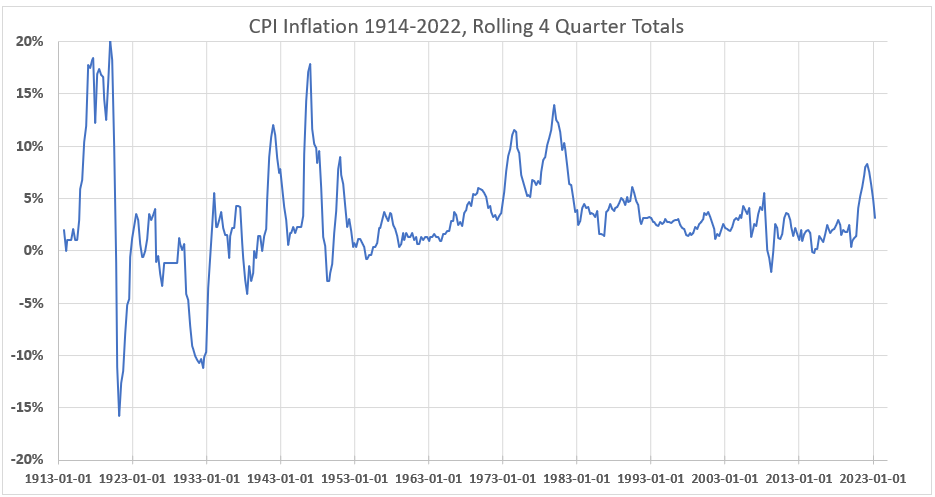
There is much more structure in Figure 2 than in Figure 1. This may reflect noise in the Figure 2 data or be real information. The only area where this question may have importance could be the three peaks from 3Q 1917 to 1Q 1920. In Figure 1, this time period shows only a single peak with a shoulder approaching 1920. Addressing this question has no bearing on the current study, which covers the 71 years 1952-2022.
Figure 3 displays the inflation data for the study period 1952-2022.
Figure 3. CPI Rolling Four Quarter Inflation 1952-2022 with Significant Changes in Inflation Noted
(Each letter identifies the end of a significant move. An * identifies the end of an insignificant time period.)

A summary of the data in Figure 3 is in Table 4.
Table 4. Timeline of Inflation Data 1952-2022
Periods of Inflation Behavior for the Two Data Organizations
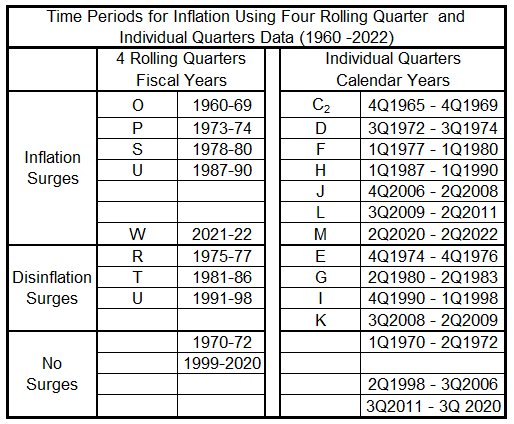
Table 5 shows the comparisons for Tables 1, 2, and 3 with the data in Table 4. Except for 1987-90, one-to-one correspondence for periods of various inflation behaviors does not exist for the two data organizations (annual deficit data and quarterly deficit data).
Table 5. Inflation Periods – Two Data Organizations (1960-2022)
Analysis
Disinflation Surges and No Surges
This analysis uses previously determined timeline displacement correlations between federal deficit spending (FDS) and consumer price inflation (CPI). The timeline displacements are
- Federal Deficit Spending and CPI Inflation quarters are coincident.
- Federal Deficit Spending leads and lags CPI Inflation by one quarter (±3 months)
- Federal Deficit Spending leads and lags CPI Inflation by two quarters (±6 months)
- Federal Deficit Spending leads and lags CPI Inflation by three quarters (±9 months)
- Federal Deficit Spending leads and lags CPI Inflation by four quarters (±12 months)
- Federal Deficit Spending leads and lags CPI Inflation by six quarters (±18 months)
- Federal Deficit Spending leads and lags CPI Inflation by eight quarters (±24 months)
The analysis that produced the graphs below for annual deficit spending over fiscal years is here.3,4
Disinflation Surges
The 1970s
The time overlap between the two data sets for the 1970s is more than 2/3 of each period. The fiscal year data is 13 quarters, with the last 9 quarters (4Q 74 – 4Q 76, adjusted one quarter to align with the calendar) overlapping the 9 quarters of the quarterly data.
Figure 4. Correlation of FDS and CPI, Fiscal Years (1975-77)
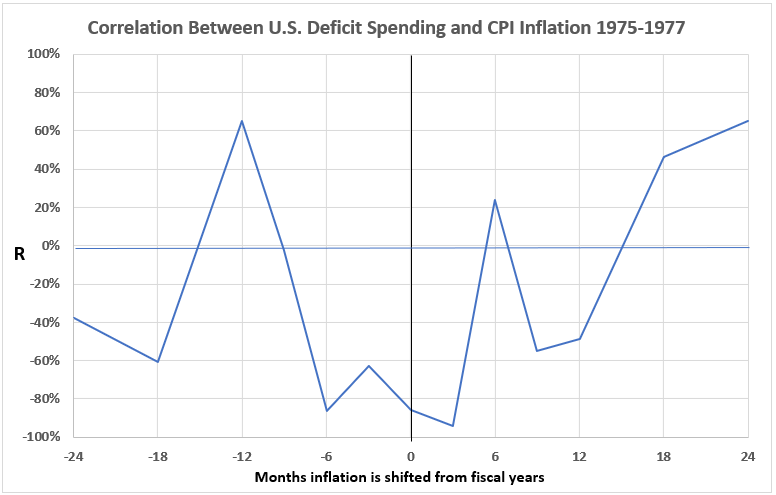
Figure 5. Correlations of Quarterly FDS and CPI, Calendar Years (1974-76)
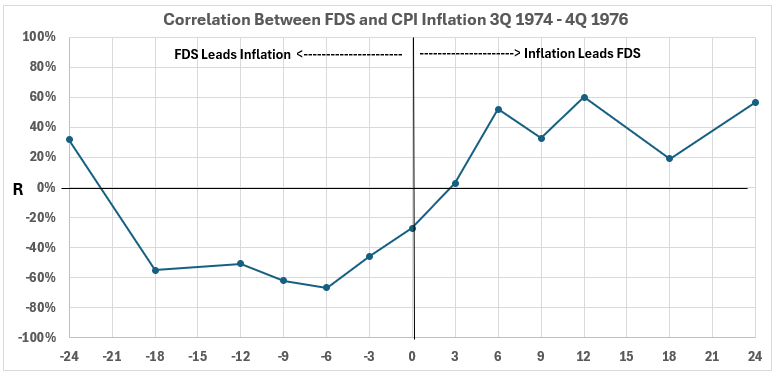
There is much more volatility in Figure 4 than in Figure 5. This is disconcerting since there are 13 quarters of CPI data in Figure 4 and only 9 quarters in Figure 5. It is tempting to say that the consistency in Figure 5 makes it more credible than Figure 4. However, that would be speculation.
Both Figure 4 and Figure 5 show negative associations when Federal spending comes before inflation. Only the -12 months data point on the left side of Figure 4 has a moderately positive correlation (R = 62% and R2 = 38%); all 11 other data points are slightly positive, negligible, moderately negative, or strongly negative across the left side of both graphs. The interpretation is there is little to support that changes in FDS during this period are positively associated with subsequent changes in inflation: there is limited support for increasing FDS possibly causing increasing inflation or decreasing FDS possibly causing decreasing inflation.
The right side of Figure 5 shows a slight to moderate positive association between changes in inflation and subsequent changes in federal deficit spending. This would indicate changes in inflation might cause subsequent changes in deficit spending in the same direction. Up to ~35% of the change in deficit spending was possibly caused by preceding changes in inflation in the same direction. The right side of Figure 4 does not support this conclusion.
Note: The two words might and possible are emphasized because correlation is not proof of causation. The values of R2 define the limit of possible causation. A different statement of this result is that 65% or more of the change in FDS is caused by something other than CPI inflation.
The 1980s
Figure 6. Correlation of FDS and CPI, Fiscal Years (1981-86)

Figure 7. Correlations of Quarterly FDS and CPI, Calendar Years (1980-83)
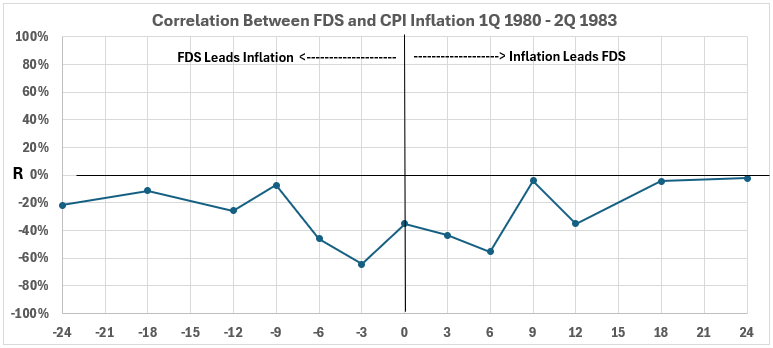
The fiscal year and quarterly data sets for federal deficit spending in the two 1980 periods show no positive associations for FDS timelines leading CPI. The interpretation: it is impossible for increasing FDS to have caused increasing inflation, and vice versa, during the early 1980s.
Note the use of emphasis. Correlation does not prove causation. It only indicates causation is possible.
The 1990s
Figure 8. Correlation of FDS and CPI, Fiscal Years (1991-98)
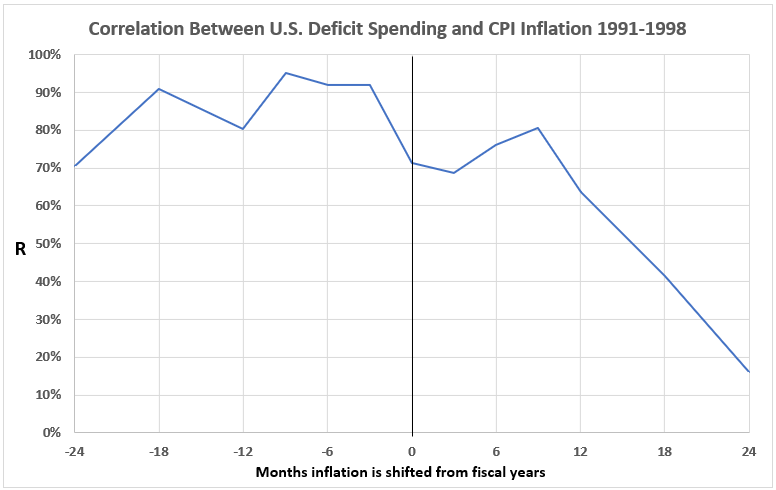
Figure 9. Correlations of Quarterly FDS and CPI, Calendar Years (1990-98)
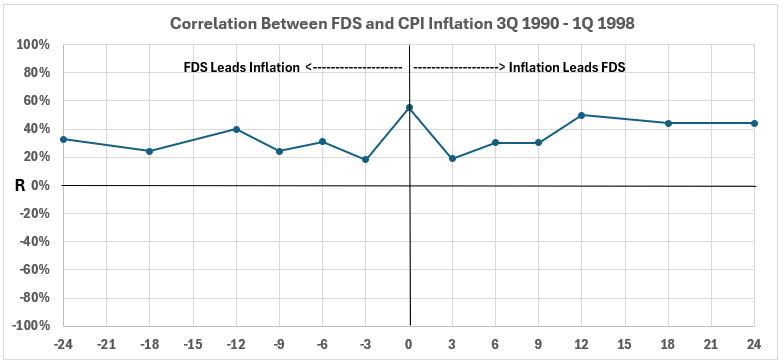
The periods for Figures 8 and 9 are nearly completely overlapped. Only the first quarter of the period in Figure 9 does not overlap the period of Figure 8 once the fiscal year calendar is adjusted to the calendar year.
Figures 8 and 9 show positive associations between FDS and CPI across the board. The left side of Figure 8 shows decidedly stronger correlations than Figure 9. The 1990s data indicates that during that decade, changes in deficit spending may have caused subsequent changes in consumer inflation in the same direction and vice versa.
No Surges
The 1970s
Figure 10. Correlation of FDS and CPI, Fiscal Years (1970-72)
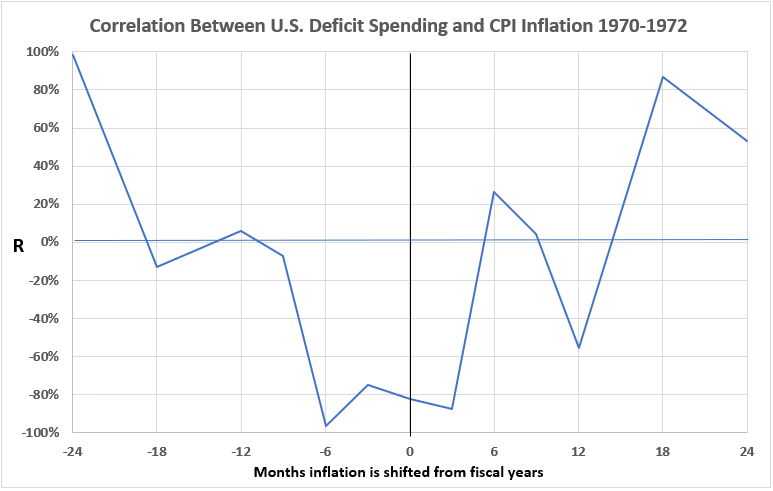
Figure 11. Correlations of Quarterly FDS and CPI, Calendar Years (1970-72)

There is a strong overlap between the periods measured in fiscal years and calendar year quarters.
Most data points in Figures 10 and 11 show slightly positive associations (R2 < 6%) and negligible or negative associations. The exceptions are -24 months in Figure 10 and +18 months in both graphs. Of these exceptions, the two +18 data points are notable. Because they occurred in both data organizations, it could indicate that a change in inflation might have caused a delayed change in the same direction for subsequent federal deficit spending in the early 1970s.
The 21st Century
Using fiscal years’ deficit spending data, the period over two decades at the start of the current century yielded a single span with no inflation years. The quarterly FDS data found two long periods with no surges: 1998-2006 and 2011-20. Between 2007 and 2010, the years contained two positive and one negative inflation surges, all lasting only a short time.
Figure 12. Correlations of FDS and CPI, Fiscal Years (1999-2020)
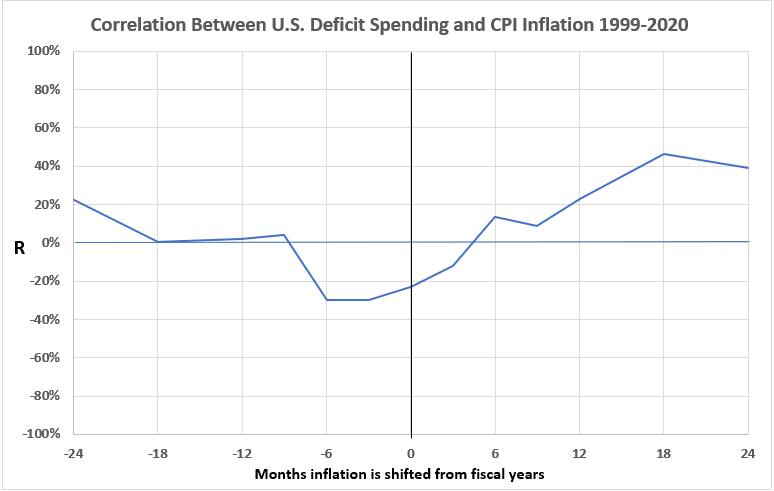
Except for CPI leading FDS by 18 months, all data points have slight positive, negligible, and negative associations. For CPI leading FDS by 18 months, R2~ 19%: Increased consumer inflation might have contributed up to 19% of increased federal deficit spending. All other data points indicate that higher federal deficit sending did not cause increased CPI inflation and vice versa.
Figure 13. Correlations of Quarterly FDS and CPI, Calendar Years (1998-2006)
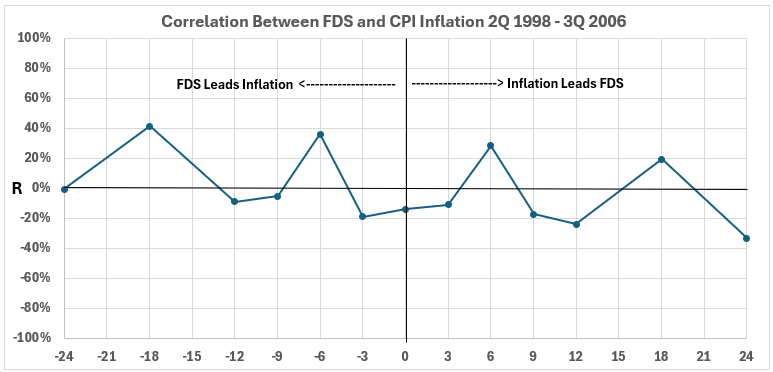
Figure 14. Correlations of Quarterly FDS and CPI, Calendar Years (2011-20)

The associations shown in Figures 13 and 14 are similar to those in Figure 12. For Figure 13, the largest value of R produces an R2 value of ~16% for FDS coming before inflation. The largest R2 value on the left is ~11% in Figure 14. This indicates that for the first two decades of the 21st century, 81% or more of inflation was caused by something other than federal deficit spending when Figures 12, 13, and 14 are considered together.
Conclusion
For periods with positive inflation surges, the correlation between annual U.S. federal deficit spending (FDS) and CPI inflation is not substantially different from the analysis done with quarterly deficit spending changes, with two exceptions:
- The quarterly data show a significant association between inflation and subsequent deficit spending during the inflation surge of 1972-74.
- The quarterly data show more clearly a moderate association between inflation and subsequent deficit spending during the disinflation surge of 1974-76.
Both data organizations show limited evidence for the possibility that increased FDS could have produced increased CPI or decreased FDS produced decreased CPI over the years 1966-2022.
The data indicate that increased/decreased CPI might have caused increased/decreased FDS only in two periods (1972-74 and 1974-76). However, correlation by itself cannot prove causation.
Next week, we will examine how the total money supply is associated with inflation.
Footnotes
1. Lounsbury, John, “Comparing Two Data Organizations for Federal Deficit Spending vs Inflation. Part 1,” EconCurrents, May 5, 2024. https://econcurrents.com/2024/05/05/comparing-two-data-organizations-for-federal-deficit-spending-vs-inflation-part1/
2. Lounsbury, John, “Government Spending and Inflation. Reprise and Summary,” EconCurrents, August 20, 2023. https://econcurrents.com/2023/08/20/government-spending-and-inflation-reprise-and-summary/.
3. Lounsbury, John, “Government Spending and Inflation. Part 14B – Deflation”, EconCurrents, July 9, 2023. https://econcurrents.com/2023/07/09/government-spending-and-inflation-part-14b-deflation/.
4. Lounsbury, John, “Government Spending and Inflation. Part 15”, EconCurrents, July 23, 2023. https://econcurrents.com/2023/07/23/government-spending-and-inflation-part-15/.