On the third Thursday of the month right on schedule NOAA issued their updated Seasonal Outlook which I describe as their Four-Season Outlook because it extends a bit more than one year into the future. The information released also included the Mid-Month Outlook for the following month plus the weather and drought outlook for the next three months. I present the information issued by NOAA and try to add context to it. It is quite a challenge for NOAA to address the subsequent month, the subsequent three-month period as well as the twelve successive three-month periods for a year or a bit more.
First, Let’s Take a Look at the (mid-month) Outlook for November. It will be updated on the last day of October.
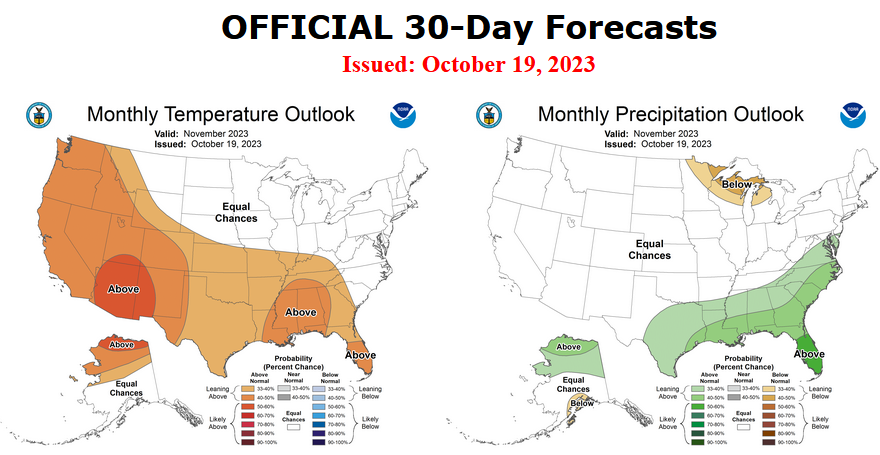
Then I present a graphic that shows both the preliminary Outlook for November and the three-month outlook for NDJ 2023-2024. So you get the full picture in one graphic. For some, that may be all they are interested in. Others will be interested in the longer-term predictions and also the rationale supporting the predictions which is mostly provided by the NOAA discussion.

The top row is what is now called the Mid-Month Outlook for next month which will be updated at the end of this month. There is a temperature map and a precipitation map. The second row is a three-month outlook that includes next month. I think the outlook maps are self-explanatory. What is important to remember is that they show deviations from the current definition of normal which is the period 1991 through 2020. So this is not a forecast of the absolute value of temperature or precipitation but the change from what is defined as normal or to use the technical term “climatology”.
| Notice that the outlook for next month and the three-month outlooks are somewhat different with respect to temperature and also to some extent precipitation. This tells us that December and January will be different than November to some extent. |

The full NOAA Seasonal Outlook extends through November/December/January of 2025. All of these maps are in the body of the article. Large maps are there for November and the three-month period Nov/Dec/Jan. Small maps are provided beyond that through January of 2025 with a link to get larger versions of these maps.
NOAA provides an excellent discussion to support the maps.[Author’s Note: many other meteorological agencies see this El Nino being stronger than NOAA does so there is more than usual uncertainty relating to the more distant months.]
Here are larger versions of the Temperature and Precipitation Outlook maps for next month.
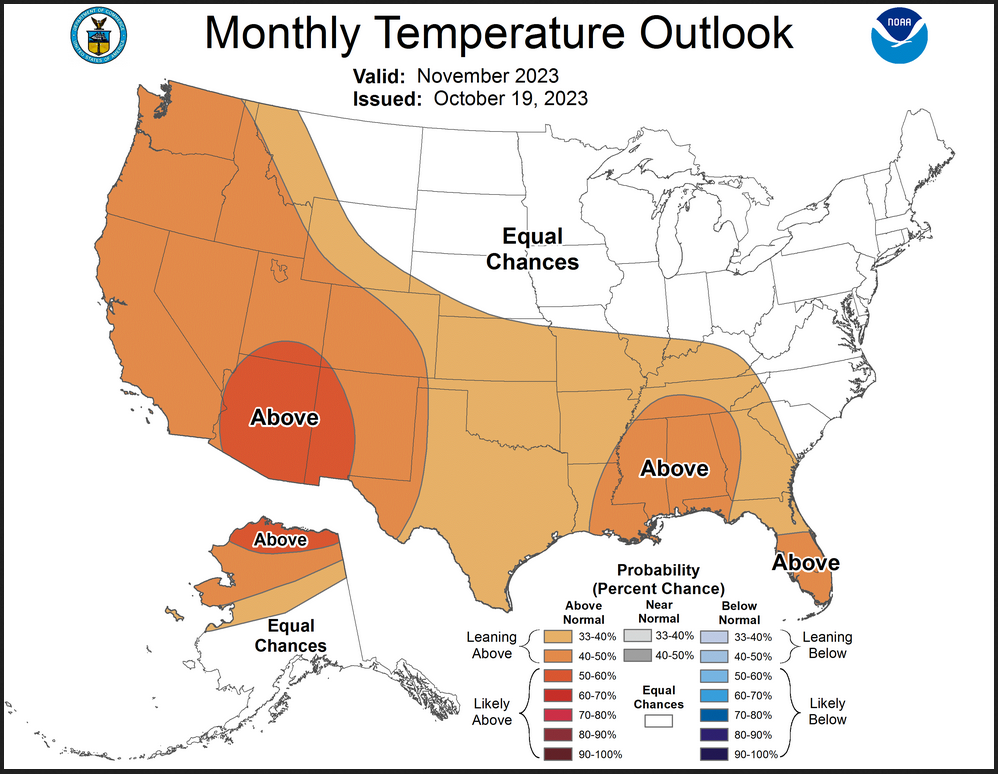
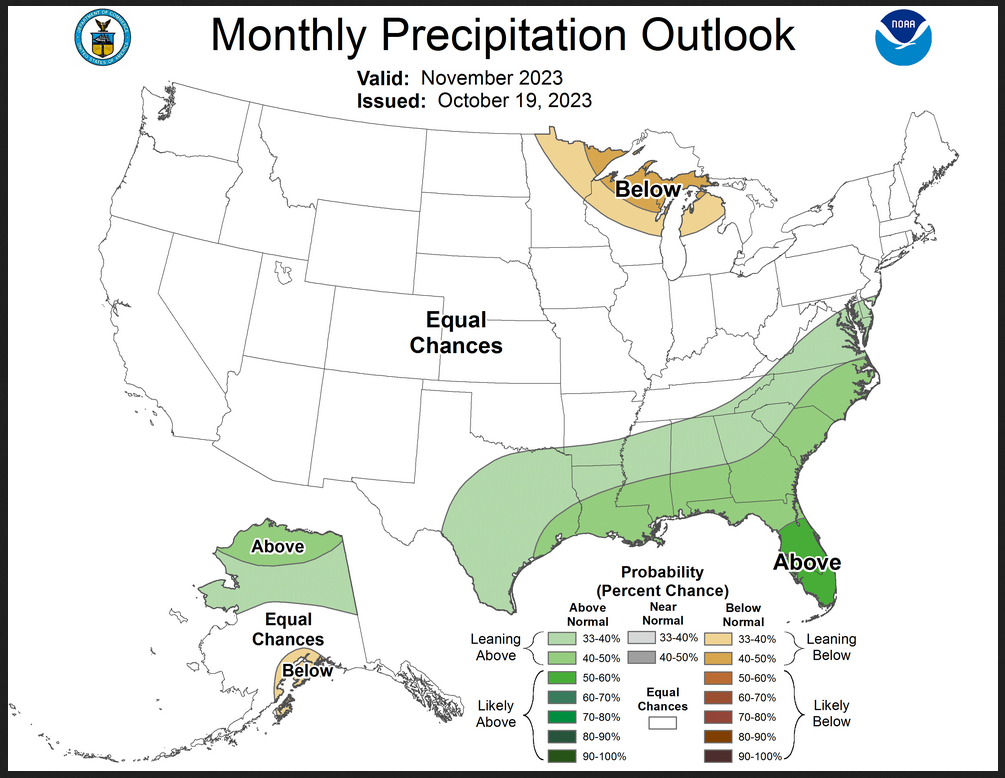
The maps are pretty clear in terms of the outlook.
And here are large versions of the three-month NDJ 2023-2024 Outlook
First temperature followed by precipitation.
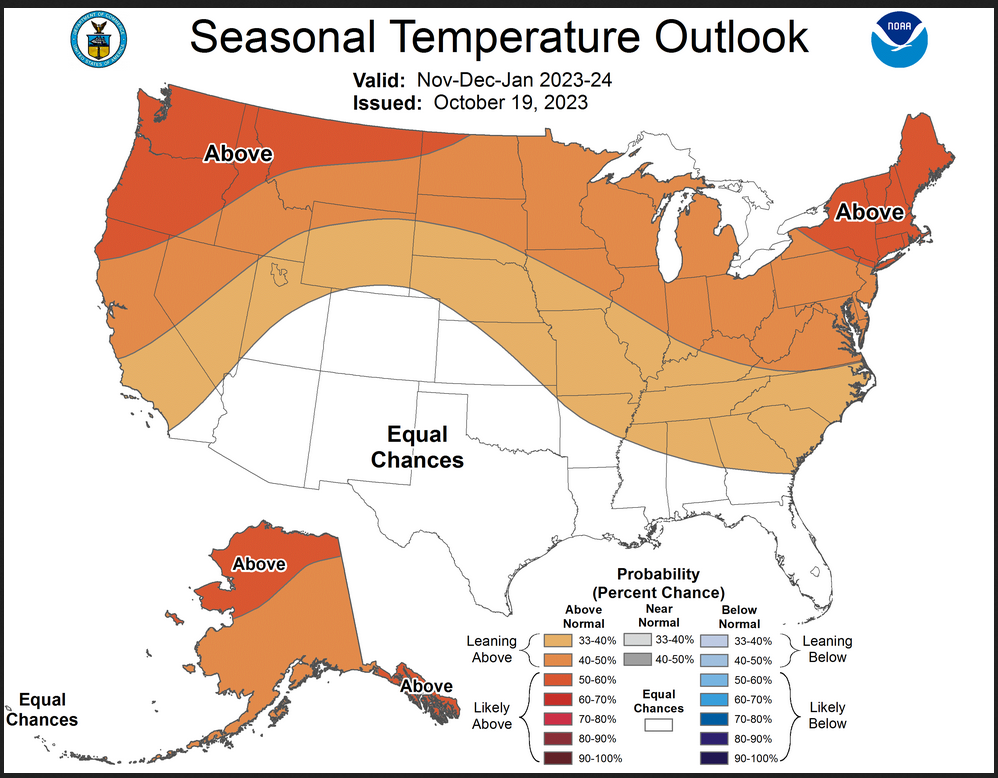
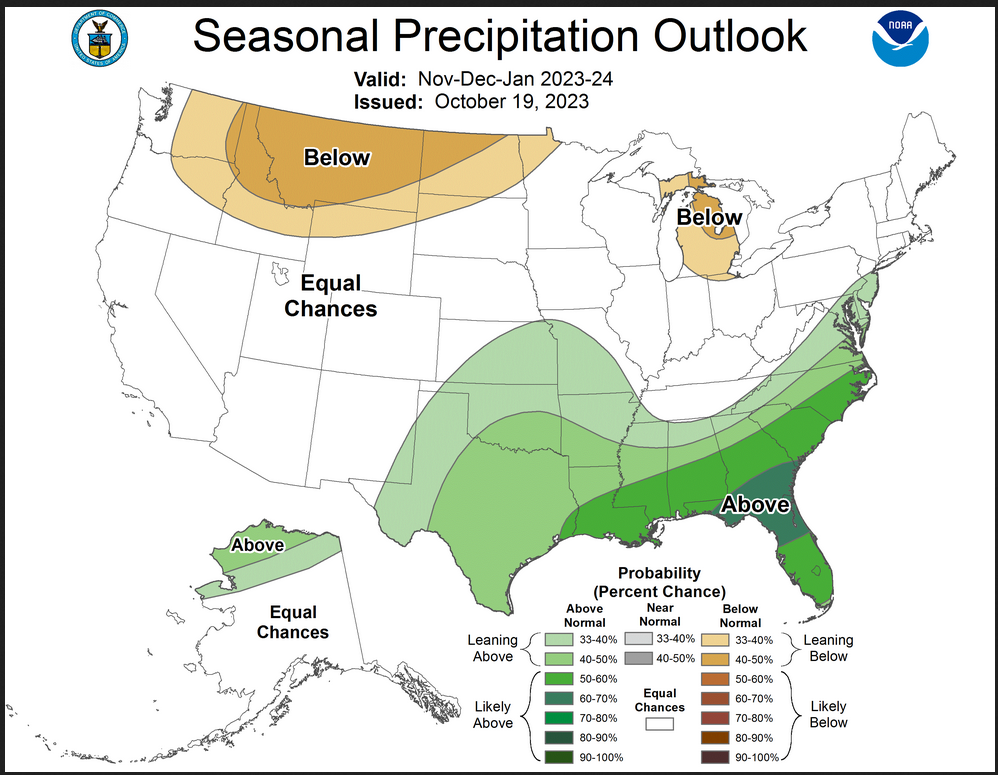
| These maps are larger versions of what was shown earlier. |
Drought Outlook
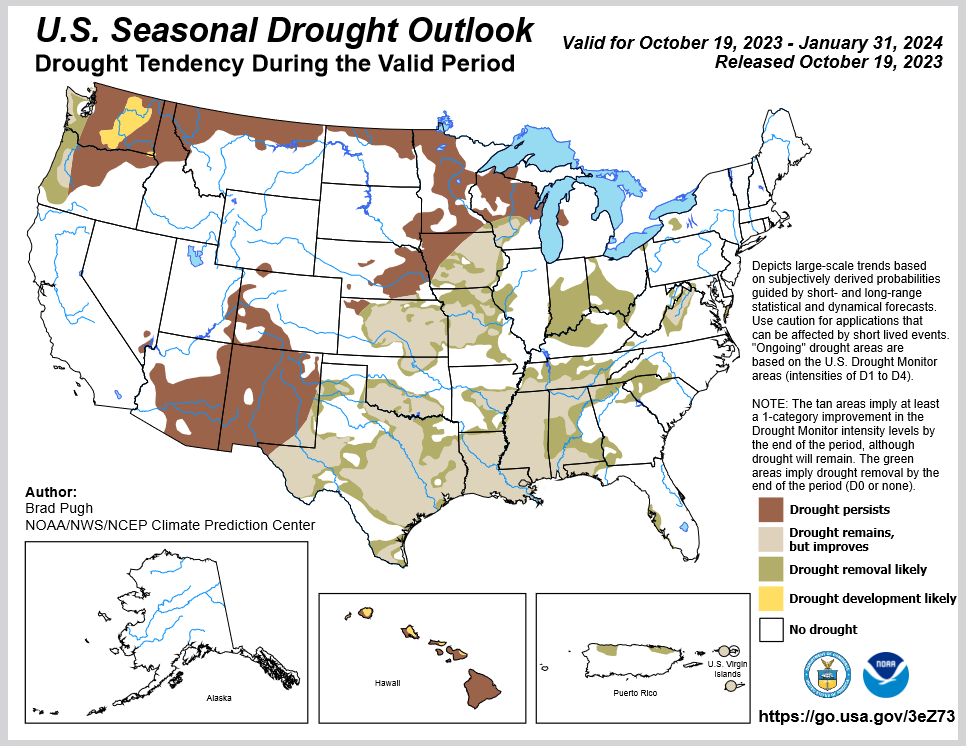
| The yellow is the bad news and there is very little of that. There is a large area where drought removal or lessening is likely to happen plus there is a large area where drought is expected to persist. Overall the level of drought is expected to decline significantly. |
Short CPC Drought Discussion
Latest Seasonal Assessment – A wet end to October, El Niño, and a favorable time of year for soil moisture recharge are likely to result in drought improvement or removal across the Southeast, Lower Mississippi Valley, Texas, and parts of the Midwest through the remainder of the fall and into the winter. Persistence is forecast for the Upper Mississippi Valley and Northern Great Plains due to a drier climatology during November-December-January. Consistent with the November-December-January precipitation outlook, persistence or development is forecast for the Northern Rockies and interior Pacific Northwest. However, a wet climatology favors improving drought across coastal Oregon and Washington. Following a suppressed 2023 Monsoon, broad-scale persistence is forecast across Arizona and much of New Mexico. El Niño favors drought persistence or development across Hawaii, while improvement or removal is forecast for Puerto Rico and the U.S. Virgin Islands.
Looking out Four Seasons.
Twelve Temperature Maps. These are overlapping three-month maps (larger versions of these and other maps can be accessed HERE)
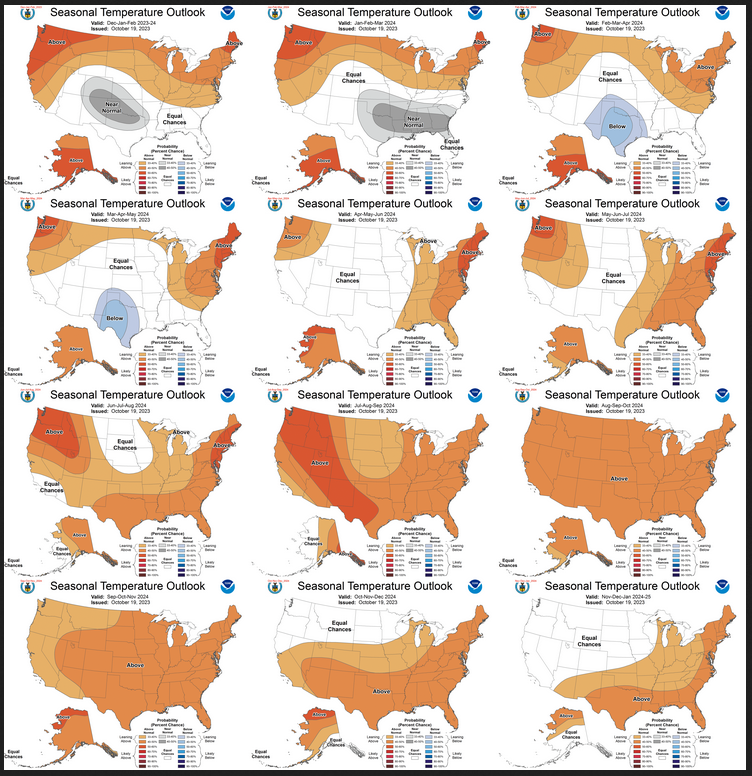
Notice that this presentation starts with November/December/January 2023/2024 (NDJ) since OND is considered the near-term and is covered earlier in the presentation. The changes over time are generally discussed in the discussion but you can see the changes easier in the maps.
Comparing the new outlook with the prior Outlook,
The 12 temperature maps issued last month.
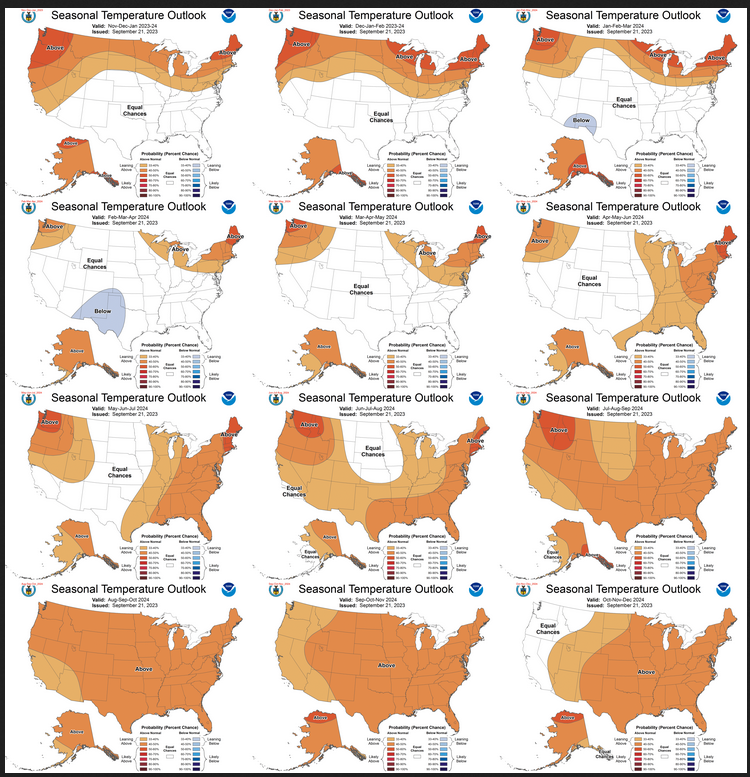
The easiest way to do the comparison is to print out both maps. If you have a color printer that is great but not needed. What I do is number the images from last month 1 – 12 starting with “1” and going left to right and then dropping down one row. Then for the new set of images, I number them 2 – 13. That is because one image from last month in the upper left is now discarded and a new image on the lower right is added. Once you get used to it, it is not difficult. In theory, the changes are discussed in the NOAA discussion but I usually find more changes. It is not necessarily important. I try to identify the changes but believe it would make this article overly long to enumerate them. The information is here for anyone who wishes to examine the changes. I comment below on some of the changes from the prior report by NOAA and important changes over time in the pattern.
| There are some changes from last month’s set of maps but nothing really significant. |
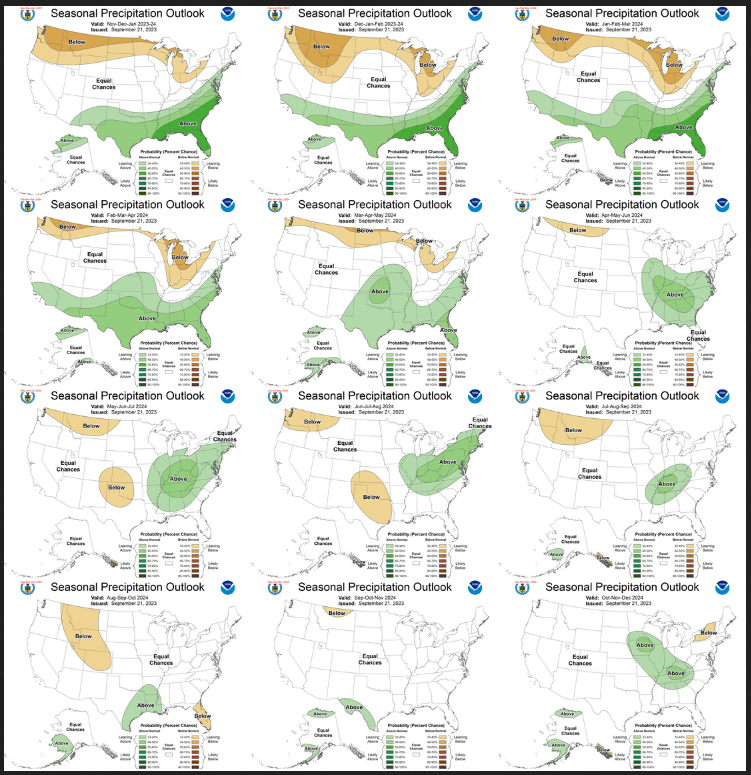
Now the Twelve New Precipitation Maps

Similar to Temperature in terms of the organization of the twelve overlapping three-month outlooks.
Comparing the new outlook with the prior Outlook,
The maps that were released last month.
A good approach for doing this comparison is provided with the temperature discussion.
| There were basically no significant changes from last month’s set of maps. |
NOAA Discussion
Maps tell a story but to really understand what is going you need to read the discussion. I combine the 30-day discussion with the long-term discussion and rearrange it a bit and add a few additional titles (where they are not all caps the titles are my additions). Readers may also wish to take a look at the article we published last week on the NOAA ENSO forecast. That can be accessed here.
I will use bold type to highlight some things that are especially important. My comments, if any, are enclosed in brackets [ ].
CURRENT ATMOSPHERIC AND OCEANIC CONDITIONS
The coupled oceanic and atmospheric observations reflect El Niño conditions. In mid October, sea surface temperatures (SSTs) are above average across nearly the entire equatorial Pacific Ocean. Positive SST anomalies greater than +2.5 degrees C are present in the eastern Pacific with anomalies generally uniform of +1 to +2 degrees C from the Date Line to the east-central Pacific. The latest weekly values for the Nino3.4 and Nino4 SST indices are +1.5 and +1.3 degrees C respectively with the latter index continuing to increase.
A strong reservoir of warmer than normal water remains observed at depth for nearly the entire Pacific basin when viewing subsurface ocean water temperatures along the equator. Largest positive oceanic heat content is located east of 140 degrees W, but substantial positive oceanic heat content remains present to a depth of at least 150 m for the majority of the remainder of the Pacific basin. The warmer than normal water at depth supports not only maintenance of this El Nino event, but the potential for some further strengthening over the next couple of months.
The atmospheric state is displaying characteristics consistent with El Nino. In areas of the central Pacific, low-level winds were anomalously westerly, while upper-level winds were anomalously easterly. Convection was enhanced around the Date Line, stretching to the eastern Pacific, just north of the equator with suppressed convection observed near Indonesia. The equatorial Southern Oscillation Index (SOI) and the traditional station-based SOI are both significantly negative.
Large areas of above-normal sea surface temperatures (SSTs) reside in both the north Pacific and north Atlantic oceans. More local coastal SSTs are above-normal for western and northern coastal waters of Alaska as well as off the California coast.
PROGNOSTIC DISCUSSION OF SST FORECASTS
The CPC Nino3.4 SST consolidation forecast shows a steady or slight increase in the Nino3.4 SST index entering late autumn and early winter 2023 at a value near or just above +1.5 degrees C. Thereafter, a gradual trend to a less positive Nino3.4 SST anomaly is depicted reaching ENSO neutral values by or near the AMJ 2024 season. Forecast spread of the consolidation members from present to the AMJ 2024 season is low.
The NMME Nino3.4 SST index forecasts are similar to that written above with generally good agreement with only the GFDL-SPEAR model forecasting considerably more strengthening of the El Nino event – peaking during DJF 2023-2024 with a value slightly above +2.0 degrees C.
30-DAY OUTLOOK DISCUSSION FOR NOVEMBER 2023
El Niño conditions are currently observed, and equatorial sea surface temperatures (SSTs) are above average across the central and eastern equatorial Pacific Ocean. The tropical Pacific atmosphere is consistent with El Niño, and as such we expect El Niño to be the dominant teleconnection for November, though impacts are generally weaker than during winter and early spring. While the Madden Julian Oscillation (MJO) showed some renewed activity recently, an incoherent MJO is favored in forecasts of the Realtime Multivariate MJO (RMM) index given destructive interference from the ongoing El Niño and an emerging positive Indian Ocean Dipole (+IOD) event. Thus, the MJO was not significantly considered for the November Outlook. However, given climatology and a broad-scale environment predicted in the models that is consistent with a Central American Gyre (CAG) formation over the tropical Americas, conditions are favorable for tropical cyclone (TC) development over a broad area from the south of Mexico to the western Atlantic during early parts of November as forecast in the latest CPC Global Tropics Hazards Outlook (GTH). In addition to these influencing factors, the November Temperature and Precipitation Outlooks consider local SST anomalies, dynamical model guidance from the North American Multi-Model Ensemble (NMME), Copernicus model suite (C3S), and the Climate Forecast System version 2 (CFSv2), as well as statistical models that include the influence of trend and ENSO. Week 3-4 forecasts from CFSv2, ECMWF, and GEFSv12 for the early part of November were also considered, as was the expected evolution from the Week 2 forecast period.
Temperature
The November 2023 Temperature Outlook favors a broad area of above normal temperatures for the western contiguous United states (CONUS) stretching into the Southern and Central Plains, the lower half of the Mississippi Valley, the Tennessee Valley, parts of the Ohio Valley, and the Southeast. Week 2 Temperature Outlooks feature a tilt toward below normal temperatures over much of the western CONUS for the period of October 25 through October 1, that shifts eastward toward the central CONUS for October 26 through November 1. In contrast, CFSv2, GEFSv12, and ECMWF predictions of week 3 and 4 temperatures through mid-November broadly favor warming over CONUS, including the western and central parts of the country. This suggests that any potential cooler start to November, particularly over the western CONUS, will be a transient feature with uncertainty on how long it may persist. While recent forecasts from CFSv2 favor strong probabilities for above normal temperatures over the western third of the CONUS, probabilities in the November Temperature Outlook are comparatively damped (40 to 50 percent) to reflect this uncertainty. Higher probabilities (40 to 50 percent) of above normal temperatures are indicated over the Southwest where dynamical models agree. The tilt toward above normal temperatures over the west is also supported by the typical El Niño teleconnection, which favors above normal or milder temperatures over the western half of the CONUS. In contrast, below normal temperatures are more typical over over the eastern half of CONUS during El Niño, however, this is at odds with CFSv2 predictions that favor (relatively) strong probabilities for above normal temperatures over parts of the Mississippi, Ohio, and Tennessee Valleys and the Southeast, and with NMME and C3S predictions that also slightly tilt above normal. A weak tilt toward above normal is maintained over parts of the southeastern CONUS (33 to 40 percent), with higher probabilities (40 to 50 percent) over parts of the Gulf States and Florida Peninsula where there is stronger model agreement, and coincident with above average SST anomalies. Equal Chances (EC) of above, below, and near normal temperatures are indicated for the Northern Plains, Great Lakes, parts of the Mid-Atlantic and New England where statistical tools and dynamical models showed weak or conflicting signals. Mixed positive and negative SST anomalies off the coast of New England adds to uncertainty. Finally, a gradient of above normal temperature probabilities to EC is favored for Northern Alaska to Southern Alaska, with the strongest probabilities of above normal temperatures found over the northernmost part of the state where there was strong model agreement and anomalously warm SSTs.
Precipitation
More uncertainty is apparent in the November 2023 Precipitation Outlook, with EC indicated for a large part of the CONUS given weak and inconsistent model results, and significant day to day differences in recent CFSv2 predictions. A region of favored above normal precipitation is indicated from parts of Texas eastward across the Southeast and up the East Coast of the CONUS. This region of elevated above normal precipitation probabilities is supported by the NMME and C3S, and agrees with the expected El Niño teleconnection and the potential for increased precipitation that may be associated with elevated TC development. However, probabilities are damped given CFSv2 guidance that favors a tilt toward below normal precipitation probabilities. A slight tilt toward below normal precipitation is depicted over the western Great Lakes where NMME, C3S, CFSv2, and expected El Niño teleconnections all support below normal. Both statistical and dynamical models support enhanced probabilities of above normal over Northern Alaska. Guidance is mixed for the southern coast, but recent CFSv2 forecasts consistently favor stronger probabilities of below normal precipitation, additionally supported by a subset NMME and C3S models, and thus below normal precipitation probabilities are elevated over coastal regions.
SUMMARY OF THE OUTLOOK FOR NON-TECHNICAL USERS(Focusing on Nov/Dec/Jan)
An El Nino Advisory remains in effect as El Nino conditions remain strongly in place across the Pacific Ocean basin and its influence continues to contribute to the temperature and precipitation outlooks through the upcoming winter 2023-2024 season. In fact, odds for El Nino conditions to persist through the Northern Hemisphere Spring 2024 are currently forecast at 80%.
Temperature
The November-December-January (NDJ) 2023-2024 temperature outlook depicts elevated odds for above-normal seasonal mean temperatures for Alaska, the Far West, the northern tier of the contiguous U.S. as well as for the Ohio Valley and mid-Atlantic. The greatest likelihood for warmer than normal temperatures is for parts of Alaska, the Pacific Northwest and New England.
Precipitation
For NDJ precipitation, above-normal seasonal precipitation amounts are favored for the north slope of Alaska, the southern Plains, lower Mississippi valley, Southeast and southern mid-Atlantic. Drier-than-normal conditions are most likely for areas in the Pacific Northwest, northern Rockies, northern High Plains and parts of Michigan.
Areas depicted in white and labeled “EC” (Equal-Chances) are regions where climate signals are weak and so there are equal odds for either above-, near-or below-normal seasonal mean temperatures and seasonal total precipitation amounts.
BASIS AND SUMMARY OF THE CURRENT LONG-LEAD OUTLOOKS
PROGNOSTIC TOOLS USED FOR U.S. TEMPERATURE AND PRECIPITATION OUTLOOKS
Potential common impacts associated with El Nino are utilized in preparation of the outlook given the current strong ongoing event. This includes standard techniques such as composite analysis and regressions anchored to Nino3.4 SST in both diagnostic and prognostic terms. Given the strength of the current El Nino event as represented in surface and subsurface ocean temperature observations, El Nino impacts are considered through the MAM 2024 season.
Statistical guidance, including the global SST based CA and CCA forecast tools, played a considerable role along with long term temperature and precipitation trends (OCN) for many leads. Dynamical model guidance from the NMME and Copernicus (C3S) multi-model ensemble systems are utilized through MAM 2024. In addition, objective, historical skill-based consolidation tools contribute to the outlook and include the ENSO/OCN baseline guidance and the complete suite of statistical/dynamical forecast tool combinations. Coastal anomalous SSTs are also considered during some forecast leads.
PROGNOSTIC DISCUSSION OF OUTLOOKS – NDJ 2023 TO NDJ 2024[Editor’s Note: I guess it is a question of style but the last three month outlook runs from November 2024 to January 2025]
TEMPERATURE
The NDJ 2023-2024 temperature outlook favors above-normal temperatures for Alaska, the Far West, the northern tier of the contiguous U.S. as well as for the Ohio Valley and mid-Atlantic. The greatest likelihood for warmer than normal temperatures is for parts of Alaska, the Pacific Northwest and New England. The high likelihood for the continuation of a strong El Nino event through Spring 2024 and so elevated odds for associated extratropical impacts – on average over many events – is a primary driver of the evolution of the temperature outlooks from NDJ 2023-2024 through the MAM 2024. Multiple types of guidance is utilized to assess the ENSO potential impacts in preparation of the outlooks and included El Nino composites, ENSO regression / correlation information, statistical forecast tools and dynamical model guidance.
The combination of ENSO (as defined and predicted by the CPC Nino3.4 SST consolidation) and OCN served as the initial baseline forecast to start for the official outlooks from NDJ 2023-2024 through MAM 2024. Favored above-normal temperatures continue along the northern tier of CONUS through the first 5 leads with a gradual decrease in coverage and relaxation of probabilities in this highlighted area. This is primarily evident in the northern Plains, Midwest and Great Lakes. It is related to greater uncertainty as represented by conflicting signals from the suite of forecast tools, potential for impacts related to changes in the stratosphere which tend to occur more often later in the winter months/early spring and long term colder temperature trends across the north central CONUS especially in FMA 2024.
Favored near-normal temperatures are forecast for parts of the Rockies, Southwest and south-central Plains for DJF 2023-2024. The statistical only and total (statistical tools and NMME guidance combined) consolidation forecasts played a considerable role in this forecast. Interplay between ENSO impacts, long term temperature trends and dynamical model guidance from the NMME and C3S ensemble systems resulted in an objective forecast where near-normal temperatures are most likely for much of this area and also for the lower Mississippi valley and Southeast for JFM 2024. It is noteworthy that the ECMWF seasonal forecast favors near- to below-normal temperatures for much of the interior CONUS during the NDJ 2023-2024 through JFM 2024 seasons. [Editor’s note: I tend to agreewith the ECMWF]
There is greater consistency and a stronger signal for favored below-normal temperatures in part associated with El Nino for the southern Plains for FMA and MAM 2024. This would also be consistent with an assumed persistence – not far fetched – of a favored colder than normal signal noted above in the JFM 2024 ECMWF forecast.
For Alaska, there is a strong signal for favored above-normal temperatures for the state during El Nino events and this is highlighted in the outlooks from NDJ 2023-2024 through AMJ 2024. Trends of earlier sea ice melt along the western and northern coasts of Alaska increase the odds for nearby land areas during AMJ 2024.
As the forecast suite extends into summer and autumn 2024, the coverage of favored above-normal temperatures increases substantially first for areas in the western and eastern CONUS through MJJ 2024, and later expands to include the majority of the forecast domain through autumn 2024. These outlooks are heavily driven by long term positive temperature trends .
PRECIPITATION
For the NDJ 2023-2024 precipitation outlook, above-normal seasonal precipitation amounts are most likely for the north slope of Alaska, the southern Plains, lower Mississippi valley, Southeast and southern mid-Atlantic. Drier-than-normal conditions are most likely for areas in the Pacific Northwest, northern Rockies, northern High Plains and parts of Michigan.
Similar to that written above for temperature, the evolution of the precipitation outlooks through MAM 2024 are anchored to first order to potential typically observed impacts during El Nino events in the winter and spring seasons – on average over many events. In addition, consolidation of both statistical and dynamical model guidance (NMME, C3S) modified the baseline initial El Nino and OCN forecast. The area of greatest confidence in the precipitation outlooks from NDJ 2023-2024 through FMA 2024 within the forecast domain is overwhelmingly for areas along the Gulf coast and southeast CONUS where wetter than average conditions are forecast.
Elevated probabilities for above-normal precipitation is also forecast along the eastern seaboard with coverage expanding northward along the coast from NDJ 2023-2024 to JFM 2024 – which is strongly supported by most dynamical model guidance. In addition, the area of favored above-normal precipitation is expanded northward to the central and northern Plains during FMA and MAM 2024, consistent with El Nino impacts, positive precipitation trends in some of this area and dynamical model guidance from the NMME and C3S systems.
Despite a strong El Nino event highly likely this upcoming winter and spring, the NMME and C3S dynamical model guidance depicts high forecast spread and seasonal precipitation outcomes – both in sign (i.e., wet/dry) and location. This is quite different from similar forecast guidance preceding the 2015-2016 El Nino event. Given this, the forecast probabilities for either above-normal or below-normal seasonal precipitation are quite modest for the western CONUS. Elevated odds for above-normal precipitation is depicted for parts of California and Nevada during DJF 2023-2024 and JFM 2024, with slightly elevated probabilities extended across the central Rockies. The best convergence of ancillary information, forecast tools and model guidance is the primary basis for the selection of this area.
For Alaska, above-normal precipitation is most likely for the north slope of Alaska during NDJ and DJF 2023-2024 and later the extreme south central coast in the JFM and FMA 2024 seasons. The set of outlooks from AMJ 2024 onward are primarily based on long term precipitation trends .
Review of the ENSO Assumptions utilized by NOAA (CPC) in Preparing this Four-Season OutlookThe key information used by NOAA follows.

| It looks like El Nino through the forecast period. It does start to reduce intensity in DJF 2023/2024. There is increasing confidence that this El Nino will weaken in the Spring which is shown here as the probabilities of El Nino beginning to converge with the probabilities of ENSO Neutral. |
Tropical Subsurface Temperature Anomalies
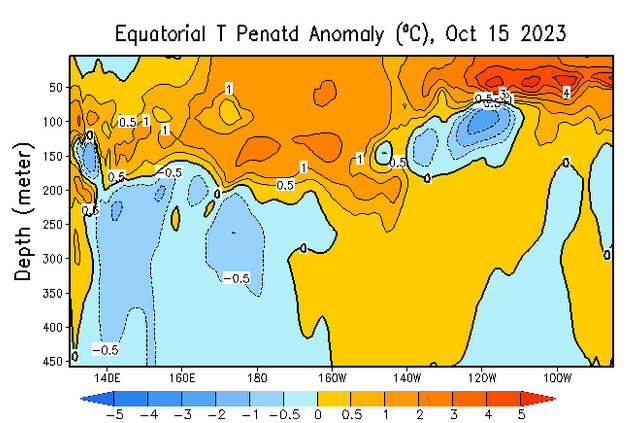
| You can update this graphic by clicking HERE and scrolling down to “Mean and anomalous equatorial temperatures“. One has to differentiate between the surface and at depth. |

| The image will update if you click HERE. This model is predicting a fairly strong El Nino (but not a MegaNino) lasting a while. |
Resources
–
| I hope you found this article interesting and useful. |
–