This article concludes the analysis of the correlation patterns between Household and Nonprofit Organization Credit (HNO) and Consumer Inflation (CPI). The last of the three types of inflation patterns (time periods with no significant inflation trends) is the subject of analysis here. The other two types of patterns (inflation surges1 and disinflation/deflation surges2) were analyzed previously. The conclusion discusses the correlation patterns for all time periods, looks for any common threads, and identifies important differences across time periods and types of correlation patterns.

From a photo by Stephen Phillips – Hostreviews.co.uk, on Unsplash.
Introduction
The hypothesis we are testing is that inflation depends on consumer credit in a linear manner, expressed in the following equation:3
I = mS + b
where
I = Change in CPI (the Consumer Price Index)
S = Change in Consumer Credit
Data
The data sources and tables for HNO and CPI are3 in Part 1. The timelines3 for the two data sets are also in Part 1, with coincident timelines and offsets by three and six months out to 24 months for HNC coming before CPI and vice versa.
The inflation timeline3 from 1952 through 2022 is in Part 1 and corrected1 in Part 2. The inflation timeline uses year-over-year inflation calculated quarterly. Figure 1 shows the graph of inflation for the 1952-2022 time period3 (from Part 1).
Figure 1. CPI Rolling Four Quarter Inflation 1952-2022 with Significant Changes in Inflation Noted
(Each letter identifies the end of a significant move. An * identifies the end of an insignificant time period.)

Table 1 shows the data from Figure 1.
Table 1. Timeline of Inflation Data 1952-2022 (Previously Table 4*.1)

In Table 1, a black letter identifies a significant positive surge in inflation, a red letter for significant negative surges, and no letter for time periods with no significant changes in inflation.
Significant surges are changes in inflation ≥4% with no intervening countertrend moves >1.5%.
Analysis
There are 13 quarterly timeline alignments examined in each of the 5 time periods:
- HNO Credit and CPI Inflation quarters are coincident.
- HNO Credit leads and lags CPI Inflation by one quarter (±3 months)
- HNO Credit leads and lags CPI Inflation by two quarters (±6 months)
- HNO Credit leads and lags CPI Inflation by three quarters (±9 months)
- HNO Credit leads and lags CPI Inflation by four quarters (±12 months)
- HNO Credit leads and lags CPI Inflation by six quarters (±18 months)
- HNO Credit leads and lags CPI Inflation by eight quarters (±24 months)
2Q 1957 – 1Q 1959
Figure 1. U.S. HNO Credit and Inflation 2Q 1957 – 1Q 1959
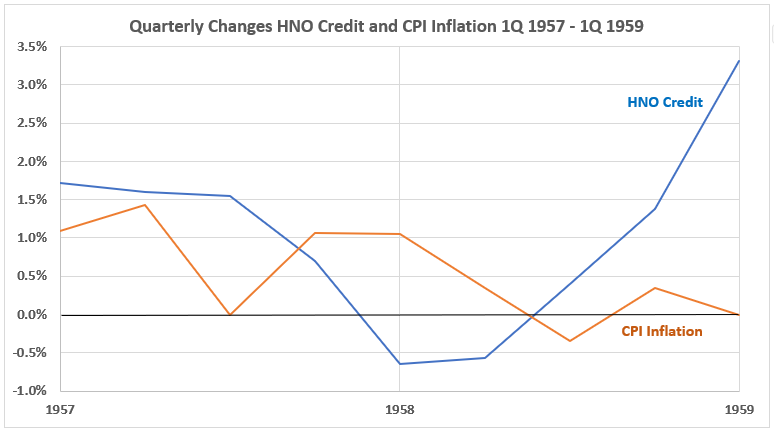
In this time period, CPI inflation quarterly changes are in a gradual declining trend. For HNO Credit, quarterly changes are also in a downtrend for the first 12 months and then reverse to increasingly larger changes for the second 12.
Figure 2. Quarterly Changes in HNO Credit (x) vs. CPI Inflation (y) 2Q 1957 – 1Q 1959
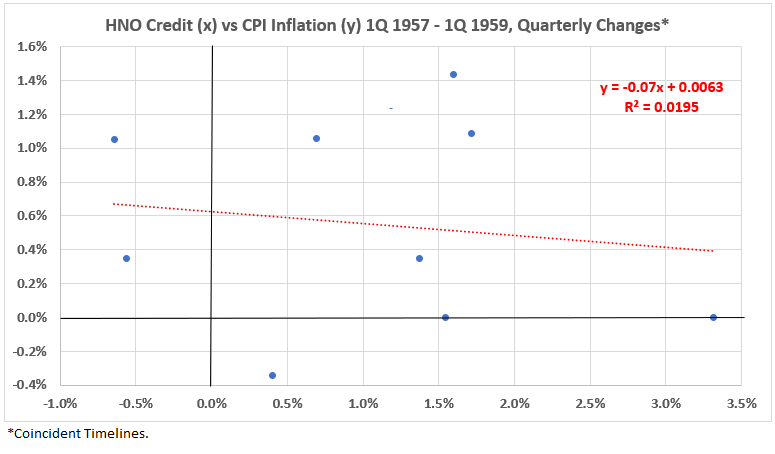
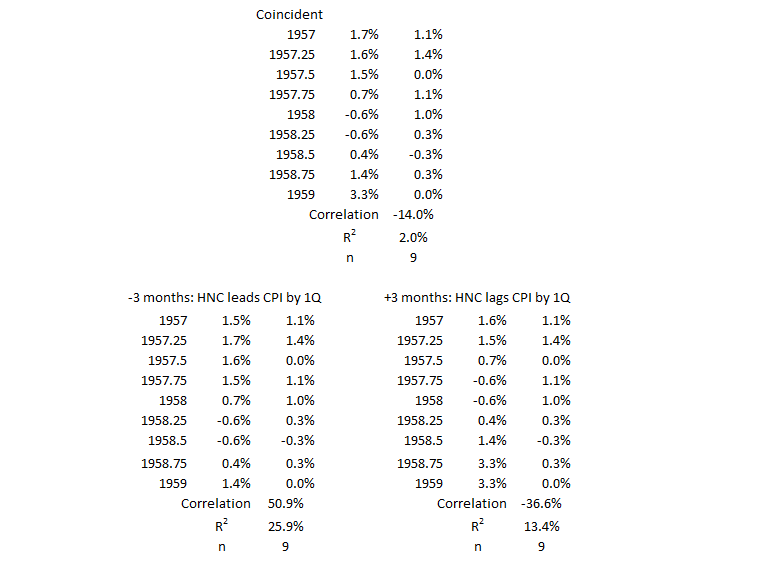
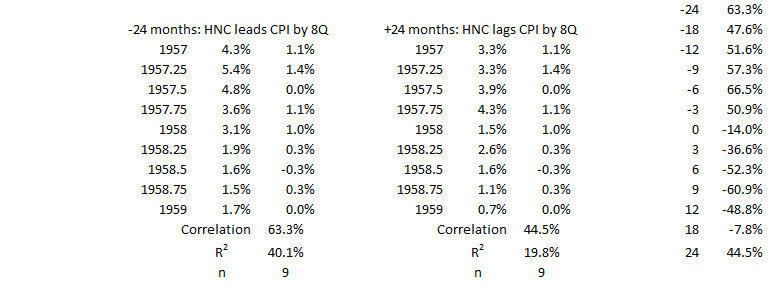
The association (correlation) between HNO Credit and CPI Inflation is weakly negative for this inflation surge period: R = –14%, R2 = 2%.
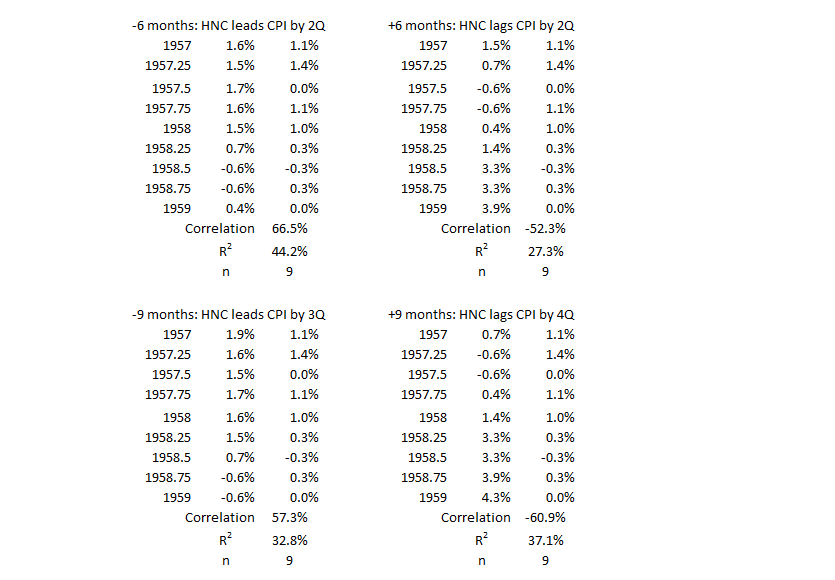
Figure 3. Correlation Between HNO Credit and CPI Inflation 2Q 1957 – 1Q 1959
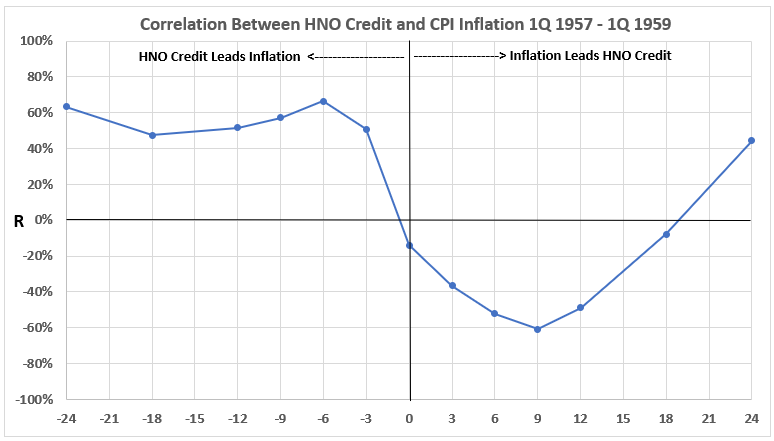
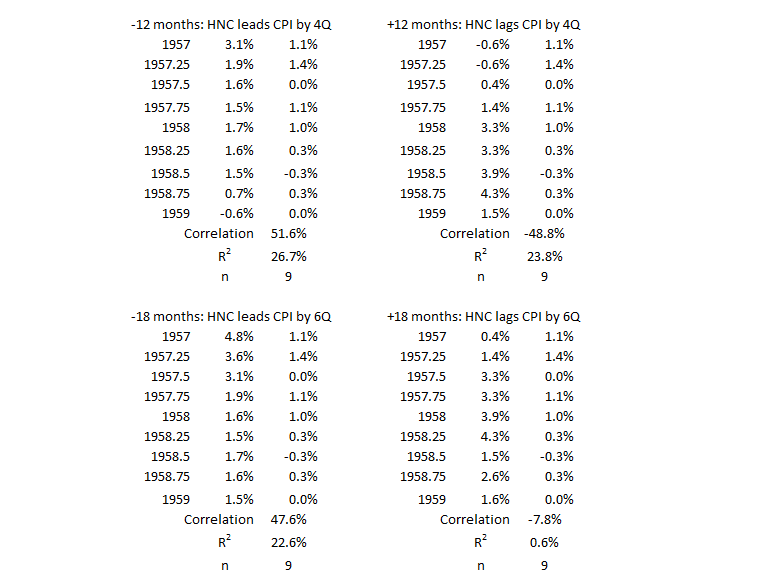
Figure 3 shows the positive association of HNO Credit with inflation is moderate when credit comes before inflation (left-hand side of the graph). On the other hand, the association is negative (again, mostly moderately) when inflation comes before credit spending. With an 18-month lead, the association becomes negligible and moderately positive for 24 months.
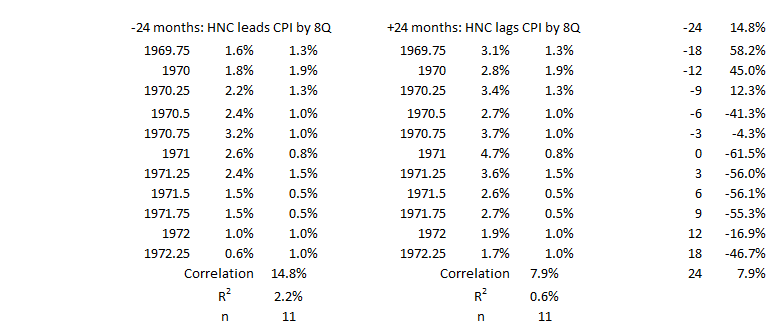
1Q 1970 – 2Q 1972
Figure 4. U.S. HNO Credit and Inflation 1Q 1970 – 2Q 1972
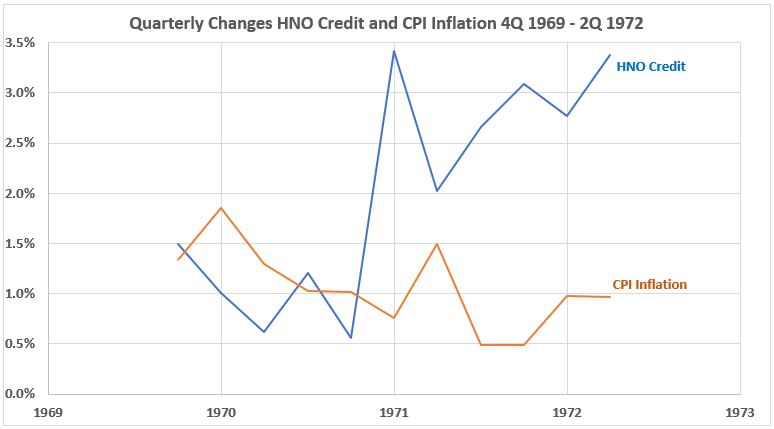
Figure 4 is similar to Figure 1, with a gradually decreasing trend for quarterly inflation changes. However, the increasing quarterly changes for HNO Credit are more pronounced over more quarters.
Figure 5. Quarterly Changes in HNO Credit (x) vs. CPI Inflation (y) 1Q 1970 – 2Q 1972
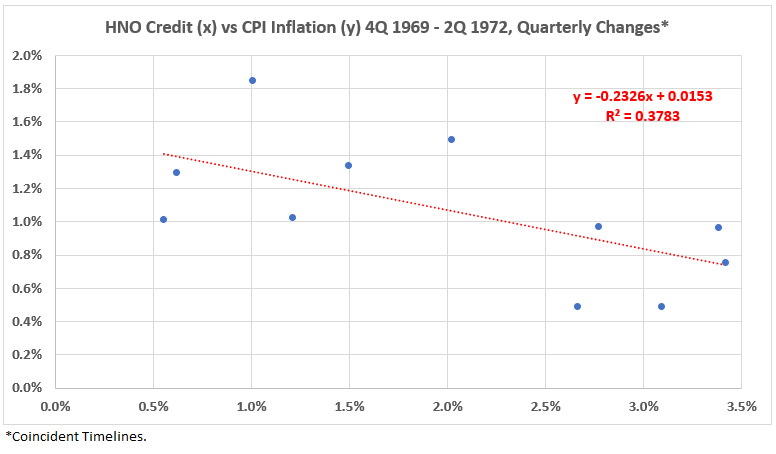
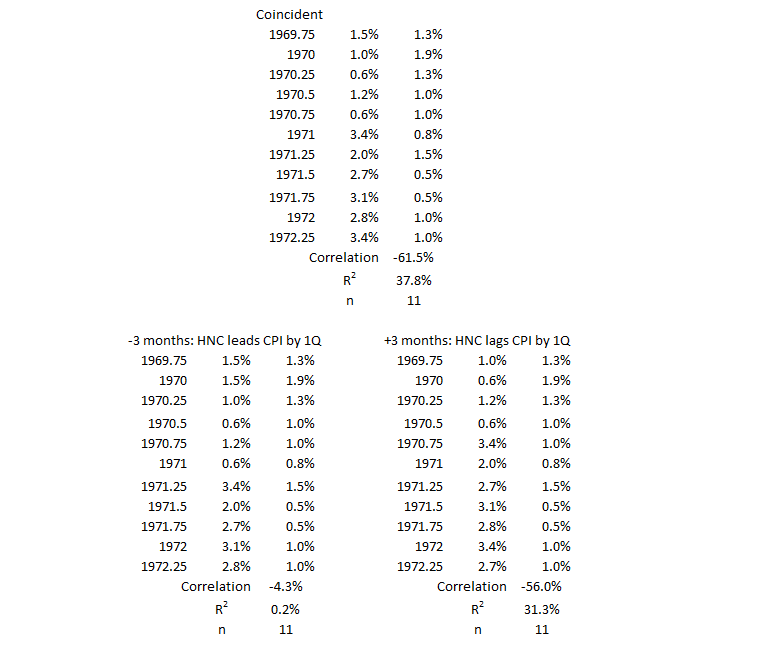
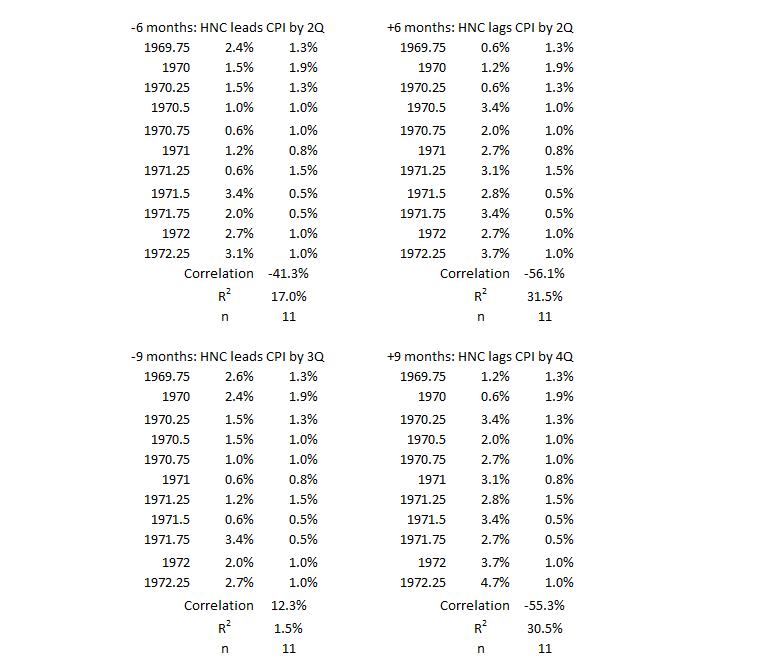
The association (correlation) between HNO Credit and CPI Inflation is moderately negative for this inflation surge period: R = –62%, R2 = 38%.
Figure 6. Correlation Between HNO Credit and CPI Inflation 1Q 1970 – 2Q 1972
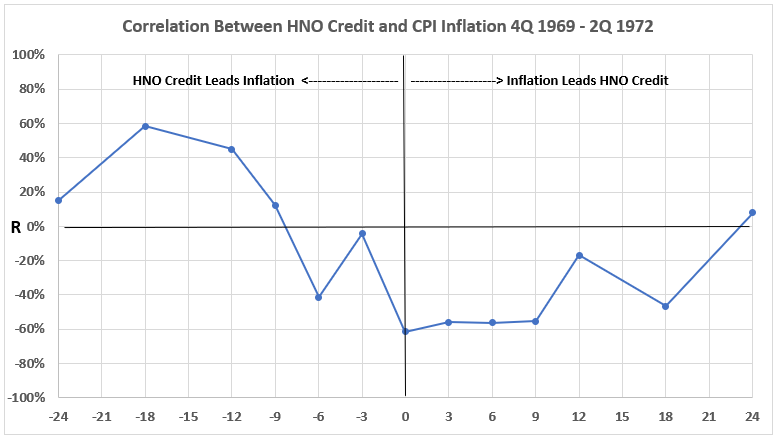
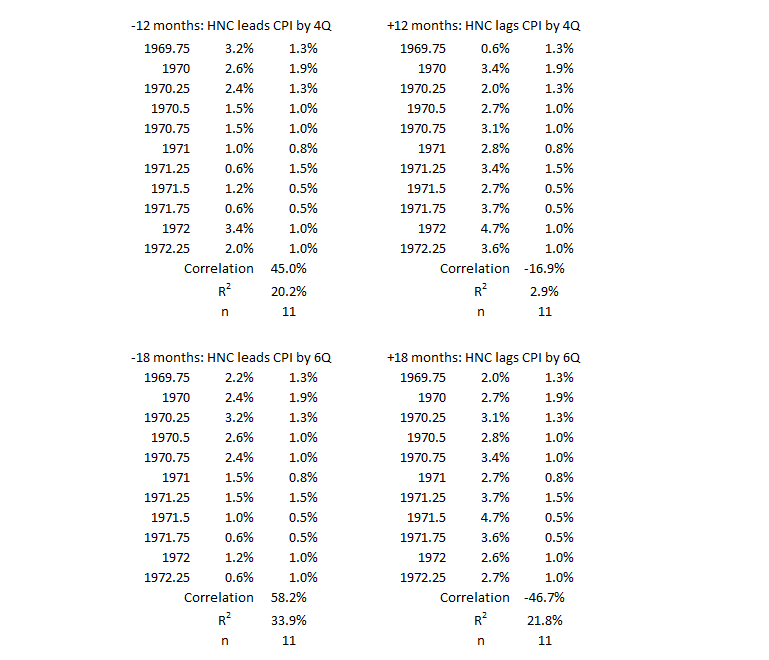
Figure 6 shows the positive association of HNO Credit with inflation is moderate when credit comes before inflation by 12 and 18 months (left-hand side of the graph). On the other hand, the association is negative (again, mostly moderately, 3, 6, 9, and 18 months) when inflation comes before credit spending. Figure 6 shows some similarity to Figure 3, but the correlations are less uniform and not as strong.
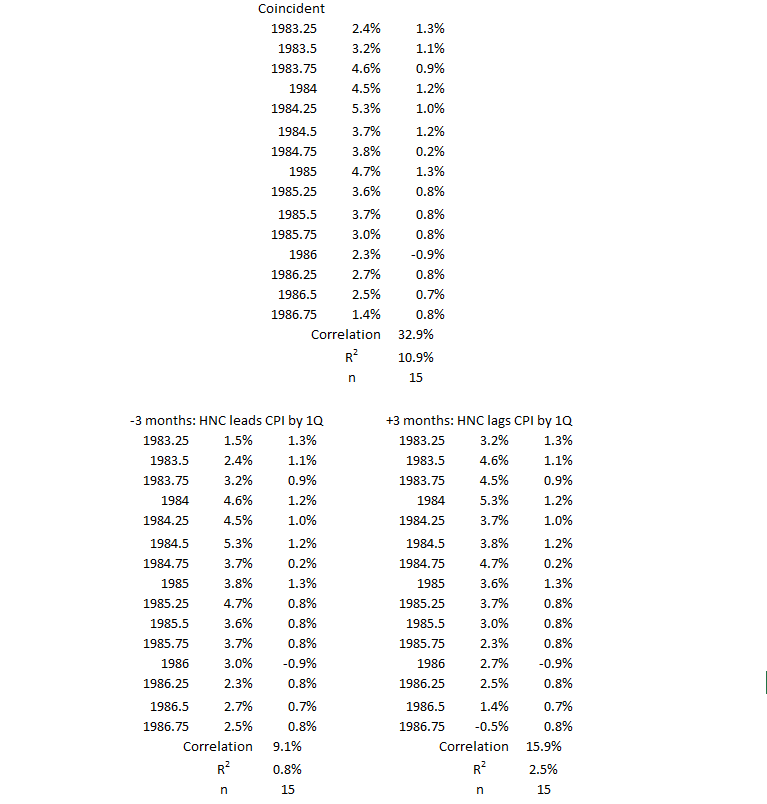
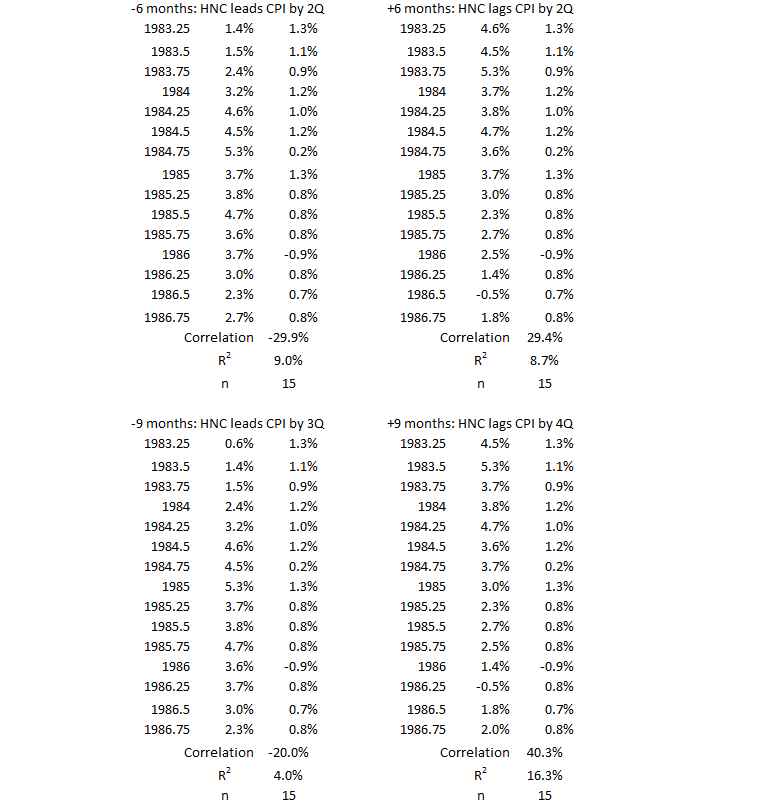
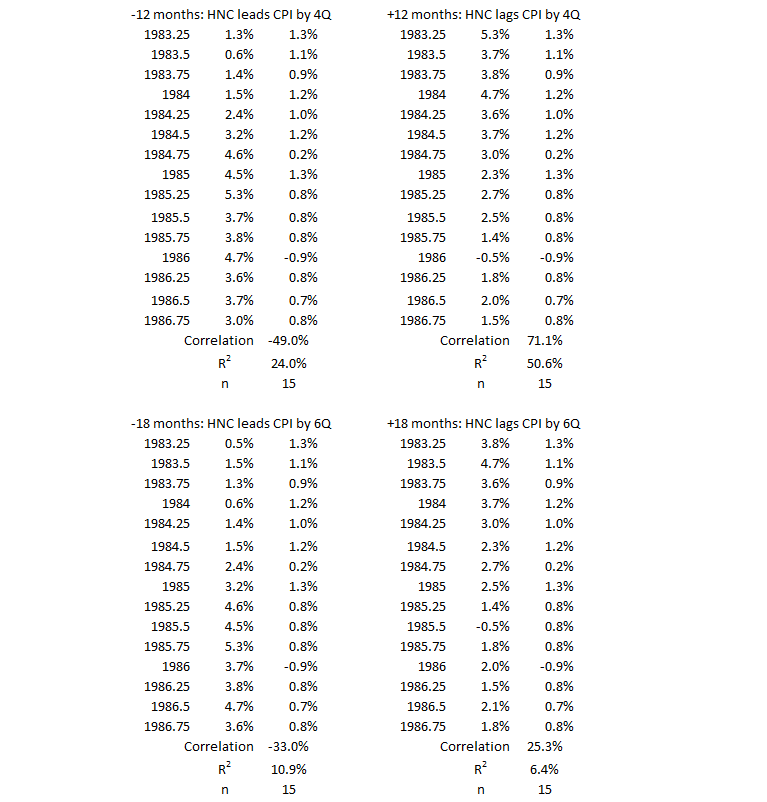
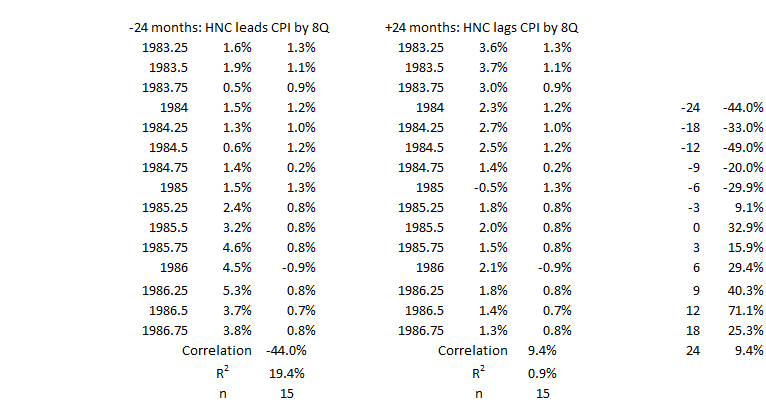
3Q 1983 – 4Q 1986
Figure 7. U.S. HNO Credit and Inflation 3Q 1983 – 4Q 1986
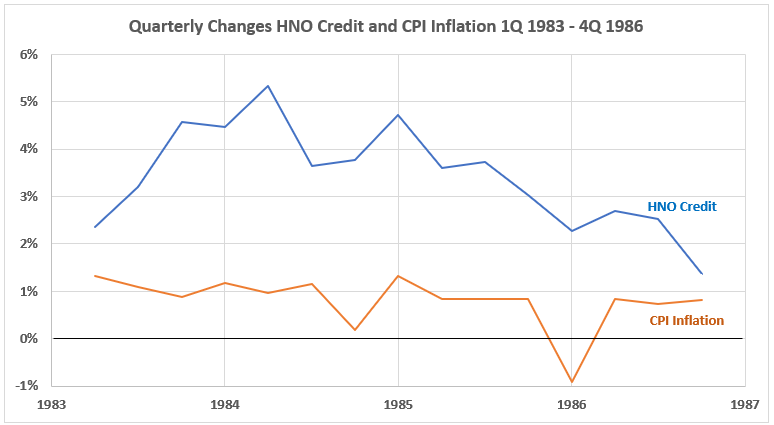
Figure 7 shows a different pattern than the two previous periods above. Here, after an initial rise, the quarterly increases in HNO Credit are in a declining trend for ten quarters. CPI Inflation shows little change except for the two quarters with dips that are recovered in the next quarter. The other quarterly changes are close to 1%.
Figure 8. Quarterly Changes in HNO Credit (x) vs. CPI Inflation (y) 3Q 1983 – 4Q 1986
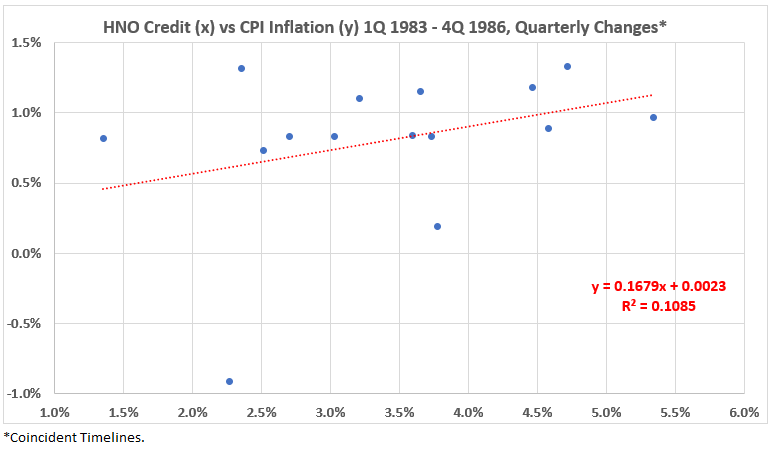
This time period differs from the first two, with a slightly positive correlation: R = 33%, R2 = 11%.
Figure 9. Correlation Between HNO Credit and CPI Inflation 3Q 1983 – 4Q 1986
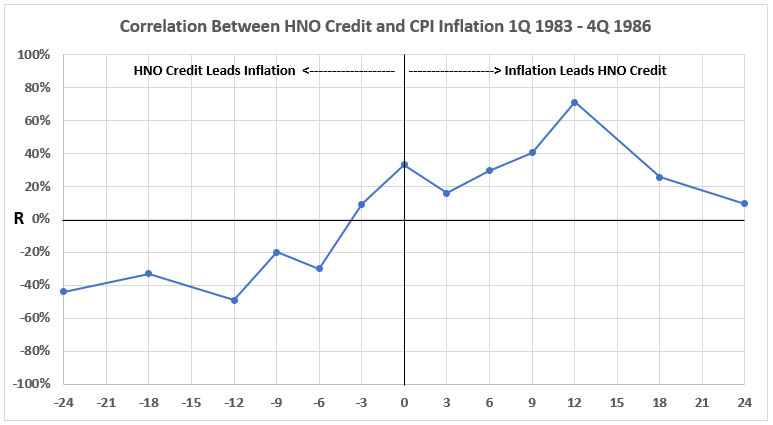
Again, the results in Figure 9 and in sharp contrast to the first two time periods: There are weak negative correlations on the left-hand side of the graph and positive correlations on the right. All the correlations are weak except for inflation strongly positively correlated to HNO Credit 12 months later.
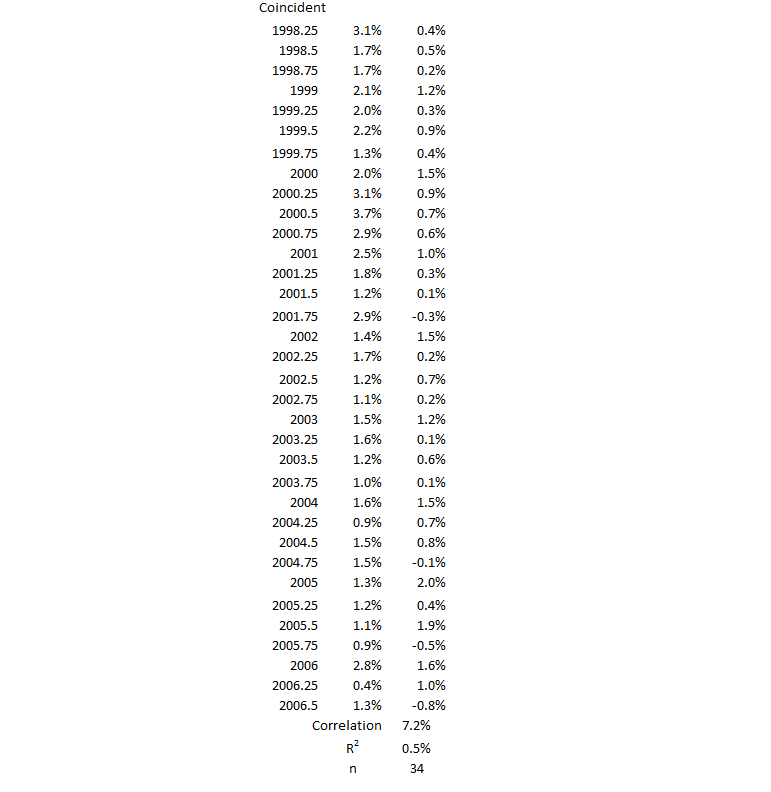
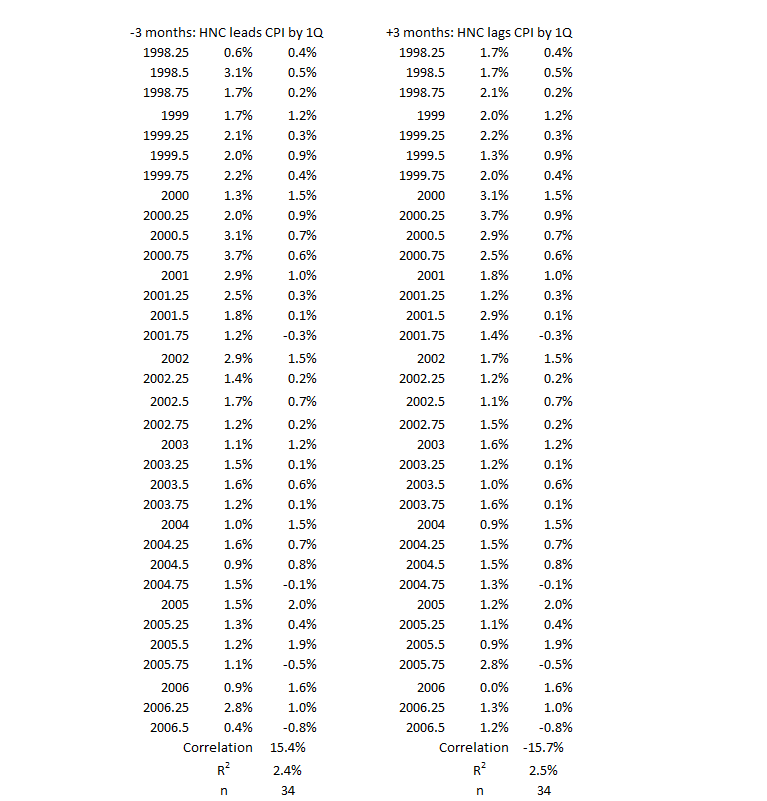
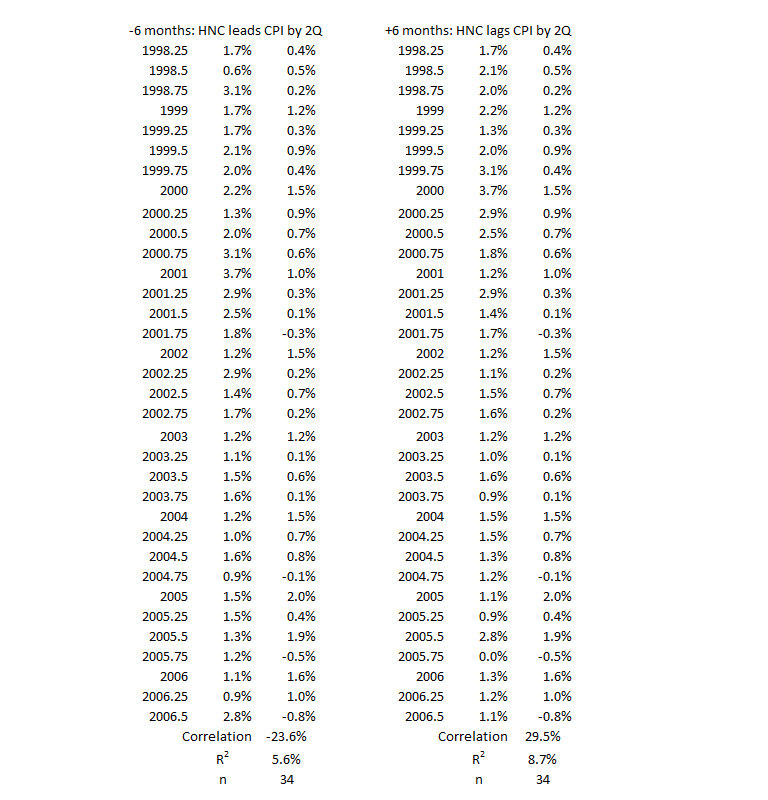
2Q 1998 – 3Q 2006
Figure 10. U.S. HNO Credit and Inflation 2Q 1998 – 3Q 2006
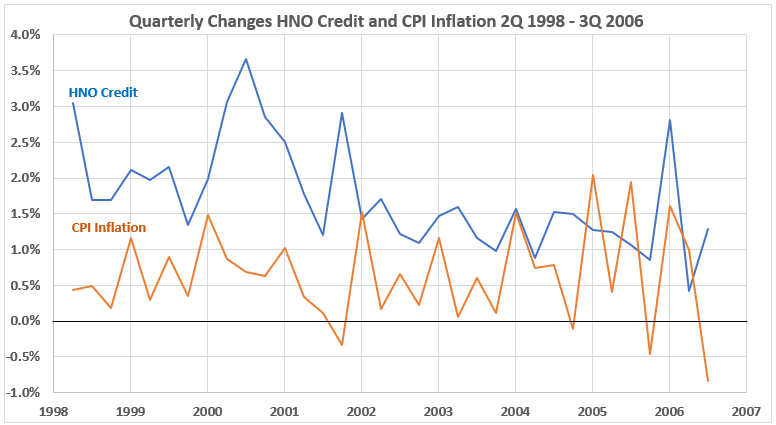
Figure 10 shows a much different behavior for CPI Inflation than seen in the previous three periods. Here, although there is no trend up or down, inflation shows many alternating large quarterly changes, up and down. The data for HNO Credit is more similar in quarter-to-quarter variation seen before, but for the first time, it shows a consistent gradual down-trend over the time period.
Figure 11. Quarterly Changes in HNO Credit (x) vs. CPI Inflation (y) 2Q 1998 – 3Q 2006
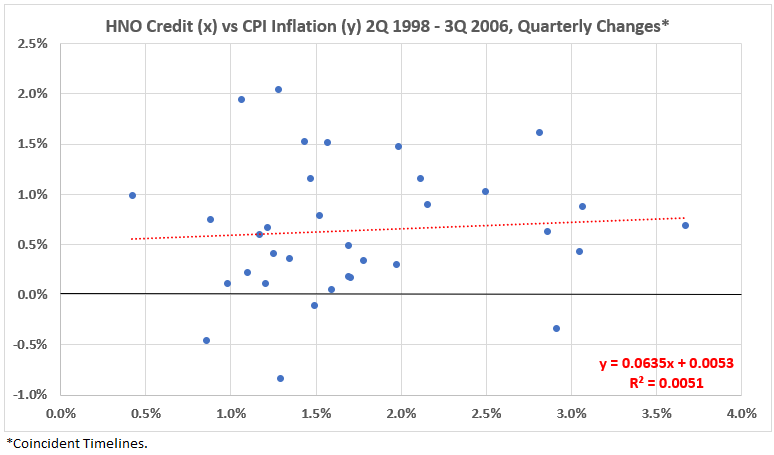
This data shows a very small positive correlation: R = 7%, R2 = 0.5%. This association can be considered negligible. It indicates that at least 99.5% of the cause of quarterly variation in HNO Credit is caused by CPI Inflation or vice versa. Note: This is for coincident data timelines. The correlations for data timeline leads and lags are in Figure 12.
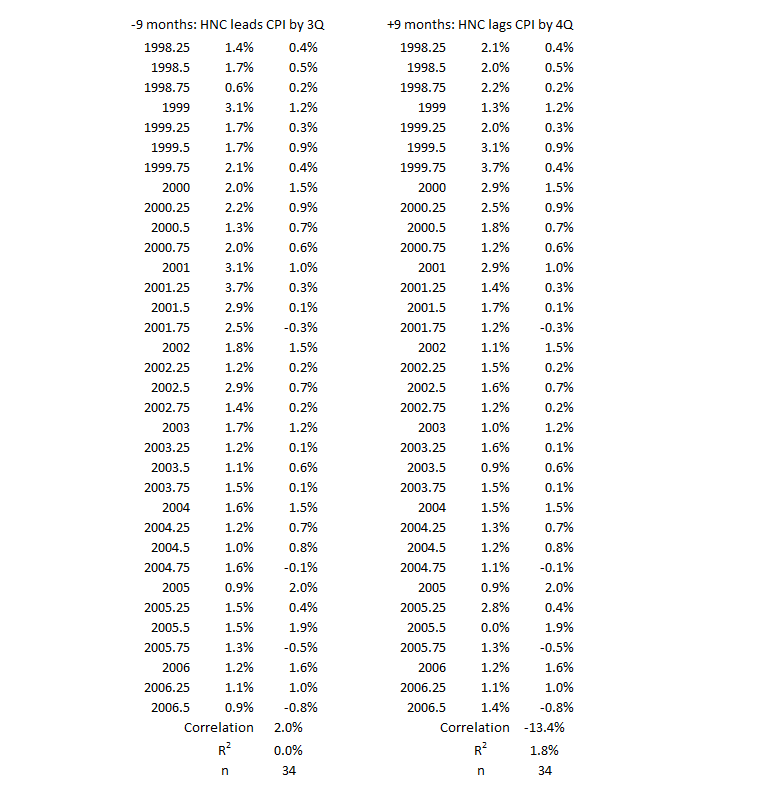
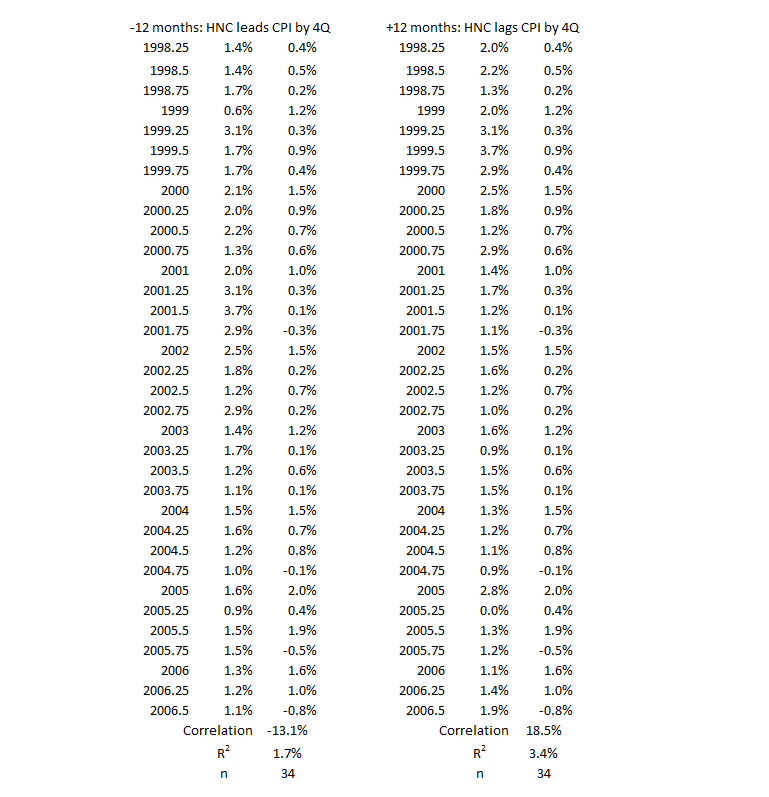
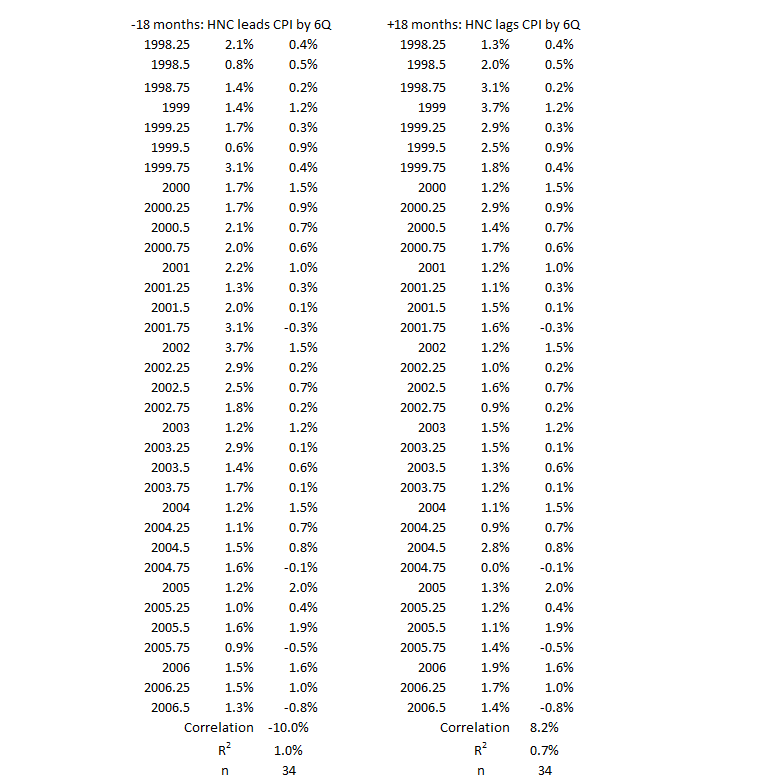
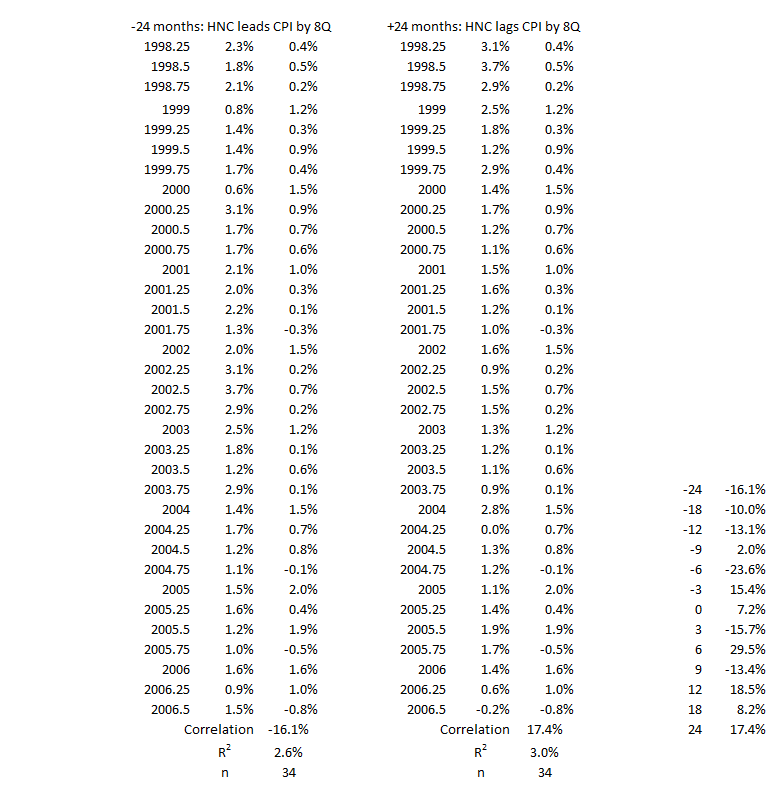
Figure 12. Correlation Between HNO Credit and CPI Inflation 2Q 1998 – 3Q 2006
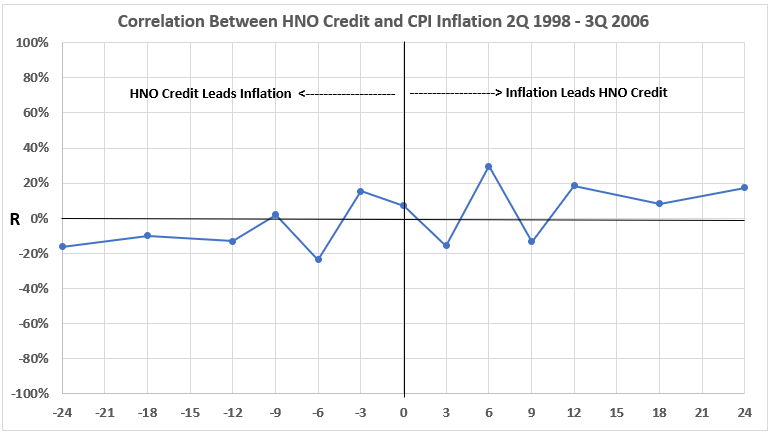
Figure 12 indicates that there is very little association between HNO Credit and CPI Inflation for this 102-month period. The highest value of R is 29.5% for HNO Credit changes six months after inflation changes. That produces an R2 = 9%, the maximum amount of HNO change possibly caused by CPI change. In other words, 91% or more of HNO Credit change during this period was caused by something other than inflation change.
The maximum correlation for CPI Inflation caused by consumer credit spending is R = 15.4% (R2 = 2.5%) when the spending occurred 3 months before the inflation. That indicates that 97.5% or more of inflation during the 8 years and 6 months of this period was caused by something(s) other than consumer credit spending.
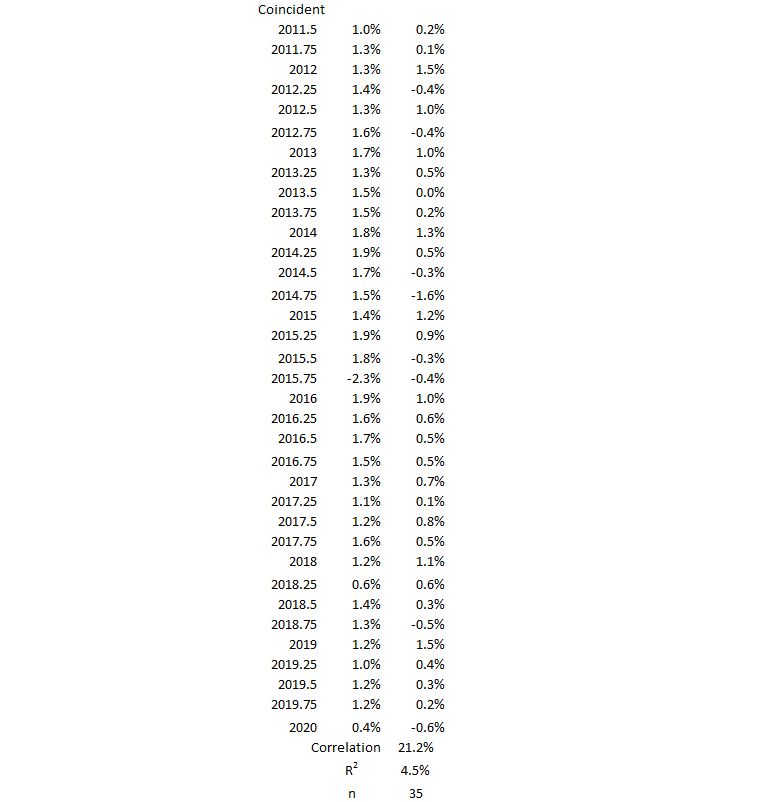
3Q 2011 – 1Q 2020
Figure 13. U.S. HNO Credit and Inflation 3Q 2011 – 1Q 2020
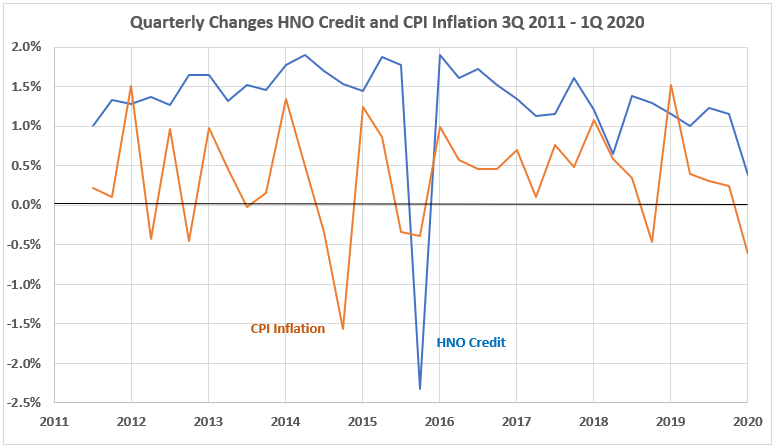
Figure 13 shows quarterly changes in CPI Inflation in a similar pattern to Figure 10: No general overall trend up or down, with many alternating spikes of change in opposite directions. However, the HNO Credit data is different from Figure 10. There is a rising trend for the quarterly changes until 4Q 2014, when a pike down of nearly 4% occurs. The next quarter shows a complete recovery of the downward spike, and then there is a downward trend for HNO Credit quarterly changes until the end of the period.
An important observation: The down-spike in HNO Credit follows a similar down-spike in CPI inflation by 12 months. This type of relationship has not been n noticed before. It is something that might have significance if it occurs often. Or it might be a one-off and should considered otherwise.
Figure 14. Quarterly Changes in HNO Credit (x) vs. CPI Inflation (y) 3Q 2011 – 1Q 2020
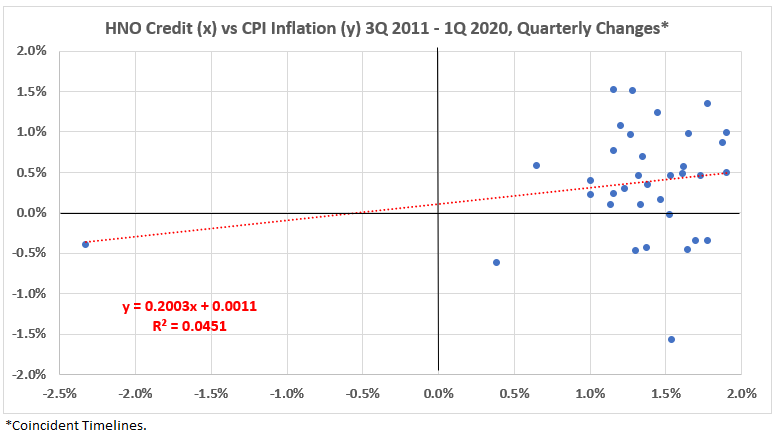
There is a slight positive correlation for this time period: R = 21%, R2 = 4.5%. The two data points associated with the down spikes in Figure 13 are on the extreme left and the lower right corner of Figure 14. By inspection, they appear not to belong to the same distribution as the rest of the data. But by position in the center of the time period, they simply cannot be thrown out arbitrarily. These two data points should remain flagged for consideration with more information (if available) in the future.
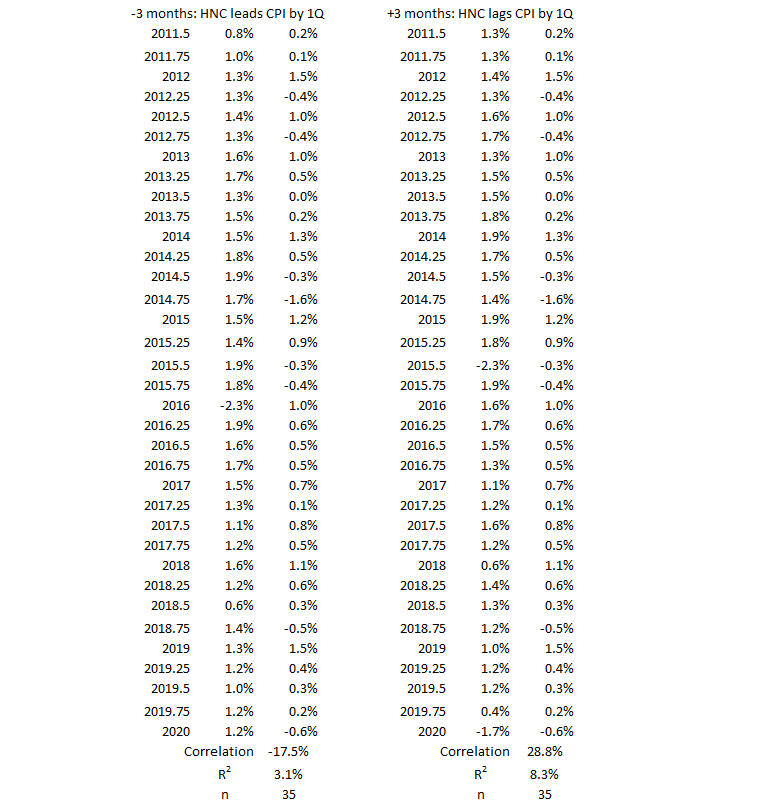
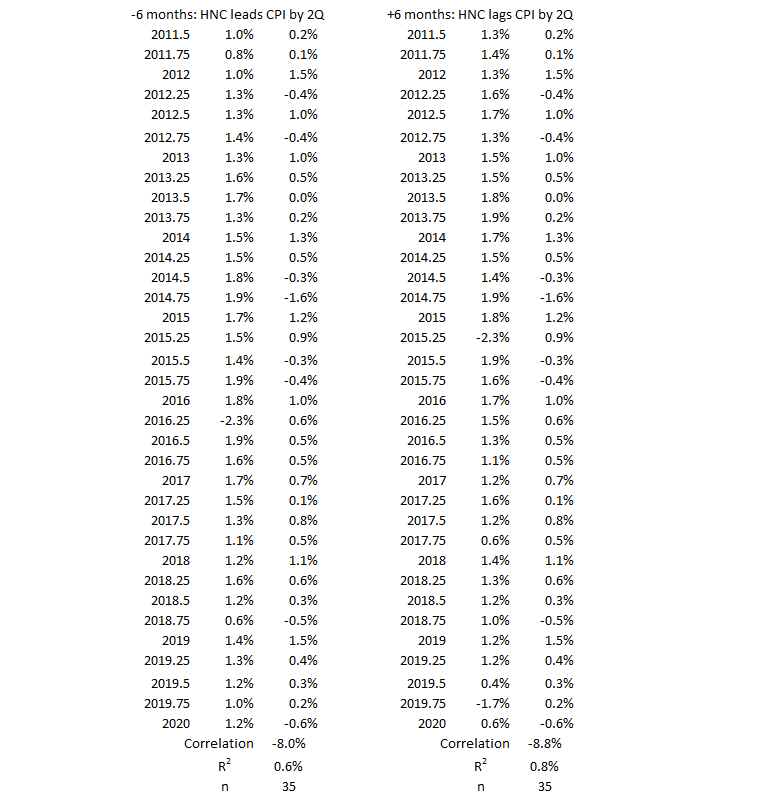
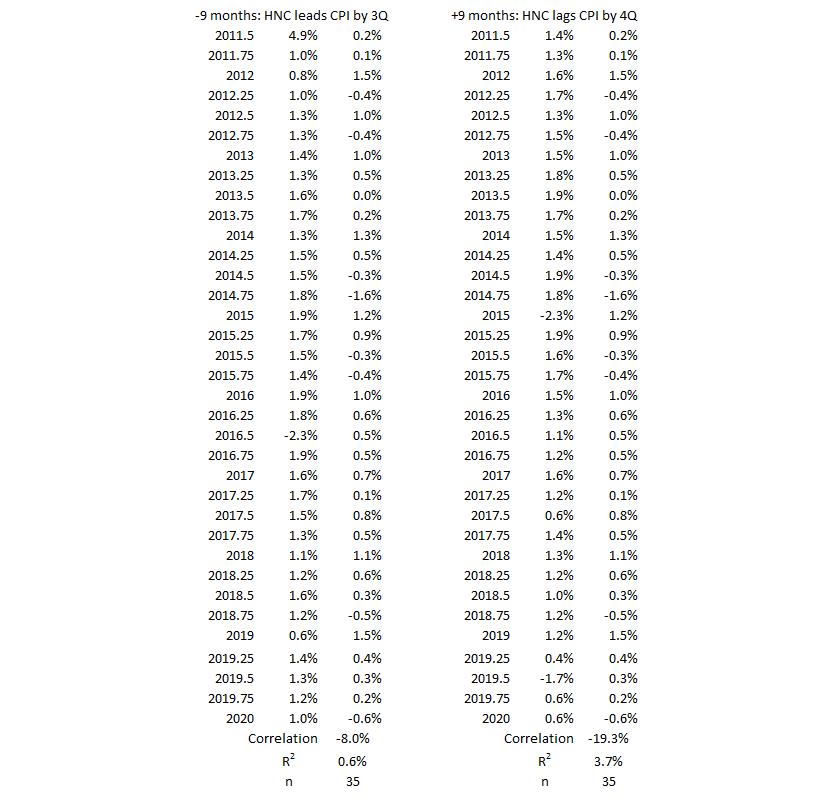
Figure 15. Correlation Between HNO Credit and CPI Inflation 3Q 2011 – 1Q 2020
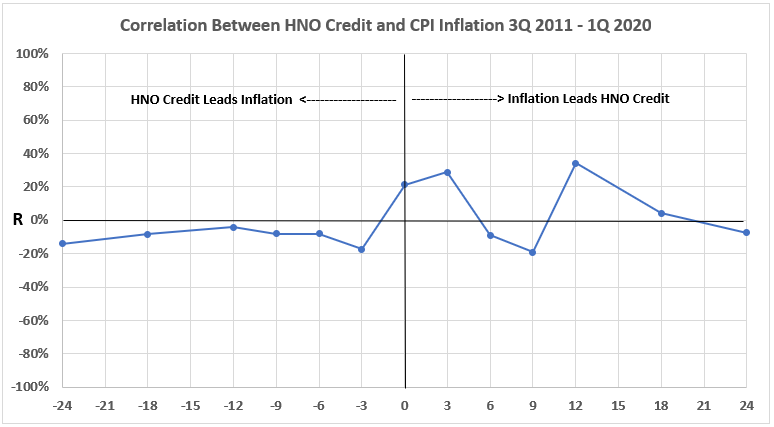
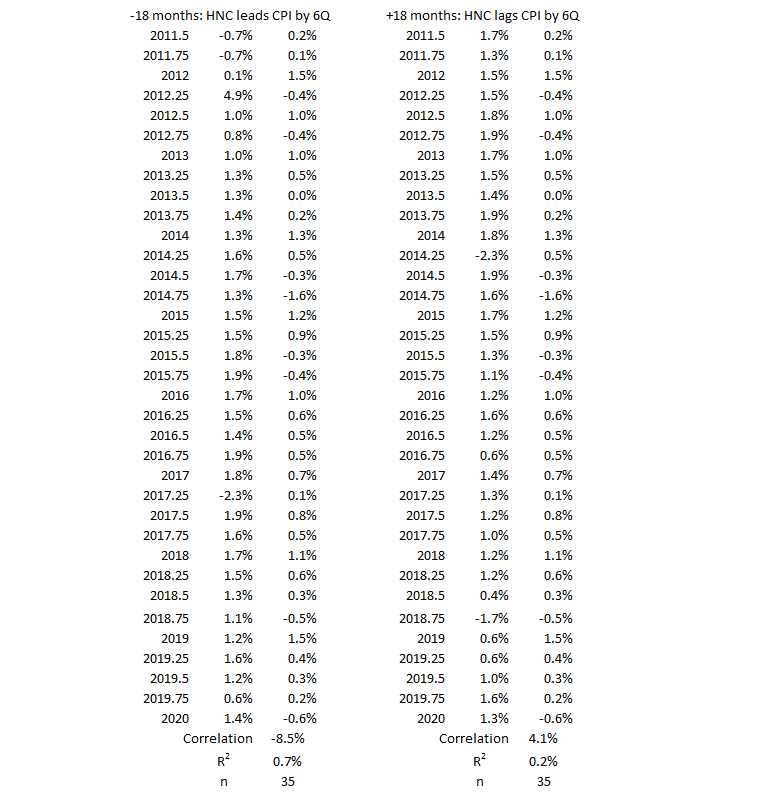
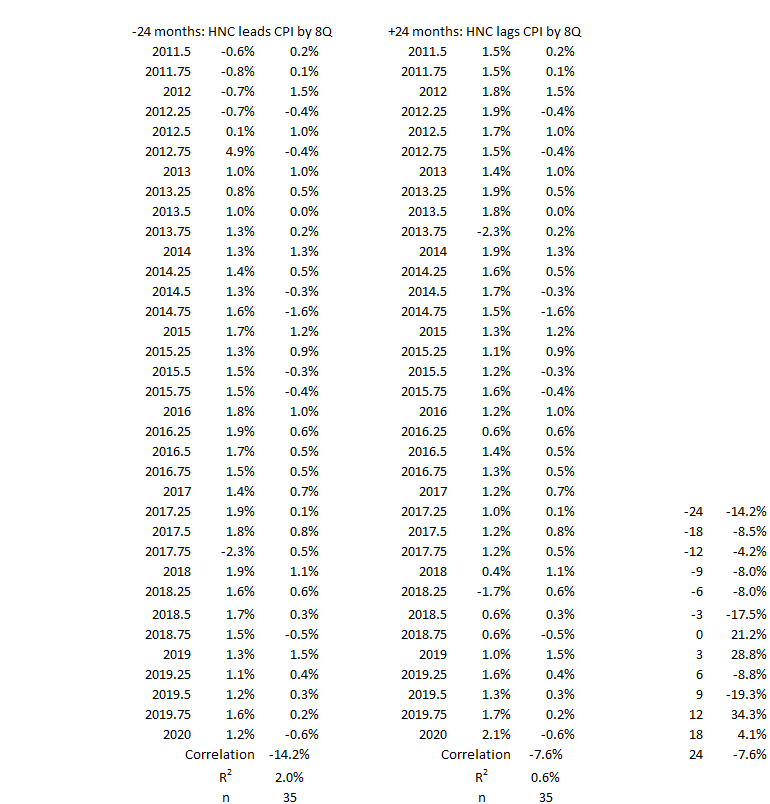
Figure 15 is similar to Figure 12 but has slightly less variability on the left-hand side and a little more on the right. The largest R2 on the left is for the value of inflation three months after HNO Credit (R = –17.5%, R2 = 3.1%). That indicates that, for this period, HNO Credit changes do not lead to CPI Inflation changes in the same direction. (Increased HNO Credit spending cannot cause increased inflation.)
On the right-hand side of the graph, the largest correlation occurs for change in HNO Credit 12 months after a change in CPI Inflation: R = 34%, R2 = 12%. That indicates that 88% or more of HNO credit spending increase (decrease) is caused by something other than CPI Inflation increase (decrease).
Conclusion
The conclusion is divided into three discussions. First, the analysis results are discussed for the current study of time periods without significant inflation surges< up or down. Then the results for this study are compared to the results for Federal Deficit Spending and CPI Inflation. Finally, there is an overall summary and a forward look to future work.
Patterns of Correlation for Periods without Significant Inflation Surges
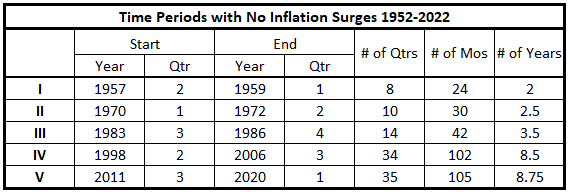
To simplify this discussion, the five periods without significant surges in inflation are numbered, as shown in Table 2.
Table 2. Time Periods with No Inflation/Disinflation Surges 1952-1022
There are fewer correlations found in this data than we might have expected. The general observations for the five periods analyzed in this article are:
- Inflation volatility quarter-to-quarter is much less for I, II, and II than for IV and V.
- There are two periods where the positive association between HNO Credit changes and following inflation changes is moderate (I and II).
- One period (III) has a strong positive association between inflation changes and subsequent HNO Credit changes (12 months later).
- Two periods (IV and V) show limited or negligible positive and negative correlations for all timeline offsets.
- Moderate negative associations occur in three data sets: Inflation changes are associated with later changes (opposite direction) for HNO Credit in I and II, and HNO Credit changes are associated with later changes (opposite direction) for inflation in III.
Overview of All Consumer Credit Spending Data Sets
Let’s review the results for all 18 time periods – positive and negative inflation surges plus the periods without surges analyzed above. We use the letter designations in Table 1 and the numerical designations in Table 2 to simplify the discussion.
Table 3 summarizes the results for all time periods for correlation (association) of quarterly HNO Credit changes with CPI Inflation changes. In the table, black letters are for periods with positive inflation surges, red letters are for periods with negative inflation surges, and Roman numerals are for periods without surges.
Table 3. Associations Between HNO Credit and CPI Inflation 1952-2022
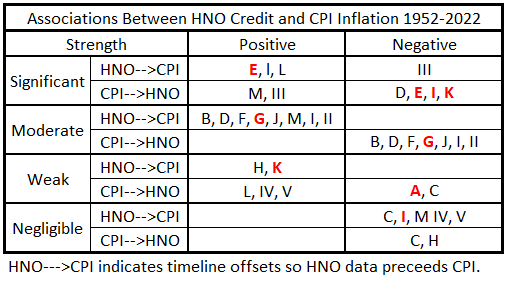
The associations shown in Table 3 indicate the maximum possible cause-and-effect relationships. The moderate correlation strength covers the range 50%>R2>25%. So, for example, R2 = 40%, no more than 40% 0f one variable can result from the other. But the lower limit of cause-and-effect is 0, depending on other information in addition to the statistical result. Stated differently, the cause of one variable is between 60% and 100% from factors other than the second variable.
The weak and negligible associations give a more satisfying result. They indicate that much (more than 75%) of the cause of one variable comes from other sources than the second (weak association), or nearly 100% comes from other sources (negligible).
There are some possibilities for more than 50% cause-and-effect (significant strength), but, without further information, proof is not given.
There are also possibilities for important cause-and-effect relationships between 25% and 50% (moderate strength). But additional information is needed in each case to prove that the causations are not much less.
Comparison of Correlations with Inflation for Federal Deficit Spending and Consumer Credit Spending
The objective of comparing consumer credit spending with federal government deficit spending is not being pursued at this time. The previous deficit spending and inflation study was done using correlations between 12-month data points rather than quarterly.4 Quarterly correlations will be determined for federal deficit spending at some point, and then the comparison can be undertaken.
Summary
There are other sources of money creation than the two studied so far. Next, we will look at mortgage issuance, hopefully starting next week.
Appendix
The data sets for each of the periods without surging inflation or disinflation/deflation are below. They come from the tables of timeline aligments3 (Consumer Credit and Inflation: Part 1).
2Q 1957 – 1Q 1959
1Q 1970 – 2Q 1972
3Q 1983 – 4Q 1986
2Q 1998 – 3Q 2006
3Q 2011 – 1Q 2020

Footnotes
1. Lounsbury, John, “Consumer Credit and Inflation: Part 2”, EconCurrents, September 10, 2023. https://econcurrents.com/2023/09/10/consumer-credit-and-inflation-part-2/
2. Lounsbury, John, “Consumer Credit and Inflation: Part 3”, EconCurrents, September 17, 2023. https://econcurrents.com/2023/09/17/consumer-credit-and-inflation-part-3/.
3. Lounsbury, John, “Consumer Credit and Inflation: Part 1”, EconCurrents, September 3, 2023. https://econcurrents.com/2023/09/03/consumer-credit-and-inflation-part-1/.
4. Lounsbury, John, “Government Spending and Inflation: Reprise and Summary”, EconCurrents, August 20, 2023. https://econcurrents.com/2023/08/20/government-spending-and-inflation-reprise-and-summary/.