Previous posts have summarized the correlations for U.S. federal government deficit spending with inflation1 and deflation2 over the years from 1914-2022. In this article, the correlations of deficit spending with inflation are determined for the years not part of significant inflation surges (up or down).

From a photo by Haran Amorim on Unsplash
Introduction
Previously,3 we sorted the 109 years from 1914-2022 into three groups.
- Years belonging to periods in which inflation increased by at least 4% without any pullback exceeding 1.5%. (10 periods, 34 years)
- Years belonging to periods in which inflation decreased by at least 4% without any pullback exceeding 1.5%. (11 periods, 37 years)
- The remaining years are not part of a period with significant inflation changes. (38 years)
The conclusion was that, even with this disaggregation of the data, no clear hypotheses about time variation of the associations between deficit spending and consumer inflation could be proposed. The conclusion was that it would be necessary to characterize each of the individual periods with significant inflation increases or decreases to determine what (if any) time variation patterns of the correlations between deficit spending and consumer inflation existed over the 109 years.
Note: In the process of the final review of this article, it was discovered that the period 1987-1990 (that had heretofore been considered a period with insignificant inflation change) was actually an inflation surge. This means that the final results presented in Part 13B1 need to be revised. This will be done as part of the final article to be prepared in this series, “Government Spending and Inflation: Reprise and Summary”.
The corrected list above is now:
- Years belonging to periods in which inflation increased by at least 4% without any pullback exceeding 1.5%. (11 periods, 38 years)
- Years belonging to periods in which inflation decreased by at least 4% without any pullback exceeding 1.5%. (11 periods, 37 years)
- The remaining years are not part of a period with significant inflation changes. (34 years)
Table 1. Periods without Significant Inflation Trends 1914-2022
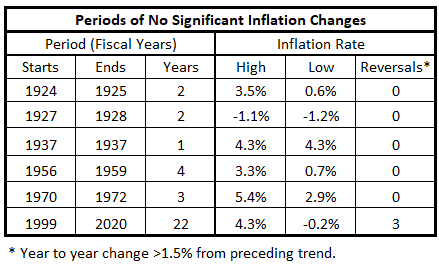
Table 1 shows the data summary for the 34 years not part of a significant inflation surge, up or down, during the years 1914-2022.
Data
The data is the same used previously. First, the time series and correlations are determined for the two data sets coincident for each federal fiscal year. In addition, correlations are calculated for inflation offsets of ±3, ±6, ±9, ±12, ±18, and ±24 months with respect to the fiscal years. The thirteen data tables are shown in Part 13A, Appendix 1.4
Table 1 shows the time periods with no significant changes in inflation (increases or decreases).
Analysis
The specific data for each analysis is in the Appendix below. The data comes from the tables in Part 13A, Appendix 14.
1924-1925 and 1927-1928
The 1920s saw two years of surging inflation (1922-1923), four years of surging deflation (1920-1922 and 1926), and four years where inflation was not increasing or decreasing significantly (1924-1925 and 1927-1928).
Figure 1. U.S. Federal Deficit Spending and Inflation for the Fiscal Years 1923 – 1929
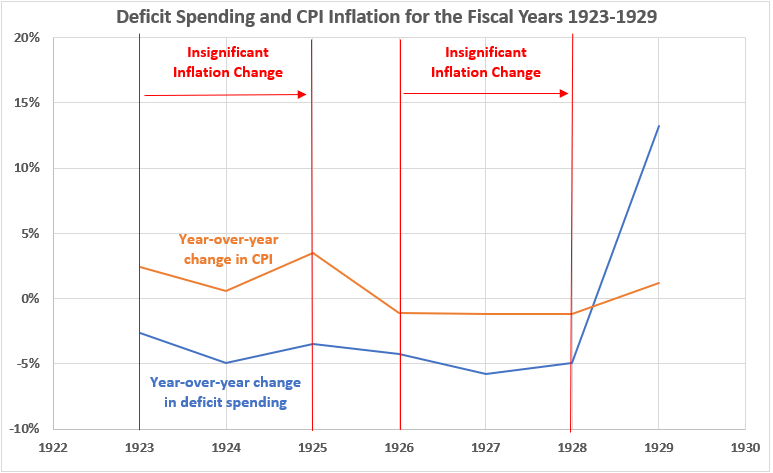
The 1920s were a period where federal budgets were consistently in surplus (1929 excepted) and only two of the years were part of an inflation surge. Figure 1 shows the changes in federal spending and consumer inflation for the years including the two periods without significant inflation changes.
Figure 2. Annual Changes in Deficit Spending vs. Inflation for the Fiscal Years 1923-1929
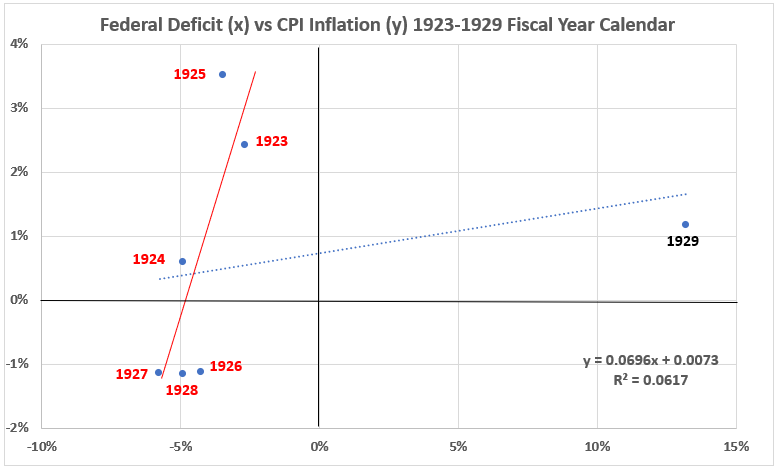
The years 1923-1928, which contain the data for the years 1923-1928 covering the two periods with insignificant inflation, have a significant positive correlation (R2 = 61%, R =78%). The adjoining year, 1929, clearly falls outside the group of the other years.
Note: The data for each fiscal year is the 12-month change in that year. Thus the data for in this work for 1923 is the same as the data for the first day of 1924. The change for the two-year period 1924-1925 is the change from the first day of 1924 (same as the last day of 1923) to the last day of 1925. The same applies to 1926 and the interval 1927-1928. This can be seen in Figure 1. To generalize, n+1 data points are required to define a change over a period of n years.
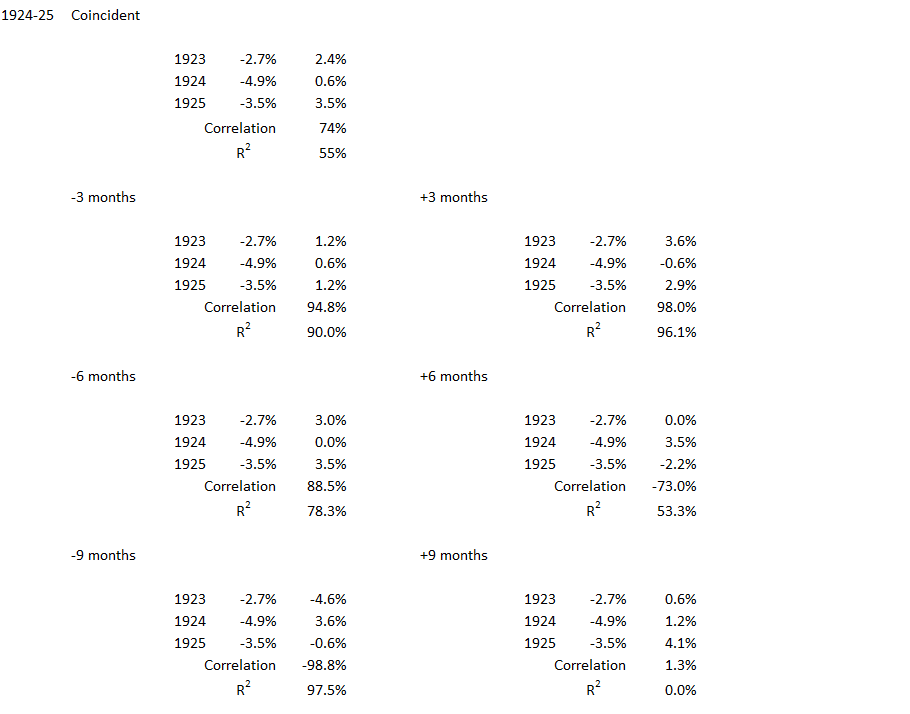
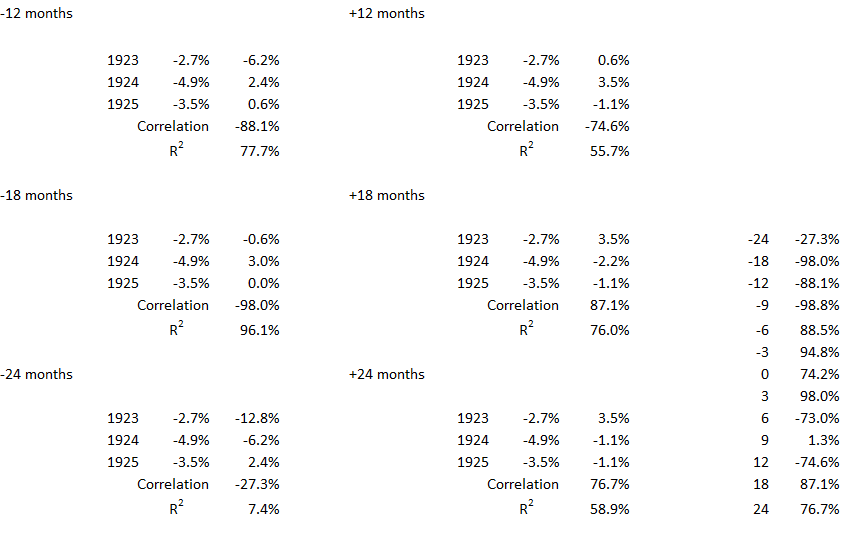
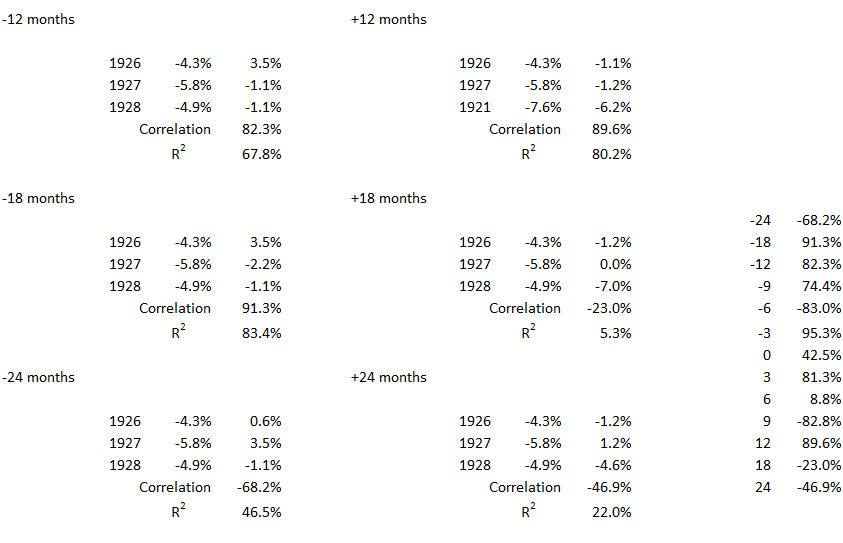
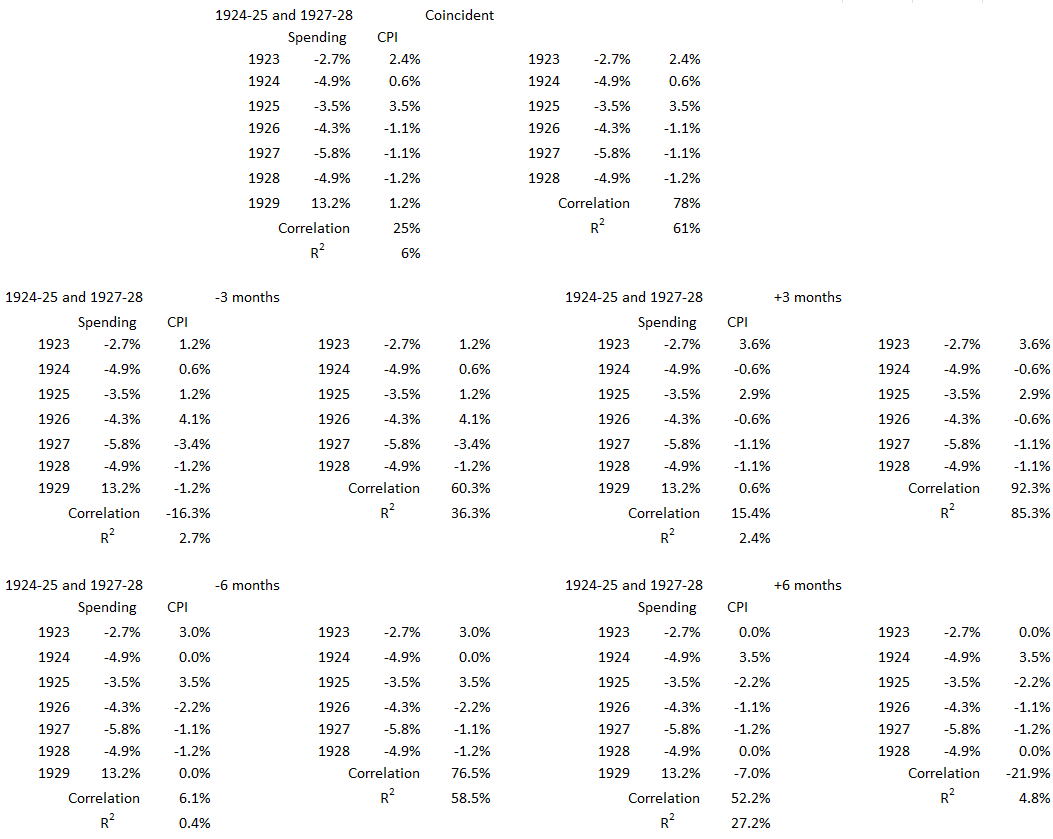
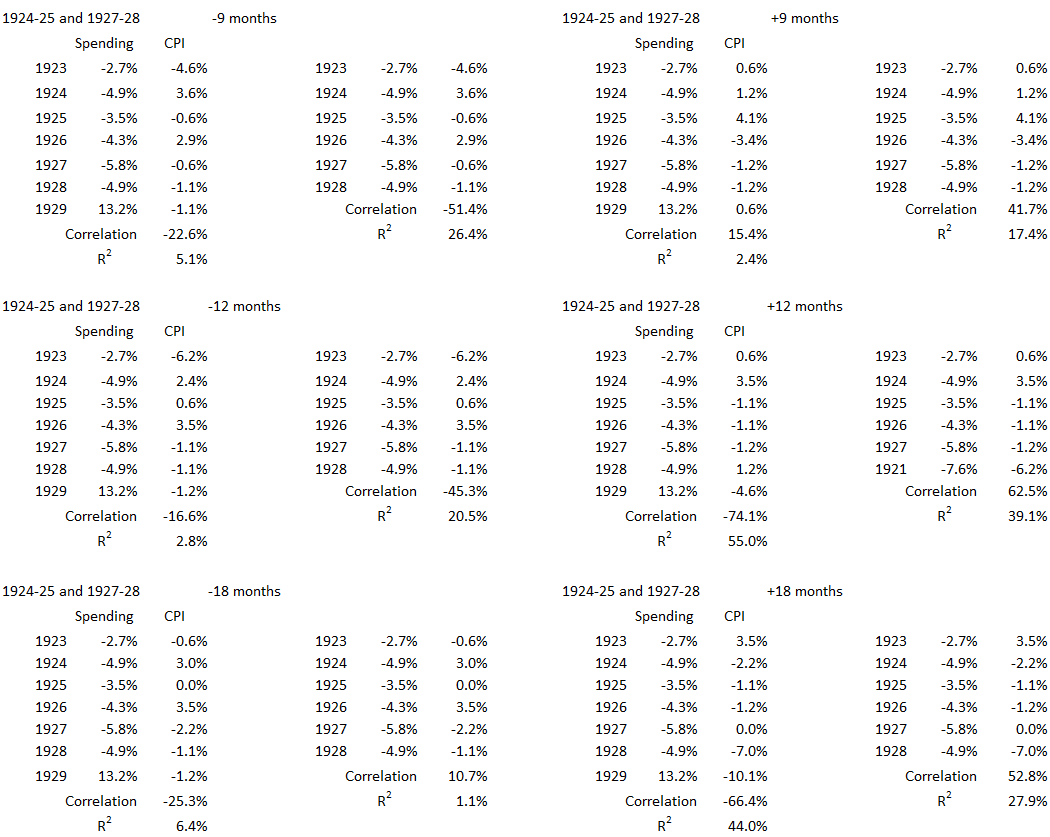
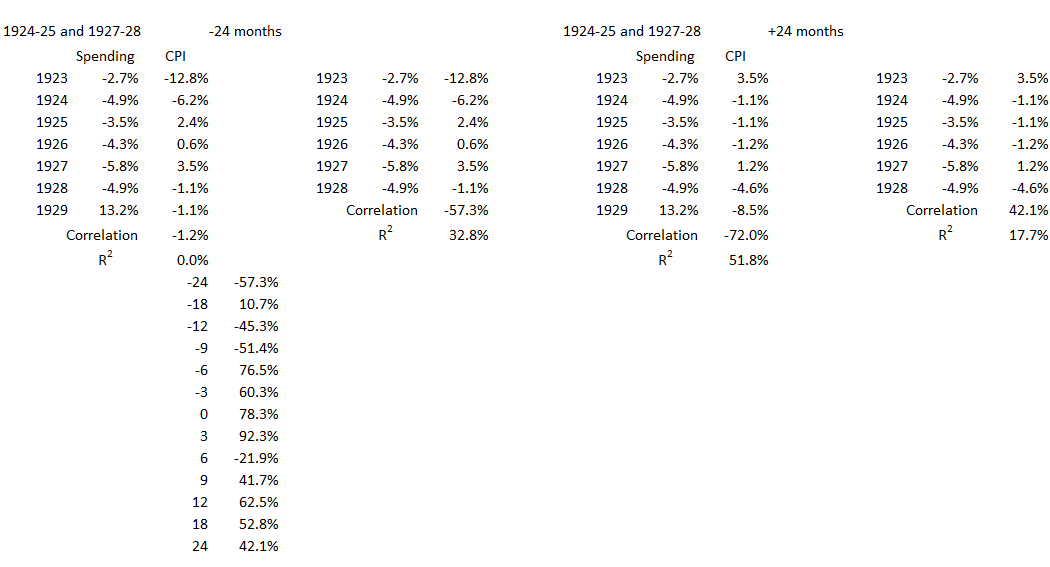
Figure 3. Correlation Between Deficit Spending and Inflation 1924-1925
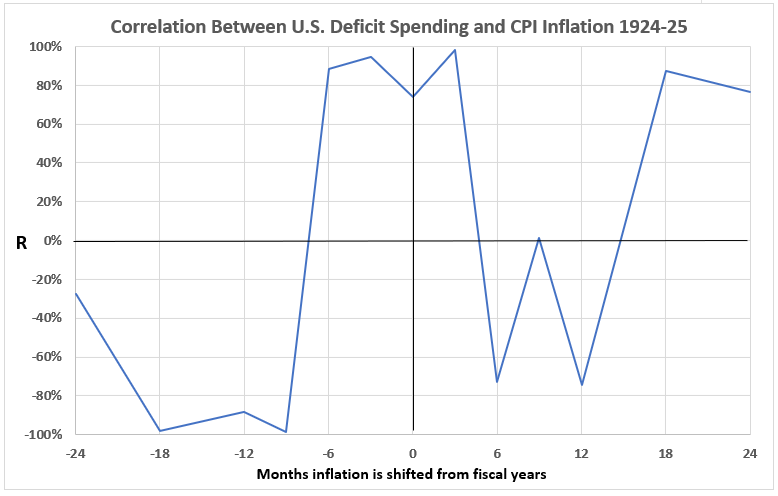
Figure 4. Correlation Between Deficit Spending and Inflation 1927-1928
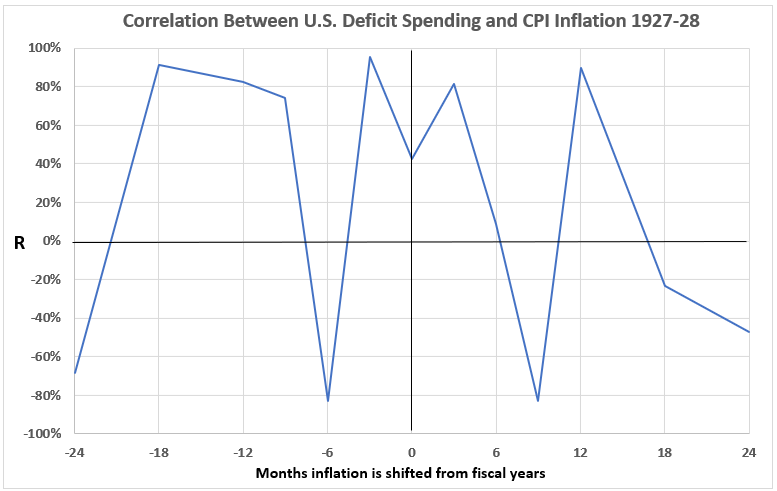
The data displayed in Figure 1 and Figure 2 are for inflation data and deficit spending data both aligned to the fiscal year (July 1, 1923 – June 30, 1924 for federal fiscal year 1924). In Figure 3 and Figure 4, the correlations are shown for shifting inflation data by ±3, ±6, ±9, ±12, ±18, and ±24 months with respect to the fiscal year calendar. The purpose is to see if inflation changes might lead to fiscal spending changes or vice versa.
Both Figure 3 and Figure 4 show significant and moderate correlations for coincident data and for shifts near to coincident. In Figure 3, coincident, ±3, and -6 data show significant (strong) associations between federal spending and inflation. The coincident data shows a moderate correlation in Figure 4, while significant correlations are found for offsets of -18, ±12, -9, and ±3.
These results suggest that inflation changes causing federal spending changes are possible during this time period. Also, it is possible that federal spending changes might cause inflation changes. But the results are not proof of cause and effect. Additional data is required to strengthen the possibilities of cause and effect.
1937
The 1930s show only one year with an insignificant inflation change. Only the 1940s and 1960s are more unsettled with no years being part of an insignificant inflation change.
Figure 5. U.S. Federal Deficit Spending and Inflation for the Fiscal Year 1935-1938
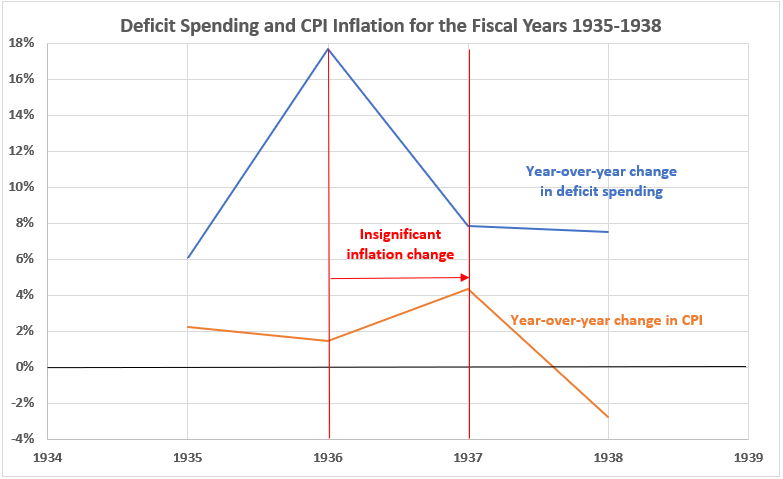
Figure 6. Annual Change in Deficit Spending vs. Inflation for the Fiscal Year 1935-1938
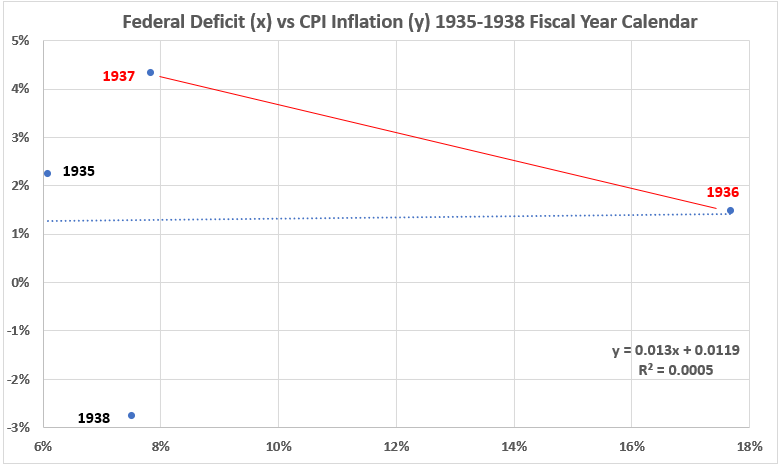
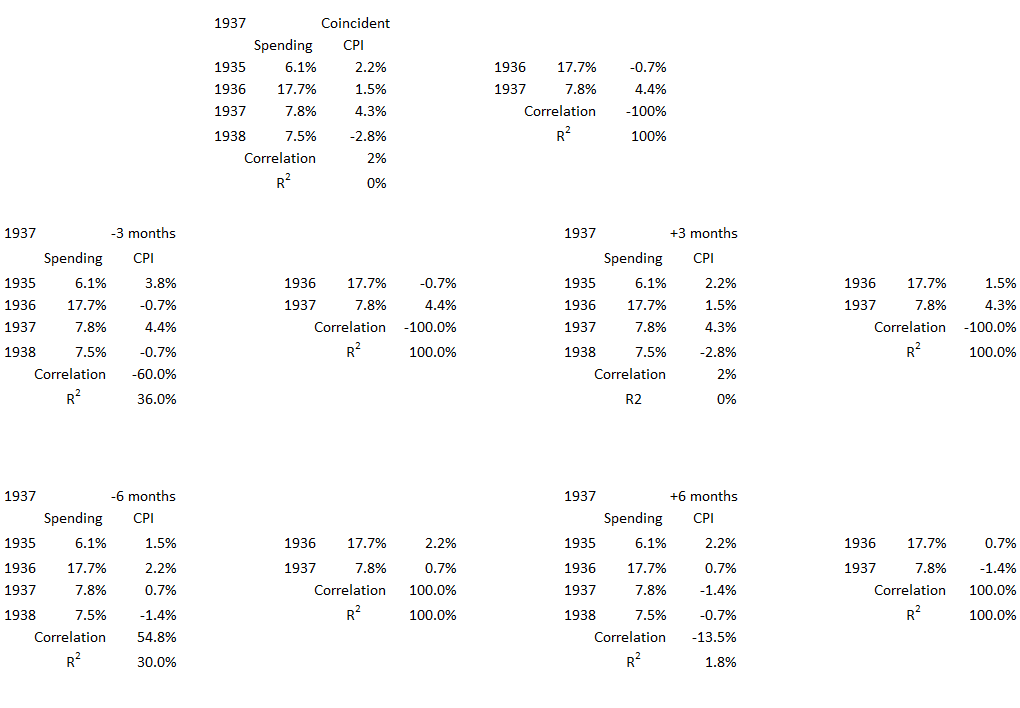
There is a negligible correlation between federal deficit spending and coincident consumer inflation during the four years that include 1937 (R = 2%). For the year 1937 itself, the correlation is negative (R = –100%).
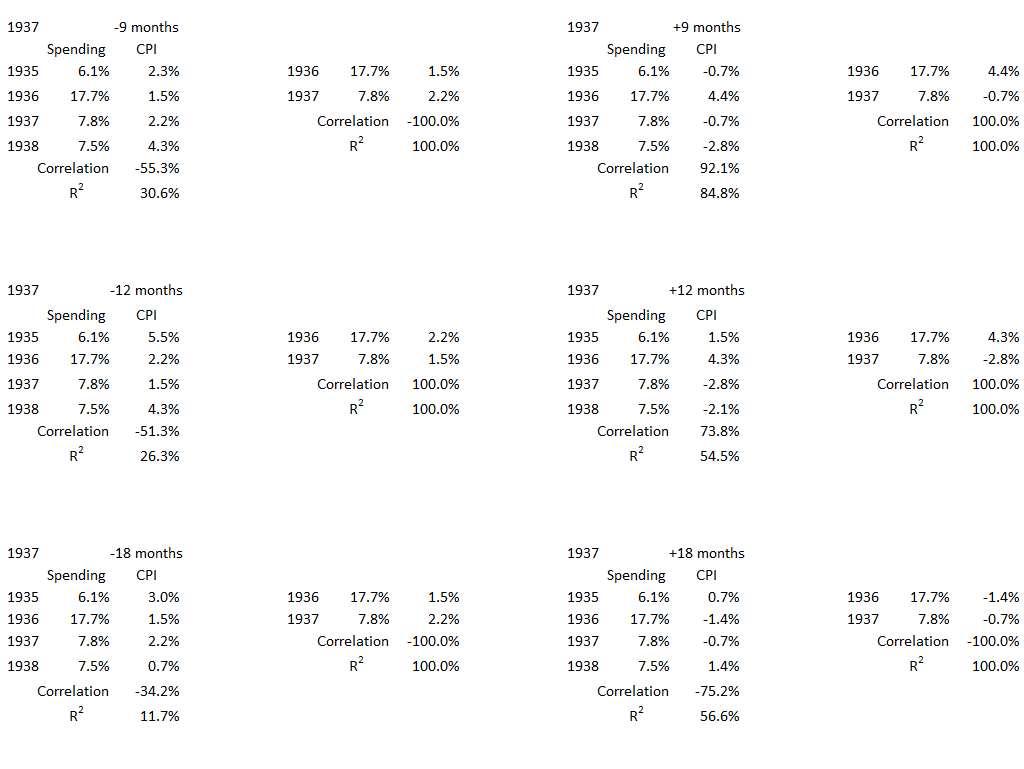
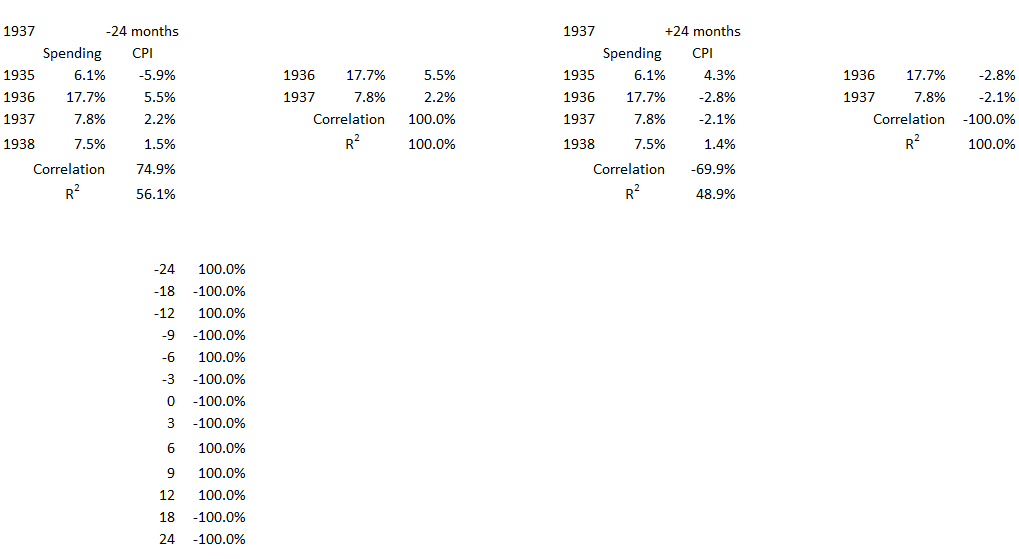
Figure 7. Correlation Between Deficit Spending and Inflation 1937
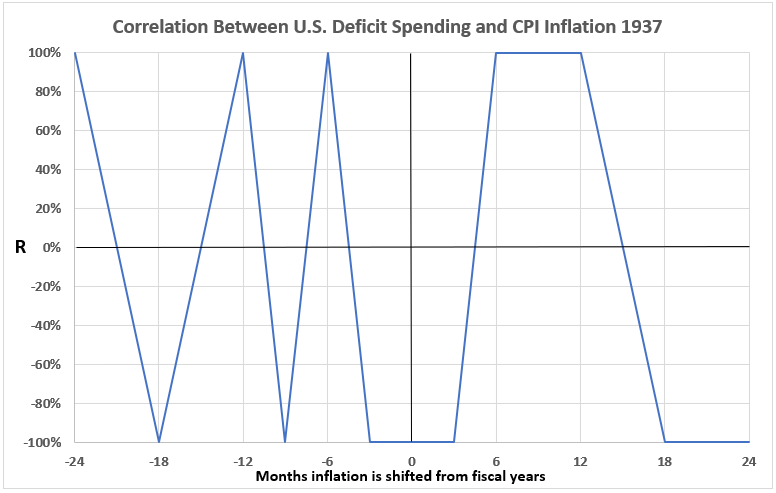
There are alternating correlations of 100% and –100%. It is not clear what to make of such a result. Correlations are based on distributions and when there are only two pairs of data points, such distribution analysis may not be applicable.
1956-1959
Figure 8. U.S. Federal Deficit Spending and Inflation for the Fiscal Years 1955-1960
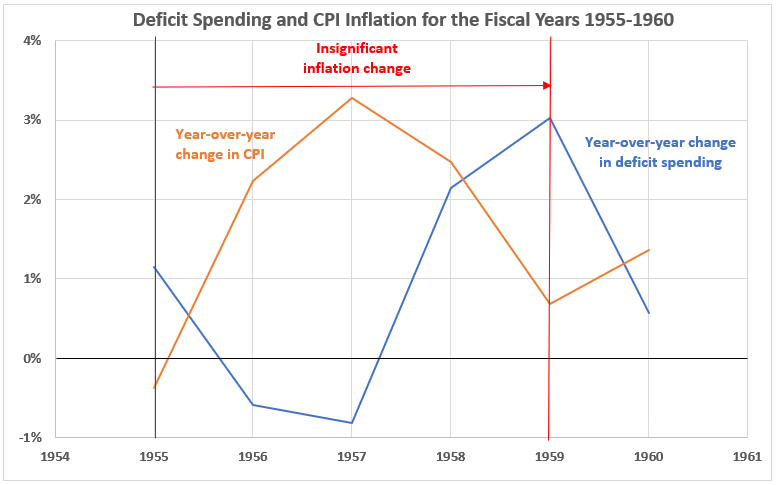
Consumer inflation changes and federal deficit spending changes moved in opposite directions each of the four years of this calm inflation period. The period had two years of federal surpluses and four years of modest deficits (<1% to 3%).
Figure 9. Annual Change in Deficit Spending vs. Inflation for the Fiscal Years 1955-1960
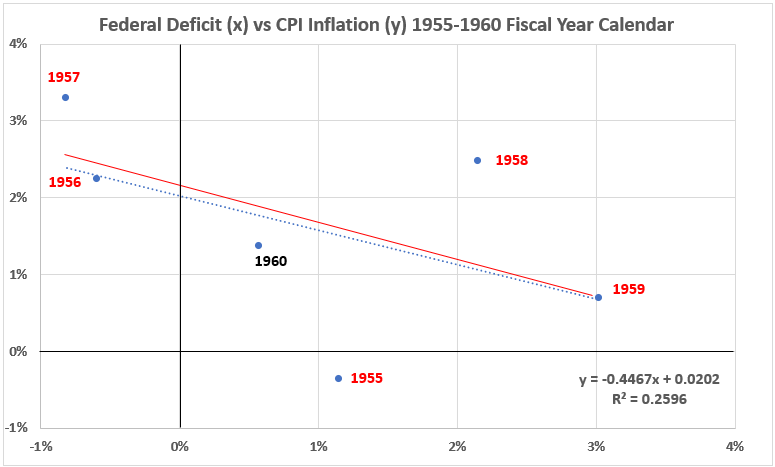
There are moderate negative correlations in this time period and for the four fiscal years with insignificant inflation changes. For the four years R = –51% and for all six years R = –52%.
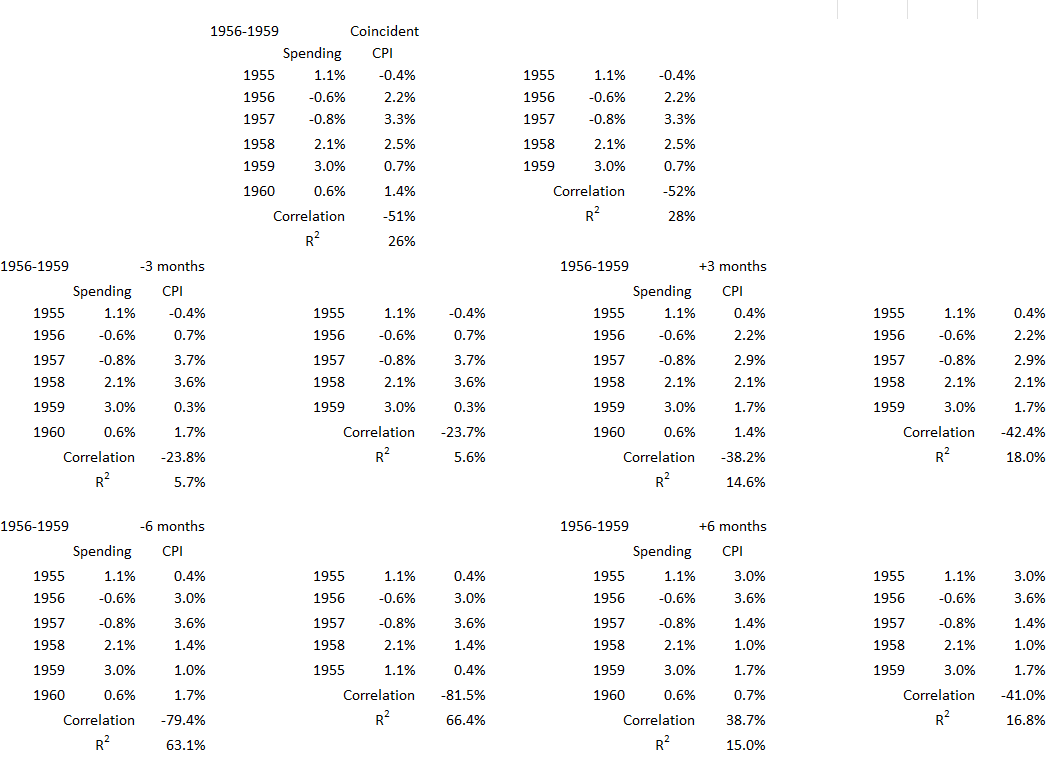
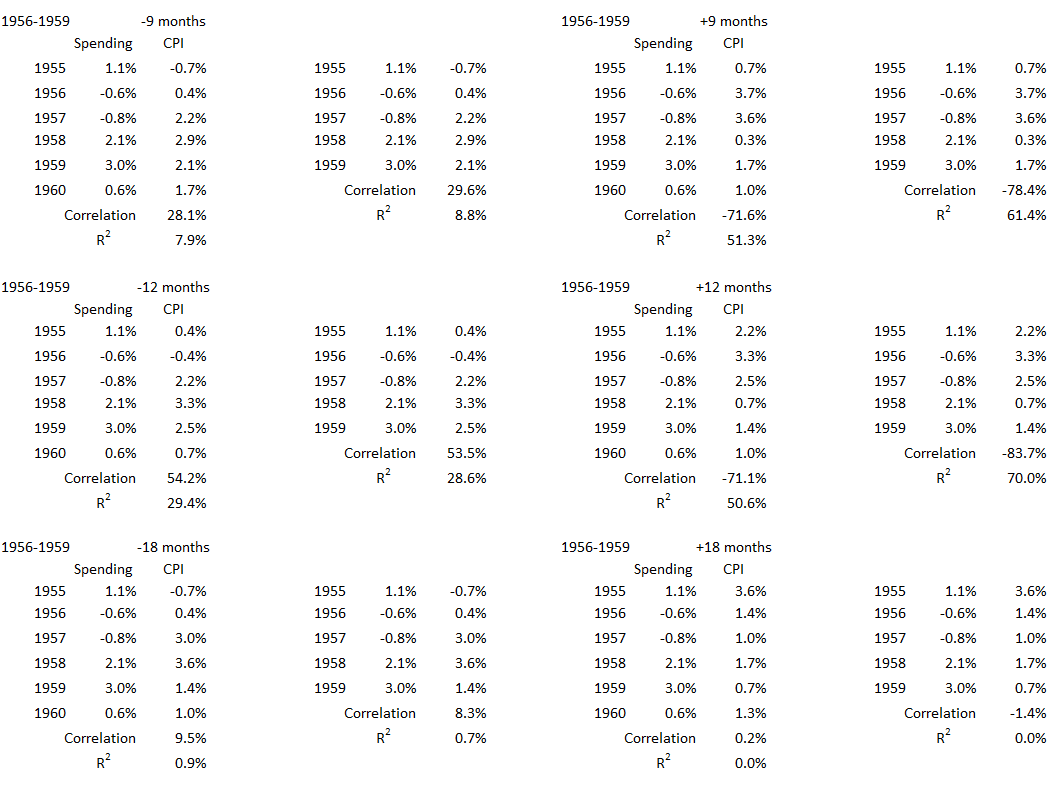
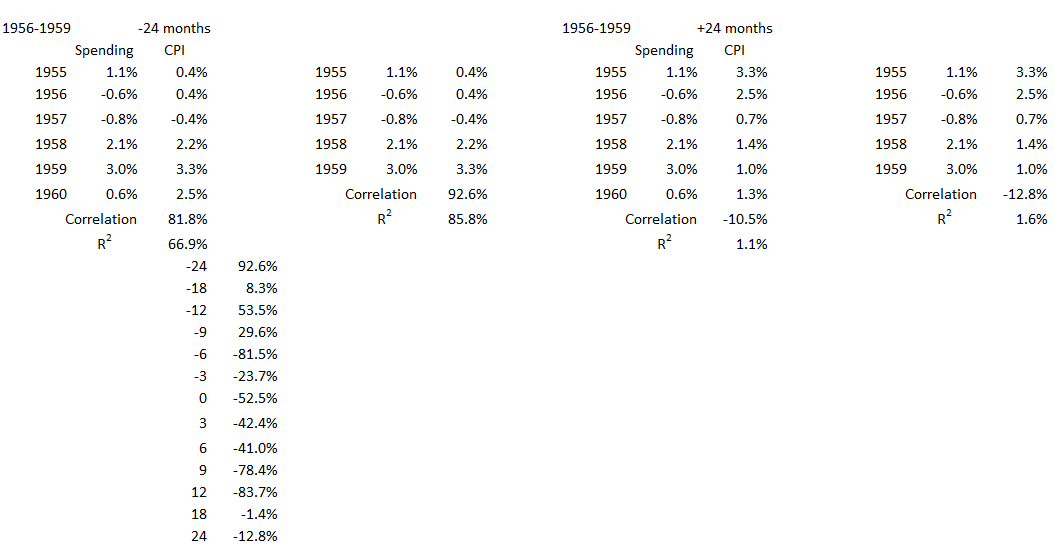
Figure 10. Correlation Between Deficit Spending and Inflation 1956-1959
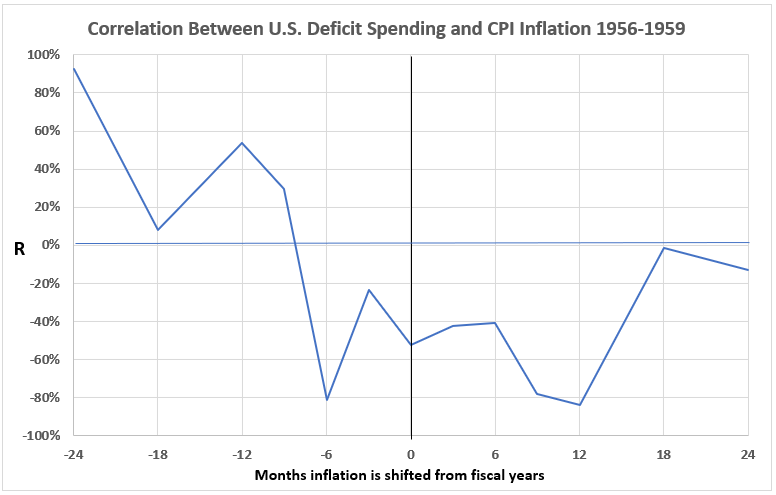
There is no possibility that deficit spending had any causal impact on inflation during this period. There is the possibility that inflation caused changes in government spending here, but only with inflation lead times of 12 and 24 months.
1970-1972
This was the “Vietnamization” period of the Vietnam War as U.S. troops in Vietnam were reduced from 549,000 in 1969 to 69,000 by the end of 1972.5
Figure 11. U.S. Federal Deficit Spending and Inflation for the Fiscal Years 1968-1973
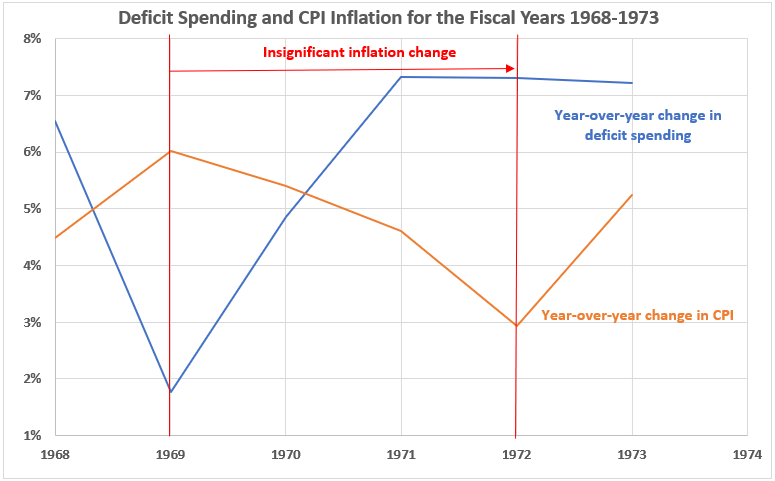
For 1970 and 1971, inflation and deficit spending changes moved in opposite directions. In 1972, there was a slight decline in deficit spending and a 2.7% drop in inflation.
Figure 12. Annual Change in Deficit Spending vs. Inflation for the Fiscal Years 1968-1973
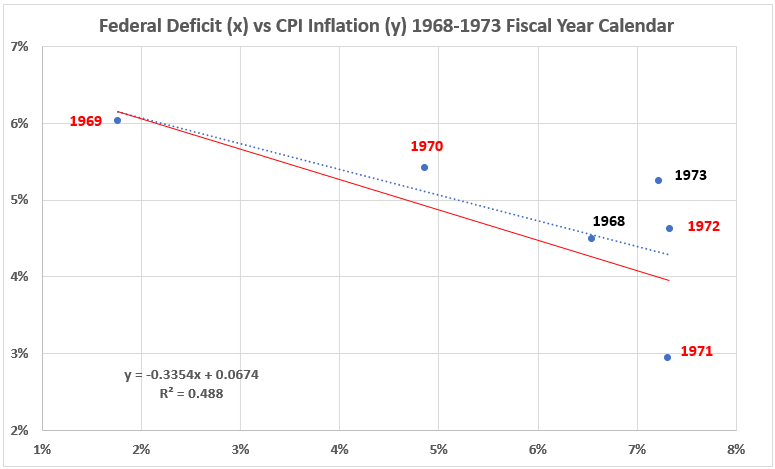
For both the three-year period with insignificant inflation changes and the entire six-year period, the correlations for fiscal year data are strongly negative. For 1970-1972, R = –82%, and for the entire six years, R = – 70%.
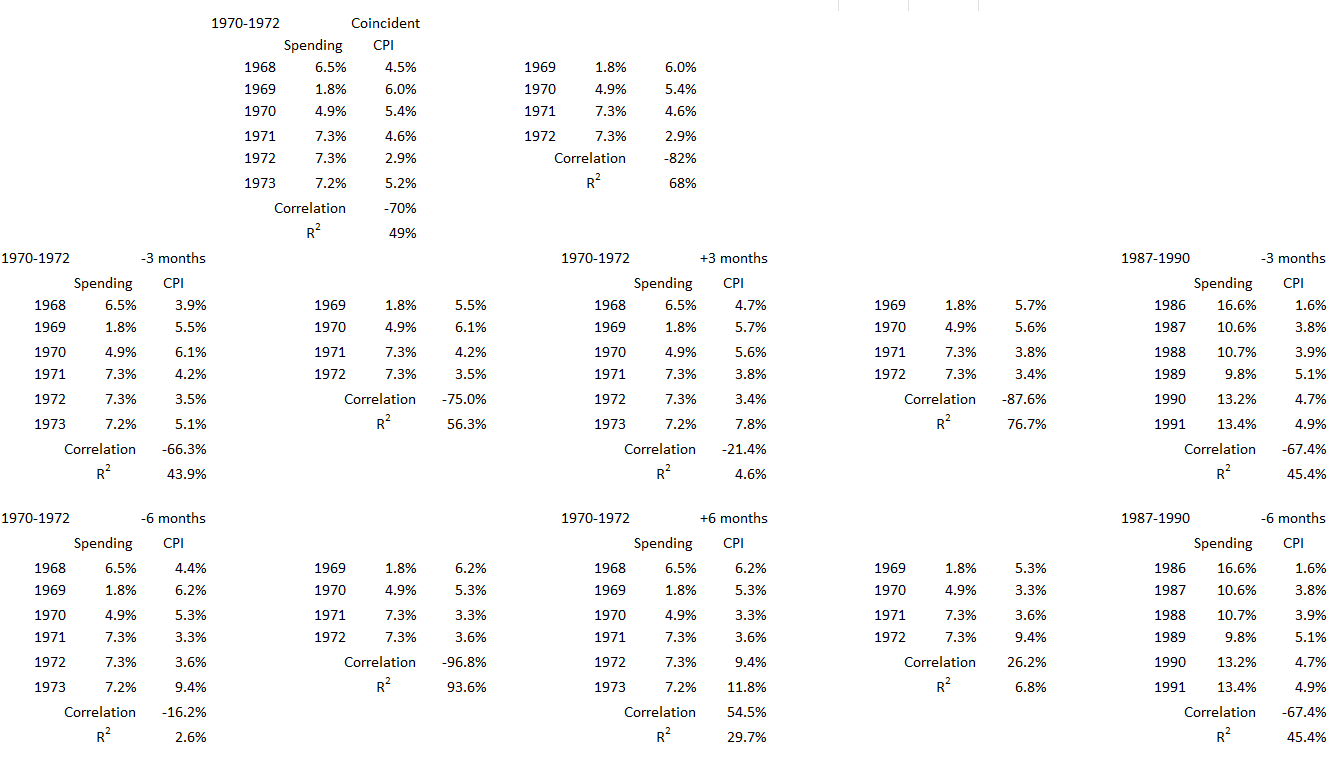
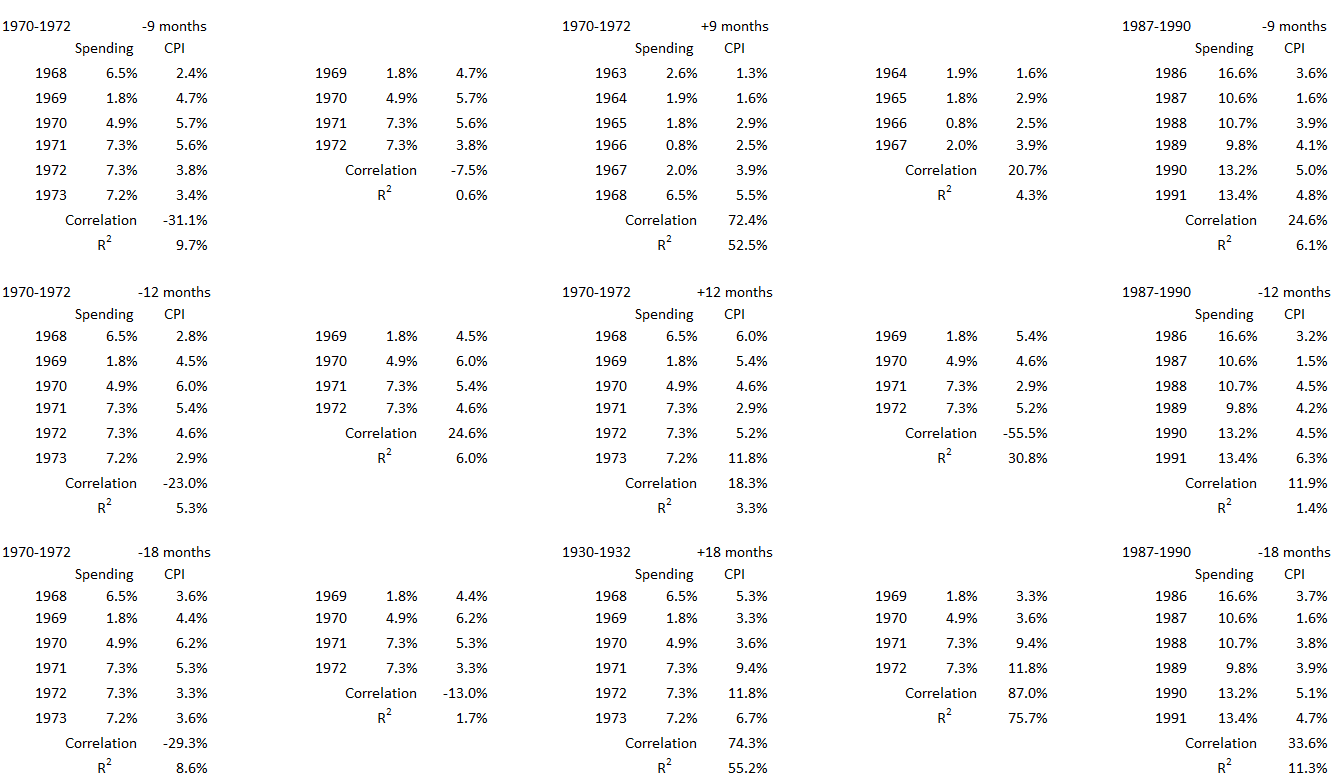
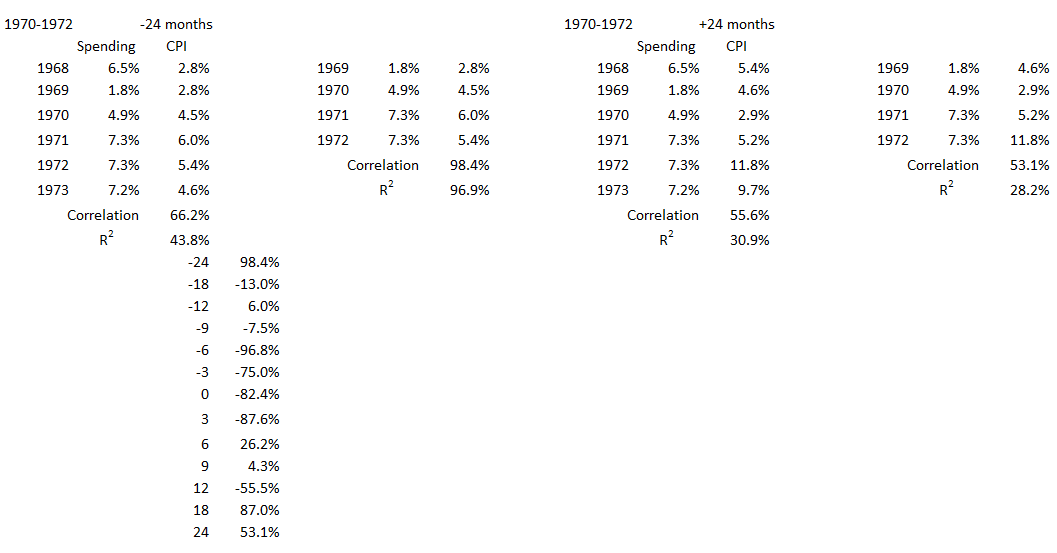
Figure 13. Correlation Between Deficit Spending and Inflation 1970-1972
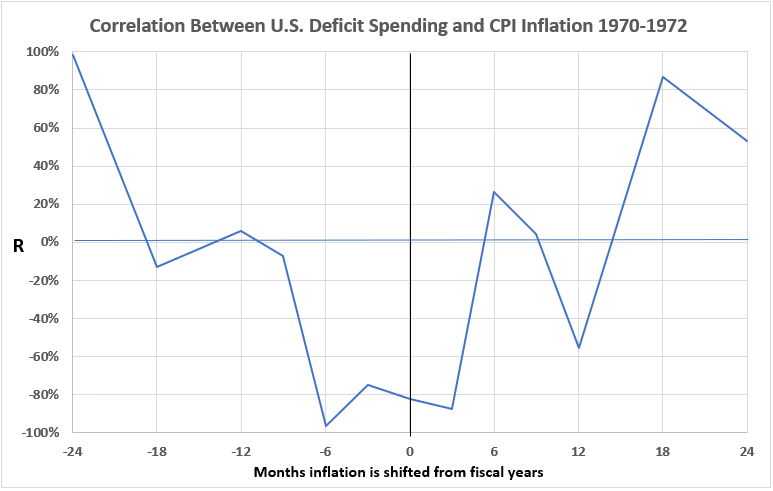
The only possibilities for moderate or strong cause-and-effect relationships are for inflation leading to changed deficit spending 24 months later; and for deficit spending leading to inflation 18 and 24 months later.
1999-2020
This 22-year time period covers a time of two major financial shocks. The first of them was the bursting of the dot.com bubble from 2000-2002, which saw stock markets tumble. The NASDAQ Composite crashed by more than 76%, and the Nasdaq 100 was down over 80%. The second was the housing bubble crash and financial fallout known as the Great Financial Crisis of 2008 and the Great Recession of 2008-09. During this time period, federal deficits varied from near zero to three years over 10%. In 2009, the federal deficit was more than 18%. Yet throughout this period, there were no significant surges in inflation or disinflation.
Figure 14. U.S. Federal Deficit Spending and Inflation for the Fiscal Years 1998-2020
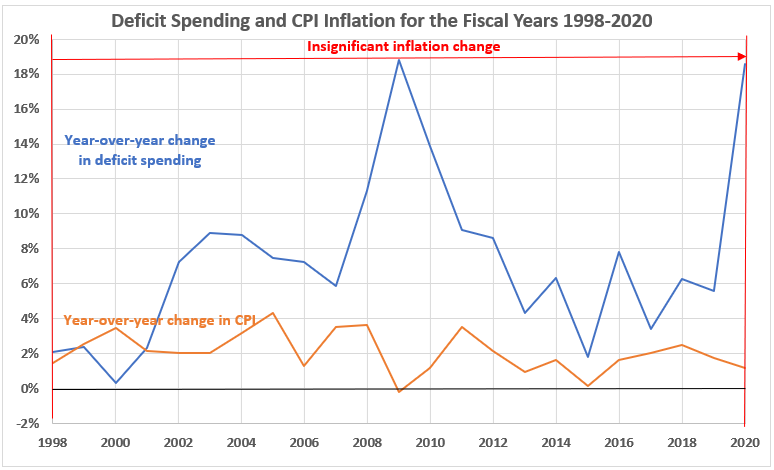
As already discussed, deficit spending turmoil had seemingly little impact on consumer inflation over these 22 years.
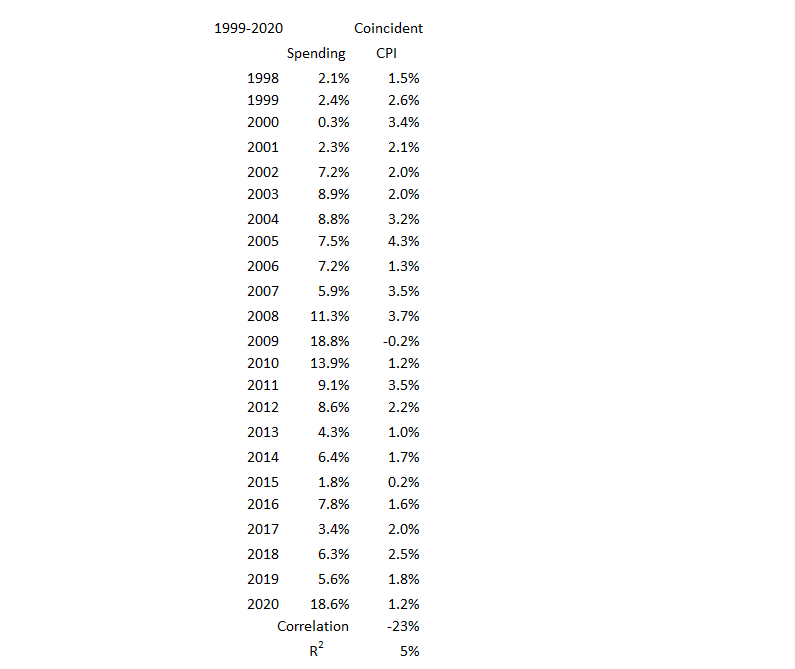
Figure 15. Annual Change in Deficit Spending vs. Inflation for the Fiscal Years 1998-2020
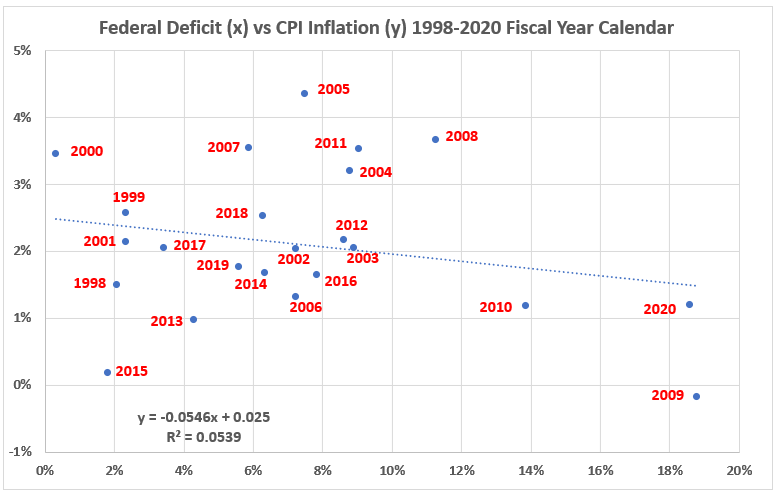
The correlation of deficit spending with inflation over these 22 years is negative (R = –23%, R2 = 5%). The shape of the scatter plot is close to that of an oval (think misshapen football). This indicates that the distribution of data is suitable for a meaningful calculation of correlation.6
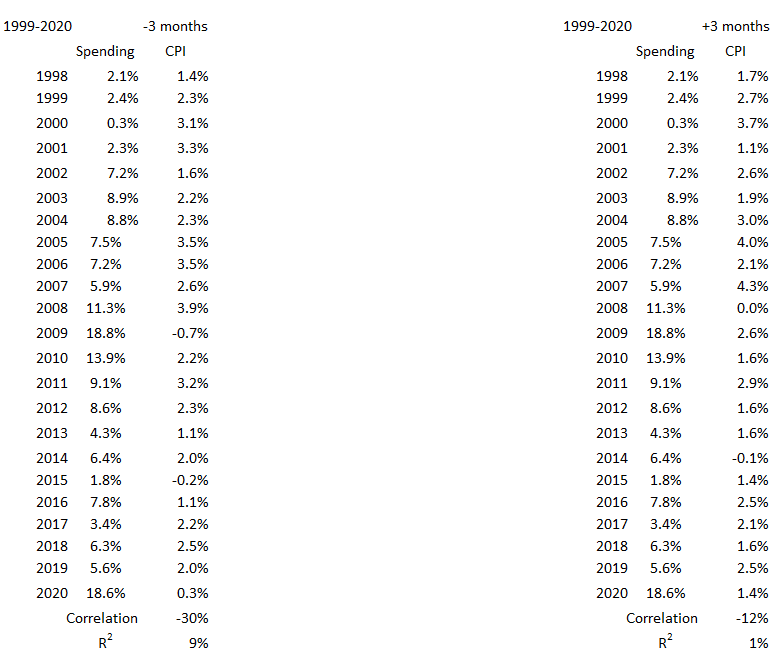
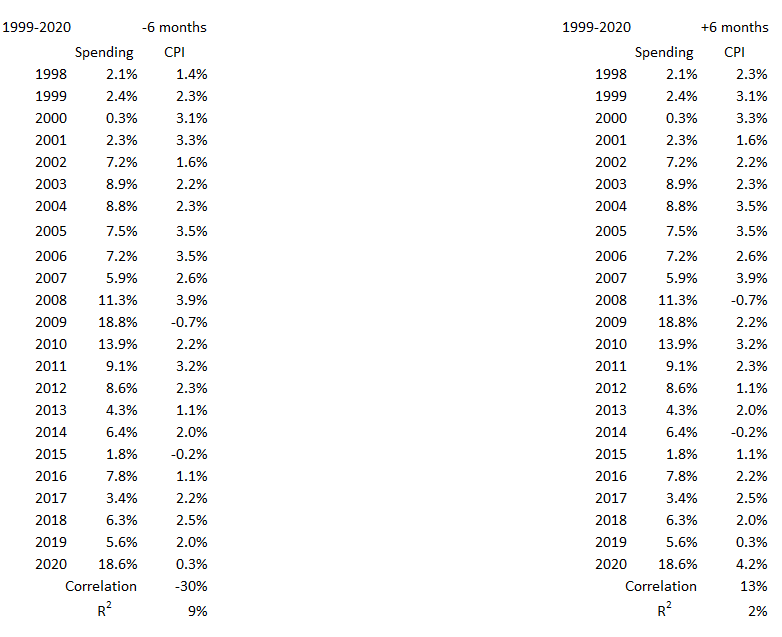
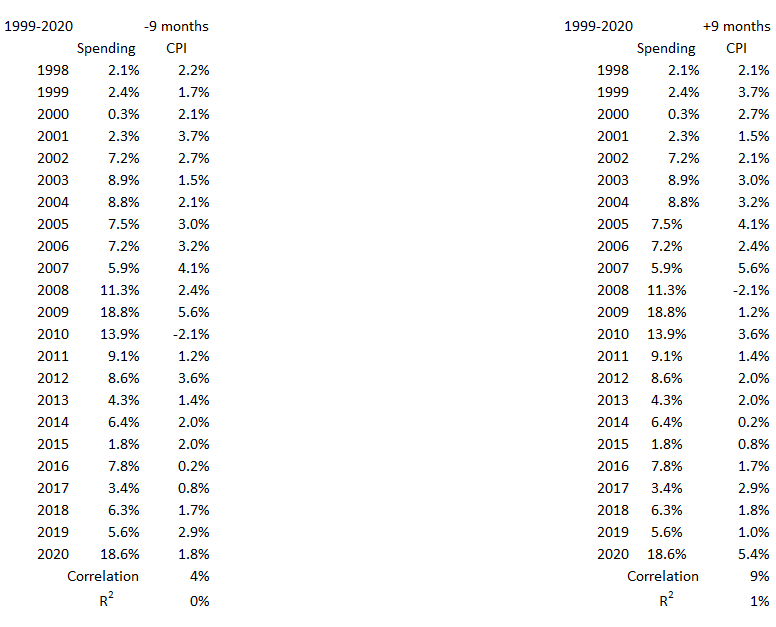
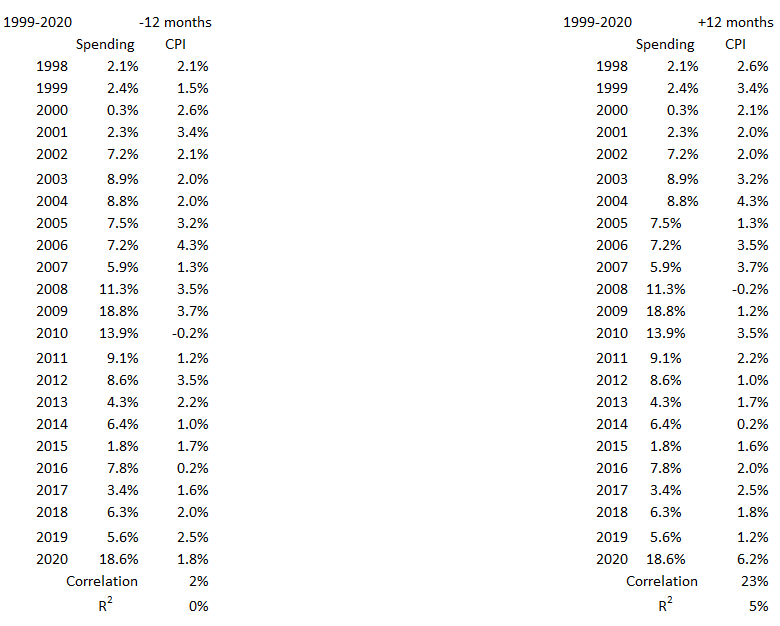
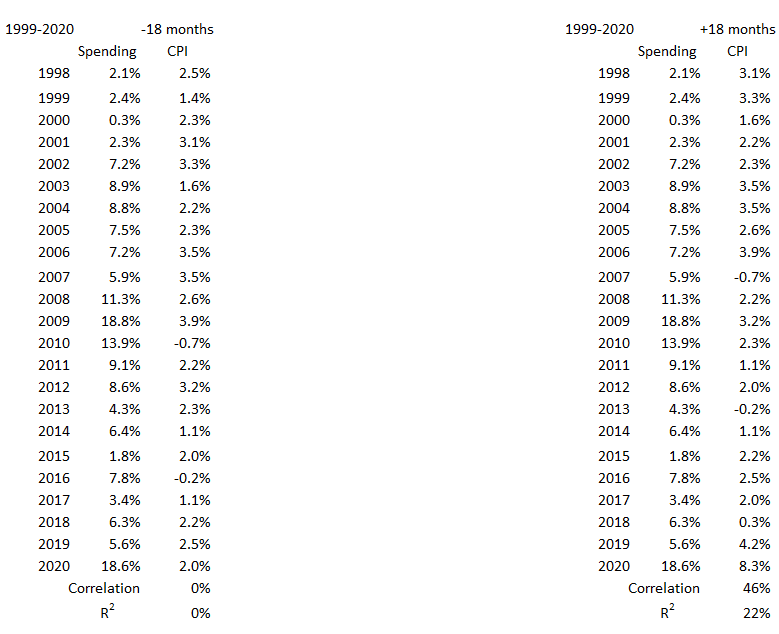
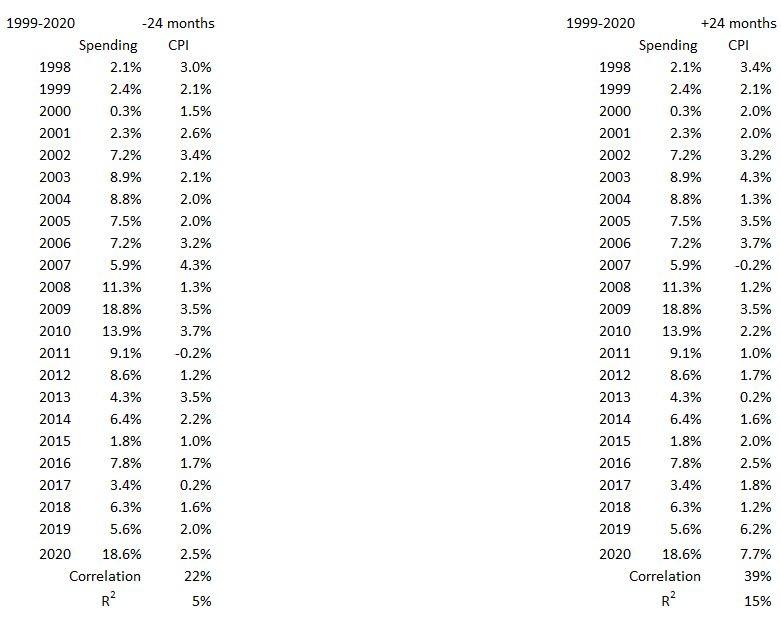
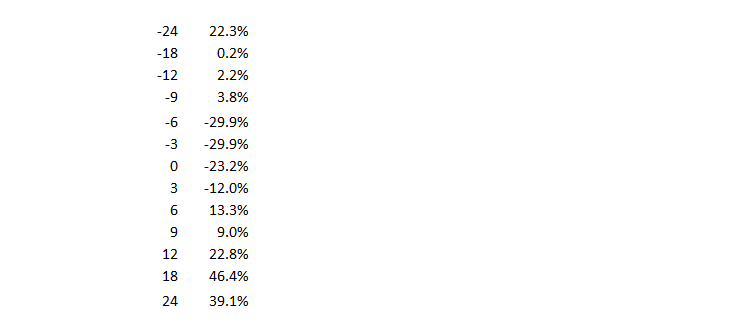
Figure 16. Correlation Between Deficit Spending and Inflation 1998-2020
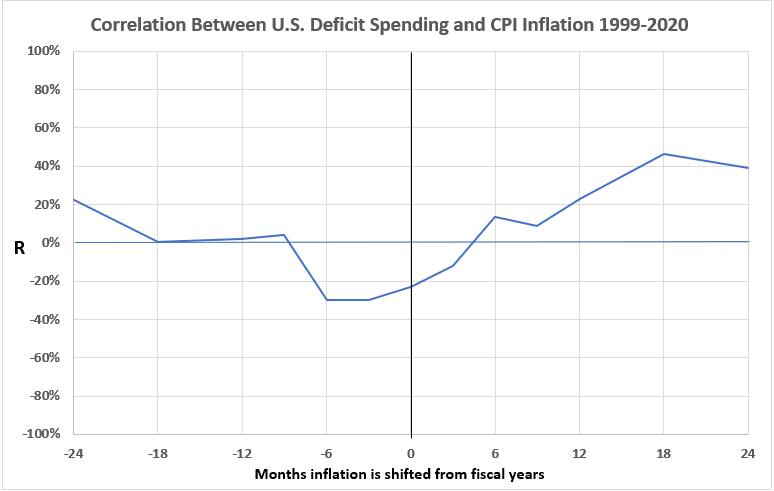
There is a weak correlation between deficit spending and inflation 18 and 24 months after deficit spending. There is a very weak correlation between deficit spending and inflation 24 months before deficit spending and 12 months after. For the other nine offsets, there is either nil or negative correlation. The possibilities for cause-and-effect relationships here are not very promising.
Conclusion
Table 2 shows definitions for correlations in this study.
Table 2. Definitions Regarding Correlations

Table 3, using the classifications in Table 2, summarizes the analysis results.
Table 3. Correlations for Inflation w/o Surges and Federal Deficits 1914-2022
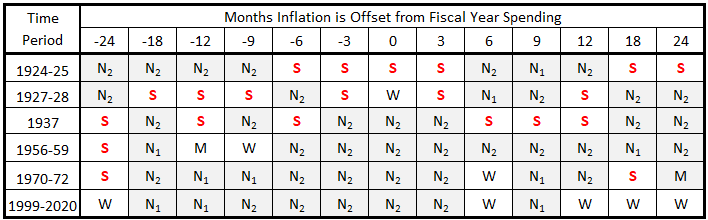
All the significant cells contain a red S, and all the null and negative cells are shaded light gray. This has been done to improve focus when scanning the table.
From Table 3 we draw the following conclusions:
- It is possible that inflation caused deficit spending and deficit spending caused inflation for the three time periods before World War II (1924-25, 1927-28, and 1937).
- After World War II, the likelihood that there were cause-and-effect relationships between inflation and federal deficit spending diminished.
- In the 21st century cause-and-effect relationships between inflation and deficit spending for the years 1999 through 2020.
The next and final installment in this series will review all work done, with a concentration on the study of the performative years of inflation surges, disinflation/deflation surges, and the years not part of any surge (this article’s work). It is hoped, but not guaranteed, that this will be reported next weekend.
Appendix
In this appendix, we show all the data selections used to analyze each of the periods without significant surges of inflation, either up or down. The data are from the tables in Part 13A, Appendix 1.4
1924-1925
1927-1928

1924-1925 and 1927-1928
1937
1956-1959
1970-1972
1999-2020
Footnotes
1. Lounsbury, John, “Government Spending and Inflation. Part 13B”, EconCurrents, June 25, 2023. https://econcurrents.com/2023/06/25/government-spending-and-inflation-part-13b/
2. Lounsbury, John, “Government Spending and Inflation. Part 14B – Deflation”, EconCurrents, July 9, 2023. https://econcurrents.com/2023/07/09/government-spending-and-inflation-part-14b-deflation/.
3. Lounsbury, John, “Government Spending and Inflation. Part 11”, EconCurrents, May 7, 2023, Tables 15 and 16.
https://econcurrents.com/2023/05/07/government-spending-and-inflation-part-11/.
4. Lounsbury, John, “Government Spending and Inflation. Part 13A, Appendix 1”, EconCurrents, June 4, 2023. https://econcurrents.com/2023/06/04/government-spending-and-inflation-part-13a/.
5. history.com, Vietnam War Timeline, September 13, 2017, Updated March 29, 2023. https://www.history.com/topics/vietnam-war/vietnam-war-timeline.
6. Freedman, David, Pisani, Robert, Purves, Robert, “Statistics, Fourth Edition,” W.W. Norton & Company, New York; Viva Books, New Delhi, 2009. pp. 121-140.