NOAA Updates its Seasonal Outlook on June 20, 2024 – Similar to the Outlook Issued last Month – Posted on June 21, 2024

On the third Thursday of the month right on schedule NOAA issued their updated Seasonal Outlook which I describe as their Four-Season Outlook because it extends a bit more than one year into the future. The information released also included the Mid-Month Outlook for the following month plus the weather and drought outlook for the next three months.  I present the information issued by NOAA and try to add context to it. It is quite a challenge for NOAA to address the subsequent month, the subsequent three-month period as well as the twelve successive three-month periods for a year or a bit more.

With respect to the long-term part of the Outlook which I call the Four-Season Outlook, there is a rapid transition from Neutral to LaNina. So getting the timing right is challenging. We are now in ENSO Neutral. La Nina is the likely scenario for this summer almost to the end of the forecast period. The Outlook beyond June has not been significantly changed from what was issued last month. This suggests increasing confidence in the outlook.  The forecast is a canonical La Nina plus trends.

First, Let’s Take a Look at the (mid-month) Outlook for July
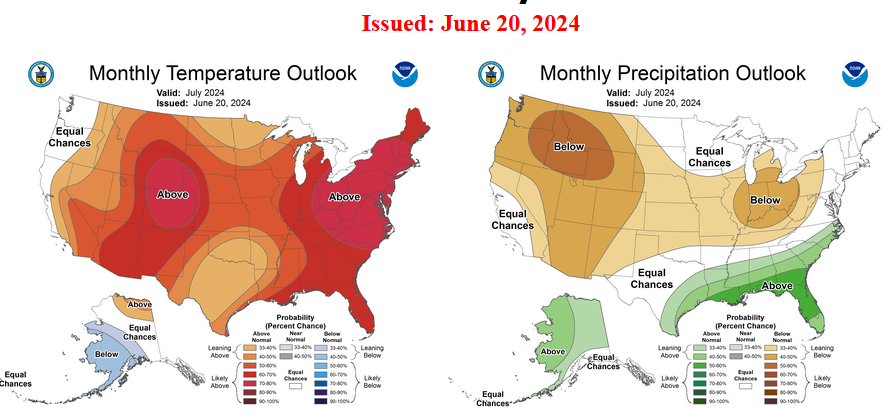
It will be updated on the last day of June.
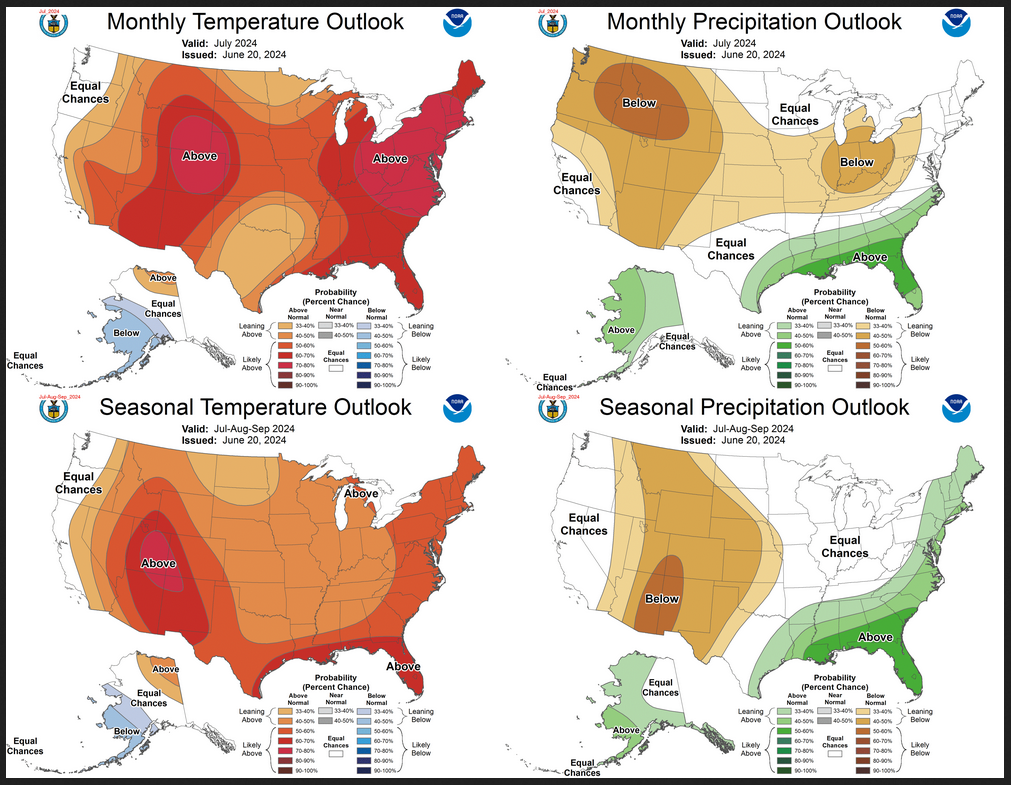
The top row is what is now called the Mid-Month Outlook for next month which will be updated at the end of this month. There is a temperature map and a precipitation map. The second row is a three-month outlook that includes next month.  I think the outlook maps are self-explanatory. What is important to remember is that they show deviations from the current definition of normal which is the period 1991 through 2020.  So this is not a forecast of the absolute value of temperature or precipitation but the change from what is defined as normal or to use the technical term “climatology”.

Notice that the Outlook for next month and the three-month Outlook are somewhat different, especially about precipitation.  This tells us that August and September will be different than July to some extent.

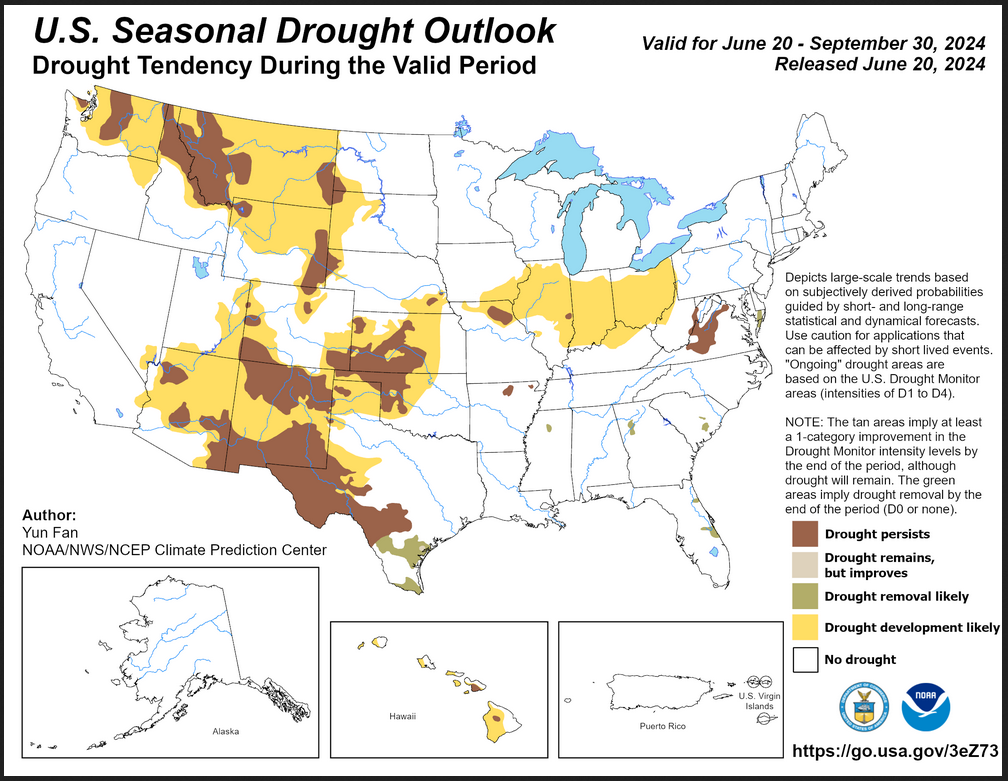
The expansion of the area impacted by drought is extensive.

The full NOAA Seasonal Outlook extends through July/August/September of 2025 (yes that is more than a year out). All of these maps are in the body of the article. Large maps are provided for July and the three-month period July/August/September.  Small maps are provided beyond that through July/August/September of 2025 with a link to get larger versions of these maps.

NOAA provides a discussion to support the maps. It is included in the body of this article. In some cases, one will need to click on “read more” to read the full article.  For those on my email list where I have sent the url of the article, that will not be necessary.

NOAA Updates its Seasonal Outlook on February 15, 2024 – MJO, Neg AO, Possible SSW Make the March Outlook Quite Interesting

On the third Thursday of the month right on schedule NOAA issued their updated Seasonal Outlook which I describe as their Four-Season Outlook because it extends a bit more than one year into the future. The information released also included the Mid-Month Outlook for the following month plus the weather and drought outlook for the next three months.  I present the information issued by NOAA and try to add context to it. It is quite a challenge for NOAA to address the subsequent month, the subsequent three-month period as well as the twelve successive three-month periods for a year or a bit more.

With respect to the long-term part of the Outlook which I call the Four-Season Outlook, there is a fairly rapid transition from El Nino to ENSO Neutral to LaNina. So getting the timing right is very challenging.

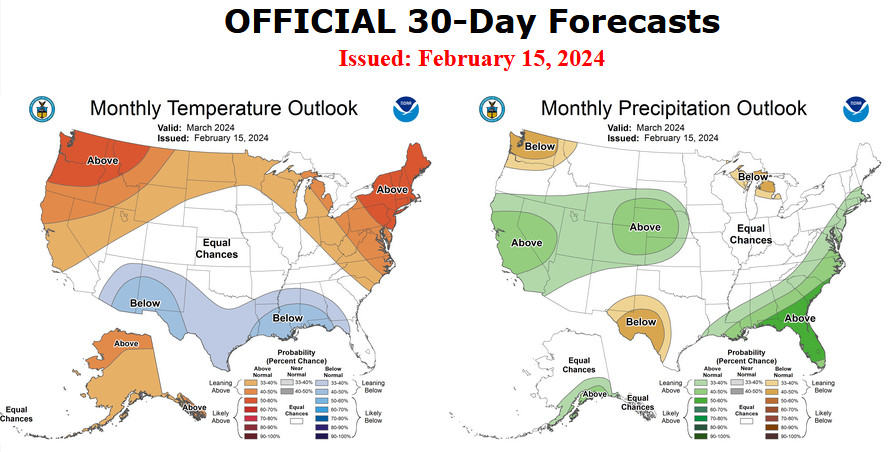
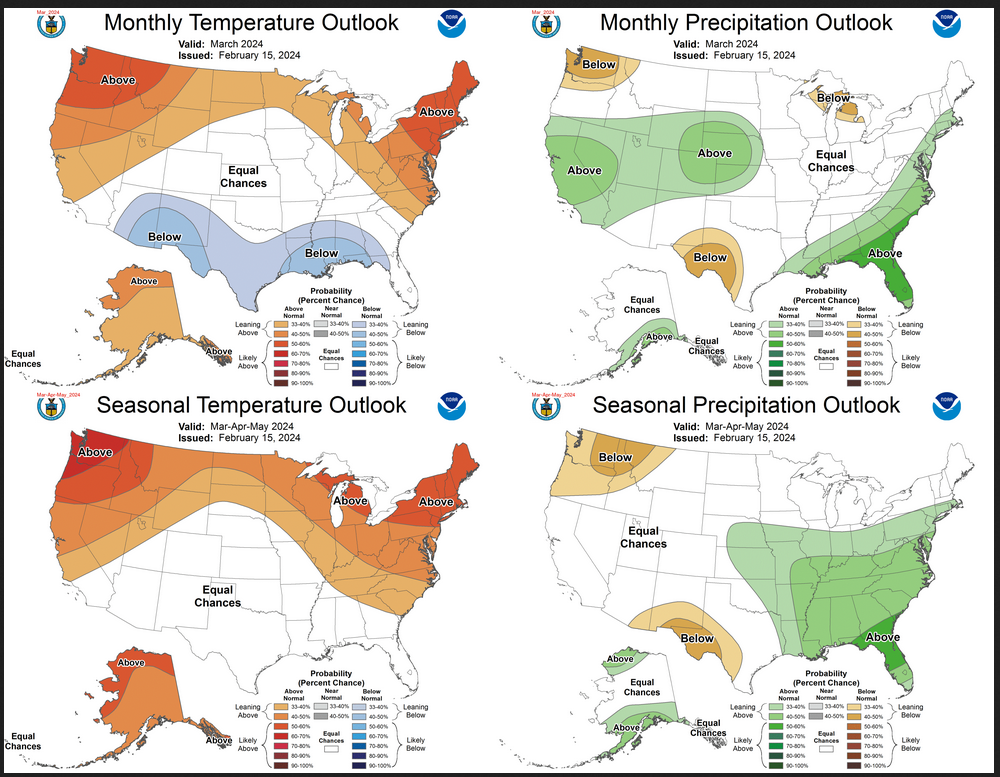
First, Let’s Take a Look at the (mid-month) Outlook for March.

It will be updated on the last day of February

The top row is what is now called the Mid-Month Outlook for next month which will be updated at the end of this month. There is a temperature map and a precipitation map. The second row is a three-month outlook that includes next month.  I think the outlook maps are self-explanatory. What is important to remember is that they show deviations from the current definition of normal which is the period 1991 through 2020.  So this is not a forecast of the absolute value of temperature or precipitation but the change from what is defined as normal or to use the technical term “climatology”.

Notice that the Outlook for next month and the three-month Outlook are somewhat different.  This tells us that April and May will be different than March to some extent.

The full NOAA Seasonal Outlook extends through March/April/May of 2025. All of these maps are in the body of the article. Large maps are provided for March and the three-month period Mar/Apr/May.  Small maps are provided beyond that through May of 2025 with a link to get larger versions of these maps.

NOAA provides an excellent discussion to support the maps. It is included in the body of this article. In some cases, one will need to click on “read more” to read the full article.  For those on my email list where I have sent the url of the article, that will not be necessary.

NOAA Updates its Seasonal Outlook September 22, 2023 – Some Changes from what was Issued Last Month.

On the third Thursday of the month right on schedule NOAA issued their updated Seasonal Outlook which I describe as their Four-Season Outlook because it extends a bit more than one year into the future. The information released also included the Mid-Month Outlook for the following month plus the weather and drought outlook for the next three months.  I present the information issued by NOAA and try to add context to it. It is quite a challenge for NOAA to address the subsequent month, the subsequent three-month period as well as the twelve successive three-month periods for a year or a bit more. A seasonal drought outlook is also issued.

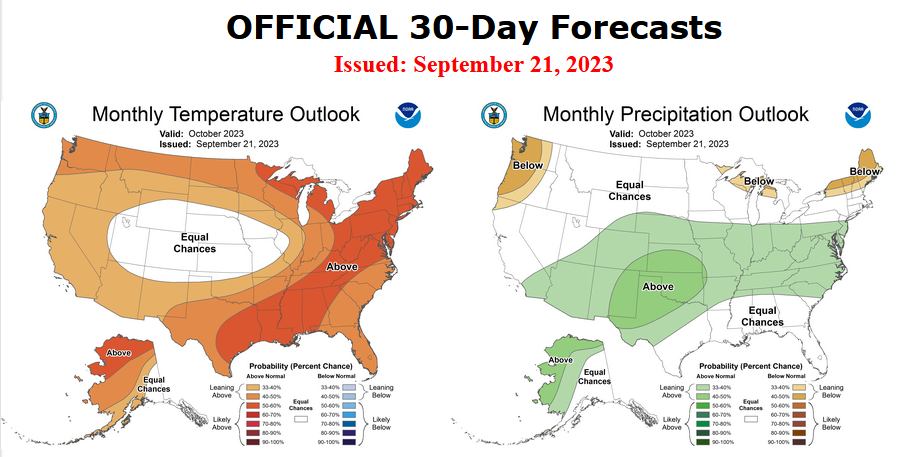
First, Let’s Take a Look at the (mid-month) Outlook for October. It will be updated on the last day of September.

Then I present a graphic that shows both the preliminary Outlook for October and the three-month outlook for OND 2023. So you get the full picture in one graphic. For some, that may be all they are interested in. Others will be interested in the longer-term predictions and also the rationale supporting the predictions which is mostly provided by the NOAA discussion.

The top row is what is now called the Mid-Month Outlook for next month which will be updated at the end of this month. There is a temperature map and a precipitation map. The second row is a three-month outlook that includes next month.  I think the outlook maps are self-explanatory. What is important to remember is that they show deviations from the current definition of normal which is the period 1991 through 2020.  So this is not a forecast of the absolute value of temperature or precipitation but the change from what is defined as normal or to use the technical term “climatology”.

Notice that the outlook for next month and the three-month outlooks are somewhat different with respect to temperature.  This tells us that November and December will be different than October to some extent.

The full NOAA Seasonal Outlook extends through October/November/December of 2024. All of these maps are in the body of the article. Large maps are there for October and the three-month period Oct/Nov/Dec.  Small maps are provided beyond that through December of next year with a link to get larger versions of these maps.

NOAA provides an excellent discussion to support the maps and the changes which starting in the Spring of 2024 are significantly different from what was issued a month ago. [Author’s Note: many other meteorological agencies see this El Nino lasting longer than NOAA does so there is more than usual uncertainty relating to the more distant months. It seems to me that NOAA was showing some of these as El Nino months last month but has changed them to ENSO Neutral months in what they issued on September 21, 2023.]

NOAA Updates their Seasonal Outlook – June 17, 2023

On the third Thursday of the month right on schedule NOAA issued what I describe as their Four-Season Outlook. The information released also included the Mid-Month Outlook for the single month of July plus the weather and drought outlook for the next three months.  I present the information issued by NOAA and try to add context to it. It is quite a challenge for NOAA to address the subsequent month, the subsequent three-month period as well as successive three-month periods for a year or a bit more. A seasonal drought outlook is also issued.

It is very useful to read the excellent discussion that NOAA issues with this Seasonal Outlook.  The overall level of confidence in the Seasonal Outlook is addressed in the NOAA discussion. It is best to read the full discussion but here are some of the highlights:

Re ENSO:

  • “NOAA’s CPC forecast calls for more than a 90 percent chance of El Niño persisting through JFM 2024 with a 56 percent chance of a strong El Niño (> 1.5 degrees C) during NDJ 2023.”

For July:

  • “Above normal temperatures are favored from the Four Corners region, across the central and southern Great Plains, the Southeast, and the Northeast.”
  • “A weakened monsoon during July across eastern Arizona and New Mexico is predicted”
  • “a strong subtropical ridge, which would favor above-normal precipitation from the southern Great Plains northward and into the Mid-Atlantic”
  • “a storm track across the northern Great Plains and into the Ohio River valley”

For JAS 2023:

  • “The highest probabilities (more than 50 percent) of above-normal temperatures are forecast across parts of California, the Pacific Northwest, Great Basin, Southwest, Gulf Coast, and East.”
  • “elevated probabilities of below-normal precipitation for parts of the Southwest, Pacific Northwest, and Great Lakes, while above-normal precipitation is favored across much of the Great Plains, parts of the Middle to Lower Mississippi Valley, Northern Rockies, and Florida Peninsula.”

Beyond JAS  2023:

  •  “Above-normal temperatures remain the most likely outcome throughout much of the U.S. from ASO to OND 2023.”
  •  “Beginning in NDJ 2023-24 through JFM 2024, predicted El Niño conditions result in enhanced chances for above-normal temperatures across the northern tier of the CONUS”
  •  “During the winter 2023-24, above-normal temperatures are favored across the East”
  •  “Precipitation outlooks during the fall 2023 through the winter 2023-24 relied upon El Niño composites and the consolidation tool with an increased chance of above (below)-normal precipitation across the southern (northern) tier of the CONUS.”
  •  “The largest probabilities (50 percent for above) are forecast across parts of the Southeast from NDJ 2023-24 through JFM 2024 based on a strong, reliable wet signal associated with El Niño.
  •  “During the spring and summer 2023, the precipitation outlooks are based mostly on decadal trends.”

NOAA Updates it’s Four-Season Outlook on April 20, 2023 – The Southwest Monsoon is expected to be less productive than usual. An El Nino Winter is Expected

On the third Thursday of the month right on schedule NOAA issued what I describe as their Four-Season Outlook. The information released also included the Mid-Month Outlook for the single month of May plus the weather and drought outlook for the next three months.  I present the information issued and try to add context to it. It is quite a challenge for NOAA to address the subsequent month, the subsequent three-month period as well as successive three-month periods for a year or a bit more.

It is very useful to read the excellent discussion that NOAA issues with this Seasonal Outlook. It is best to read the full discussion but here are some of the highlights:

  • ENSO-neutral conditions are expected to continue through the Northern Hemisphere spring, followed by a 62% chance of El Niño developing during May-July 2023. An El Niño Watch has been issued, and the range of possibilities toward the end of the year includes a strong El Niño (4 in 10 chance of Niño-3.4 ≥ 1.5°C) to no El Niño (1 in 10 chance)
  • The combination of elevated snowpack and high soil moisture across much of the West coupled with below normal SSTs currently observed in the Gulf of California and the Pacific off the west Coast of the Baja California Peninsula would favor a slower evolution of monsoonal circulation.
  • El Niño is expected to become more of a factor and the pattern begins to increasingly reflect El Niño conditions during the cold months. As a result, enhanced probabilities of above normal temperatures indicated for the Southern CONUS late summer/early fall are reduced by the winter. Conversely, chances of above normal temperatures increase across the Northern Tier by the winter months.
  • As we enter the fall and winter months, the pattern begins to increasingly reflect an El Niño signature. Increased probabilities for above normal precipitation depicted across the Ohio and Mississippi Valleys during late summer and early fall transitions to the East and Gulf Coasts during the winter months, consistent with El Niño. Conversely, an increasingly dry signal is evident across the northwestern CONUS by the winter with probabilities of below normal precipitation exceeding 40 percent across the Pacific Northwest from November-December-January (NDJ) 2023-24 through JFM 2024. A tilt toward below normal precipitation is also indicated for the Great Lakes Region westward toward the Northern Plains during the cold months, consistent with El Niño.

Our Report on the JAMSTEC Three-Season Forecast – March 24, 2023

Updated at 6:53 p.m. EDT March 24, 2023 to provide additional information on the Indian Ocean Dipole (IOD)

The Japan Agency for Marine-Earth Science and Technology, or JAMSTEC, is a Japanese national research institute for marine-earth science and technology

From the JAMSTEC Discussion:

Observation shows that the La Niña decayed and a La Niña Modoki-like state has appeared. The SINTEX-F ensemble mean predicts that an El Niño will occur in May. However, there is a large uncertainty in the predictions of the amplitude, and the ensemble mean of the SINTEX-F2-3DVAR version predicts a relatively weak El Niño.

Although it is a World forecast, it includes a forecast for North America since North America is part of the World.

NOAA Updates it’s Four-Season Outlook on March 16, 2023 – Entering ENSO Neutral but it may switch to El Nino after the Summer

On the third Thursday of the month right on schedule NOAA issued what I describe as their Four-Season Outlook. The information released also included the Mid-Month Outlook for the single month of April plus the weather and drought outlook for the next three months.  I present the information issued and try to add context to it. It is quite a challenge for NOAA to address the subsequent month, the subsequent three-month period as well as successive three-month periods for a year or a bit more.

It is very useful to read the excellent discussion that NOAA issues with this Seasonal Outlook.

Ocean conditions no longer reflect La Nina but the atmosphere still has some lingering La Nina characteristics. ENSO Neutral will be the prevailing condition but its impacts are less during the Spring and Summer Seasons. The Southwest Monsoon may start late. The outlook partially reflects El Nino conditions beginning in the Autumn of 2023. We may see more El Nino impacts reflected in the Outlook next month if the confidence in an El Nino gradually increases as we pass through the Spring Prediction Barrier (SPB).

NOAA Updates it’s Four-Season Outlook On February 16, 2023 – Potential El Niño impacts were considered in the outlooks for autumn 2023 and next winter

Updated at 3:05 p.m. EST February 17, 2023 to incorporate information on the latest Sudden Stratospheric Warming (SSW) event

On the third Thursday of the month right on schedule NOAA issued what I describe as their Four-Season Outlook. The information released also included the MId-Month Outlook for the single month of March plus the weather and drought outlook for the next three months.  I present the information issued and try to add context to it. It is quite a challenge for NOAA to address the subsequent month, the subsequent three-month period as well as successive three-month periods for a year or a bit more.

It is very useful to read the excellent discussion that NOAA issues with this Seasonal Outlook. The CPC/IRI analysis suggests that ENSO will very soon return to Neutral with a La Nino bias and gradually transition to true Neutral, Neutral with an El Nino bias, and then solidly El Nino. Confidence in the first part of that sequence of transitions is higher than in the latter part of the sequence.

NOAA Updates its Four Season Outlook on November 17, 2022 – La Nina Winter then Big Changes

La Nina Winter, then ENSO Neutral and Then Maybe Something Else

Today is the third Thursday of the month so right on schedule NOAA has issued what I describe as their Four-Season Outlook. The information released also includes the MId-Month Outlook for the single month of December plus the weather and drought outlook for the next three months.  I present the information issued and try to add context to it. It is quite a challenge for NOAA to address the subsequent month, the subsequent three-month period as well as successive three-month periods for a year or a bit more.

We will begin to see the end of La Nina Impacts in March/April/May of 2023 and they will pretty much end before June/July/August of 2023, and there will be another change in November/December/January 2023/2024. Why that last change? Could it be an El Nino or ENSO Neutral with an El Nino Bias?

It is very useful to read the excellent discussion that NOAA issues with this Seasonal Outlook. NOAA seems to be more confident about making predictions beyond six months. They even predict a good Southwest Monsoon next summer which they never used to do this far in advance.

JAMSTEC two Season Forecast plus our US-48 Hour Forecast October 29, 2022

Here comes El Nino – is that possible?

The Japan Agency for Marine-Earth Science and Technology, or JAMSTEC, is a Japanese national research institute for marine-earth science and technology

JAMSTEC is predicting a more rapid demise of La Nina and a possible onset of El Nino conditions. Thus we should expect their forecast to differ dramatically from the NOAA forecast.  Is it reasonable to predict a rapid change to El Nino? It is certainly possible. But it is not the majority opinion. Certainly, three La Ninas in a row build up the warm water in the IndoPacific Warm Pool. So I am presenting the JAMSTEC forecast as an alternative perspective.

I should have presented this information when I received it two weeks ago. The JAMSTEC forecasts are based on their model runs of October 1, 2022.

Although it is a World forecast, it includes a forecast for North America since North America is part of the World.