Looking Back at the weather for the full Year of 2023 in the U.S. Posted January 10, 2024

Most of the information in this report comes from the monthly email I receive from John Bateman. He does public outreach for NOAA and in particular NCEI. I could find the same information and more on the NCEI website but John produces a good summary so I use it or most of it. I also sometimes add additional information from NCEI or other NOAA websites. John Bateman sends me two emails. One on the World situation and one for the U.S.

I probably should have addressed the single month of December before the full year of 2023 but I received this email today so I thought I would write the article tonight for Wednesday viewing.

This article is about the full year of 2023 in the U.S.
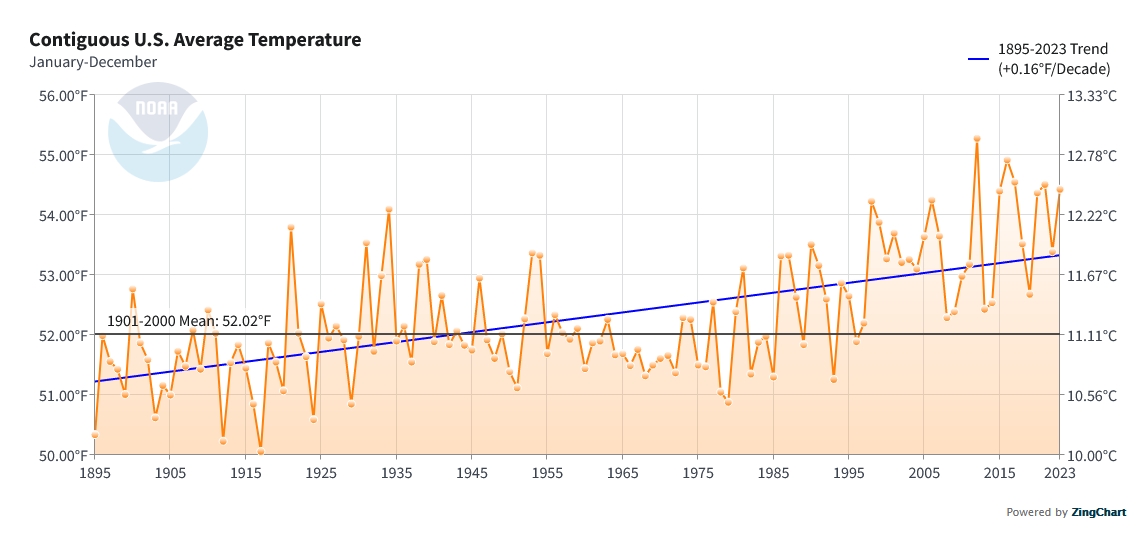
This is the U.S. Annual temperature trend. 2023 was by no means a record but it was above the trend line. +0.16F a decade is a fairly steep slope.   You can see some cyclical characteristics in the data but the trend is clear. If I calculated the trend since 1970, the slope would be quite a bit steeper.

Now I will present the information provided by John Bateman with perhaps three additional graphics. Some readers may need to click on “Read More” to access the full article. It is how the Home Page can display the introduction to many articles.

Looking back at November for the World December 19, 2023 – Earth had its Warmest November Ever Since Reliable Data has been Available.

Most of the information in this report comes from the monthly email I receive from John Bateman. He does public outreach for NOAA and in particular NCEI. I could find the same information and more on the NCEI website but John produces a good summary so I use it or most of it. I also sometimes add additional information from NCEI or other NOAA websites. The full NCEI report for November can be accessed HERE.

I added the below to what John Bateman provided.

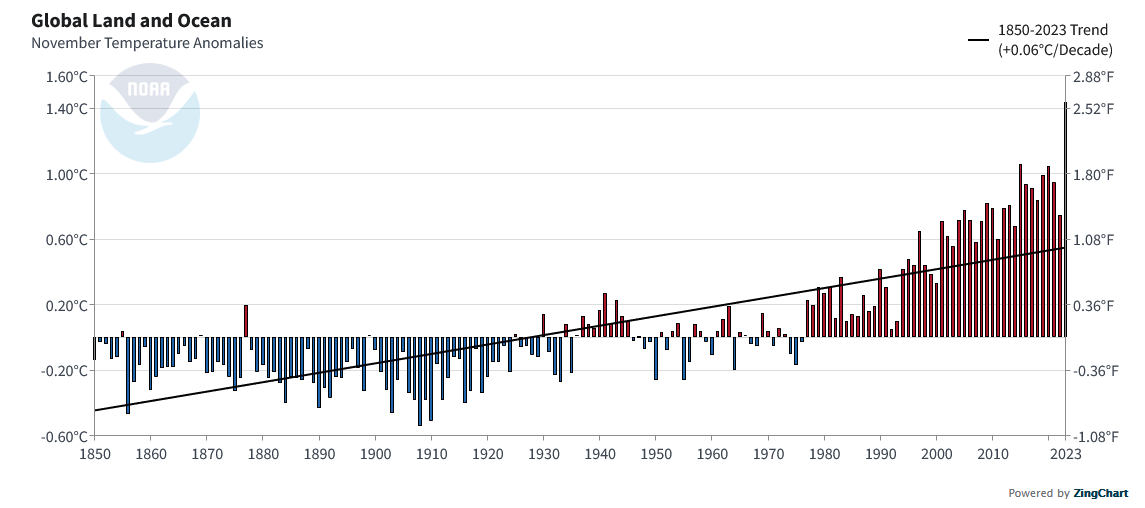
This November saw a huge jump. Remember this is the data for both land and water.

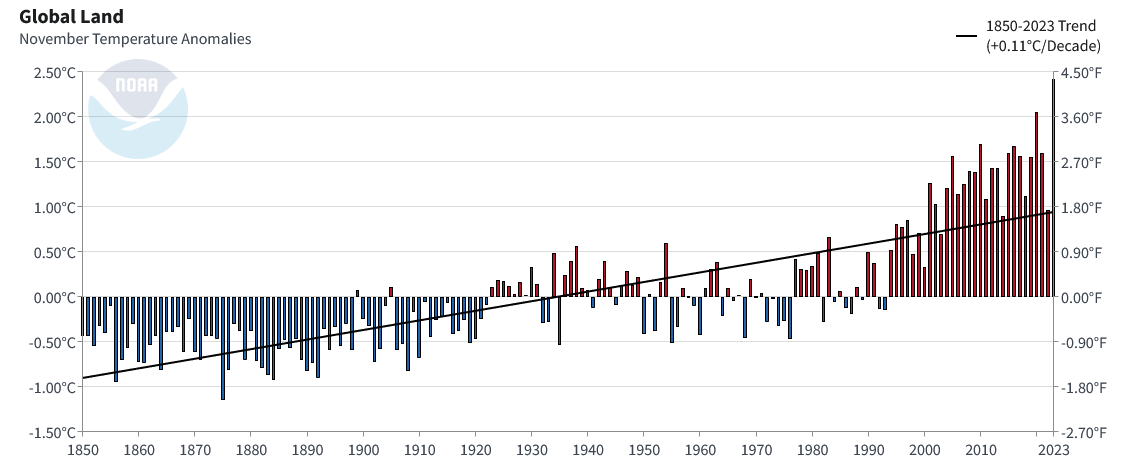
This looks just at land but the trend is similar.  In fact the regression line is even steeper.


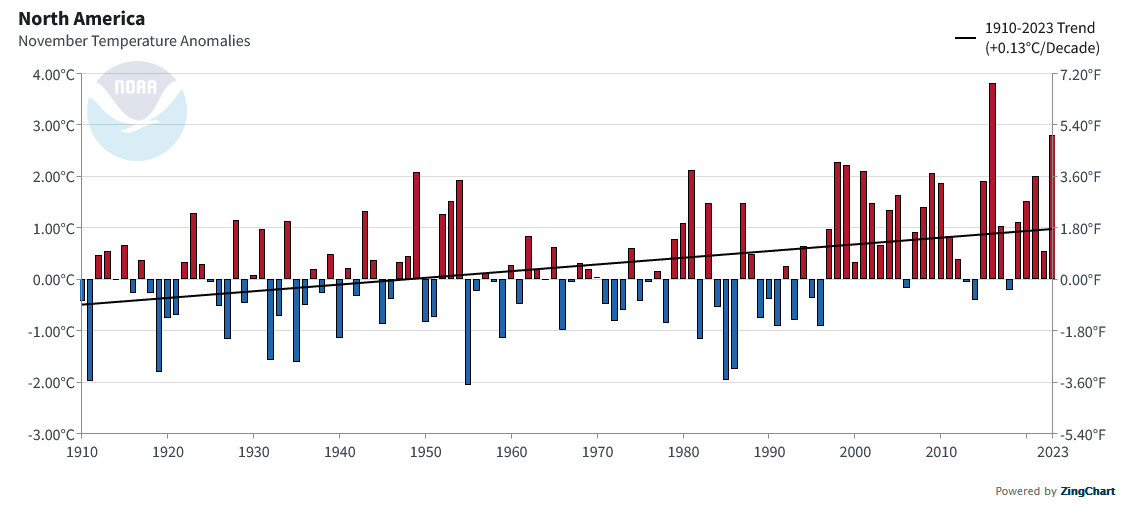
This is just North America. It is more than just the U.S.  and the slope of the regression line is even steeper. But for North America, unlike the world, November did not set a new record.

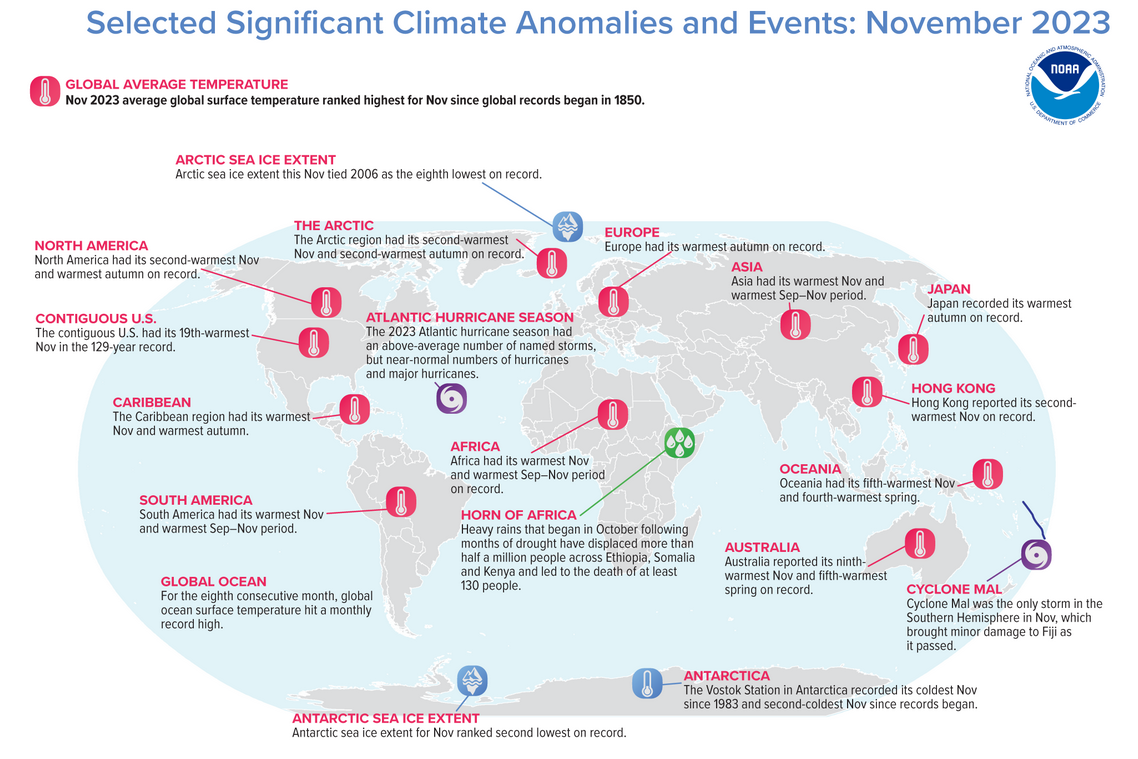
This shows selected anomalies but it mostly covers temperature around the world.

Reporting on the State of the Climate in 2022 – September 9, 2023

Every year at about the same time, there is a report on the State of the Climate of the world as of the prior year.  Many organizations work together to produce and distribute this report.  I am presenting the NCEI-prepared highlights of the full report. Remember this report is about 2022 and the years leading up to 2022. It takes a little time for NOAA and the American Meteorological Society to prepare their report and in this article, I provide the Highlights of that report as prepared by NCEI. NCEI stands for the NOAA National Centers for Environmental Information.

This article is worth reading. It just presents the highlights. My comments are inside boxes within the article.

This report can be accessed HERE but I have included all of the material that is in this report in this article.

The American Meteorological Society (AMS) version of the report has a lot more detail and can be accessed HERE.

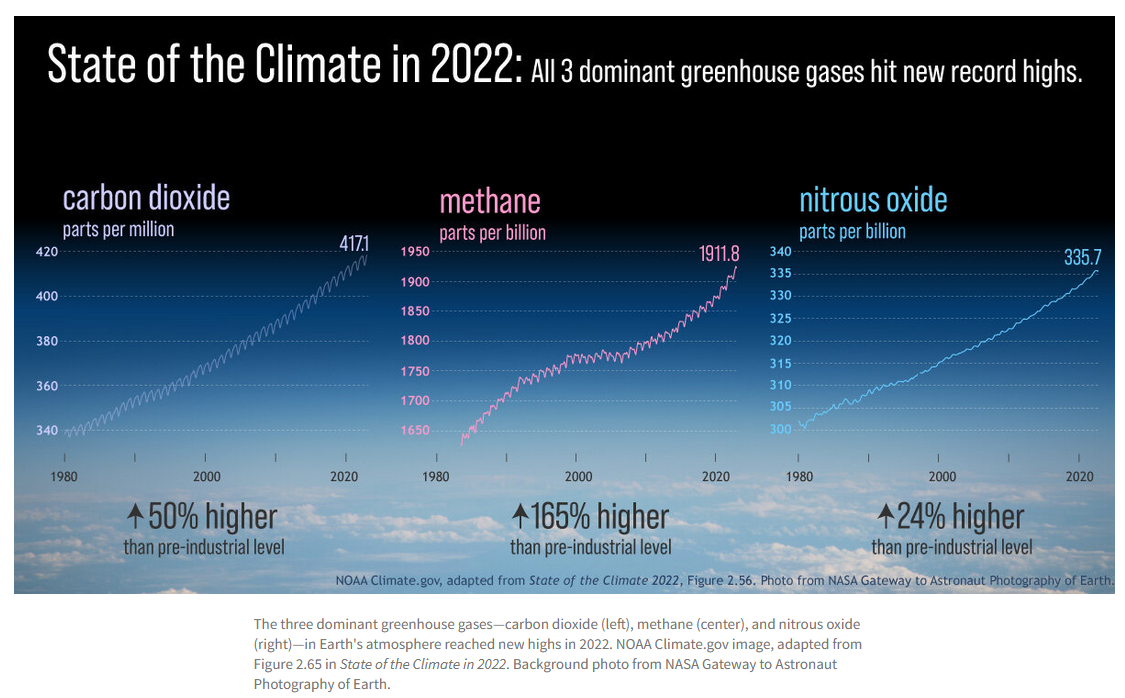
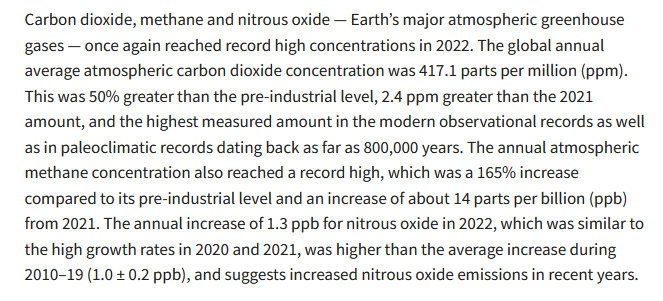
The growth in all three greenhouse gases since 1980 is bad but the increase in methane is particularly concerning.

Nitrous oxide is a very very powerful GHG so its increase in growth rather is very concerning.

Review of the World’s Weather in April of 2023 – May 13, 2023

Every month the NOAA National Centers for Environmental Information and other NOAA entities review the weather for the World in the prior Month. There is a long detailed report and I receive a summary of that report. In this article I am going to present two slides from the full report and then the email I received in its entirety.

Certainly, the Global ocean temperature setting a record for April is pretty significant. The combined land and ocean temperature being the fourth highest, to me is not a surprise at all as the first graphic in the body of the article suggests.