NOAA Updates It’s ENSO Alert Status on January 9, 2025 – La Nina Has Finally Arrived They Say – Published on January 11, 2025
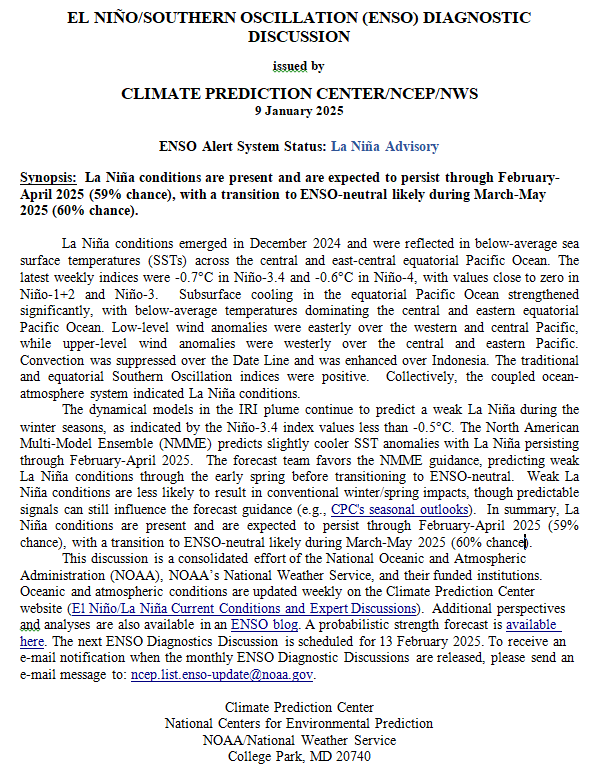
“Synopsis: “La Niña conditions are present and are expected to persist through February-April 2025 (59% chance), with a transition to ENSO-neutral likely during March-May 2025 (60% chance). “
So we are no longer in ENSO Neutral but officially in La Nina (but we may not stay in La Nina long enough for it to be recorded as an official La Nina for historical purposes.)
On the second Thursday of every month, NOAA (really their Climate Prediction Center CPC) issues its analysis of the status of ENSO. This includes determining the Alert System Status. NOAA now describes their conclusion as “ENSO Alert System Status: La Nina”
It should increase the reliability of the Seasonal Outlook to be issued next Thursday. But will it?
We have included a very interesting ENSO Blog Post by Emily Becker.
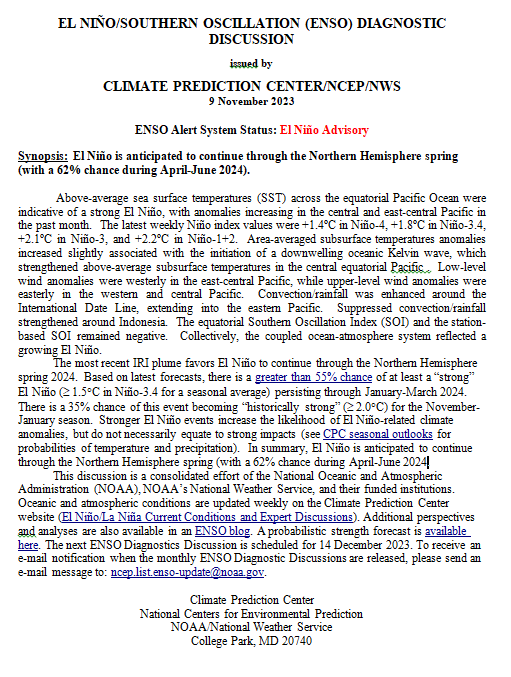
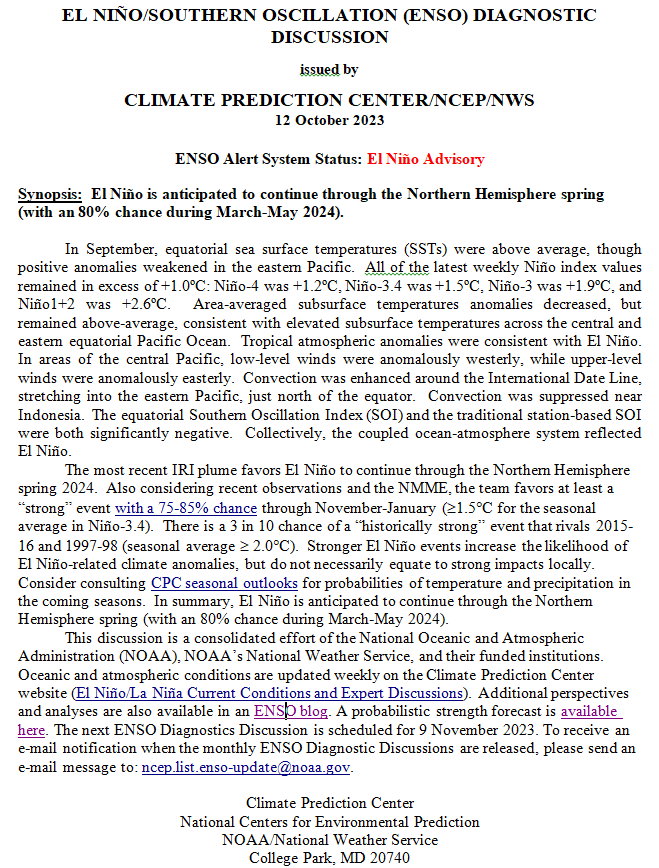
CLIMATE PREDICTION CENTER ENSO DISCUSSION (LINK)
| The second paragraph is what is important:
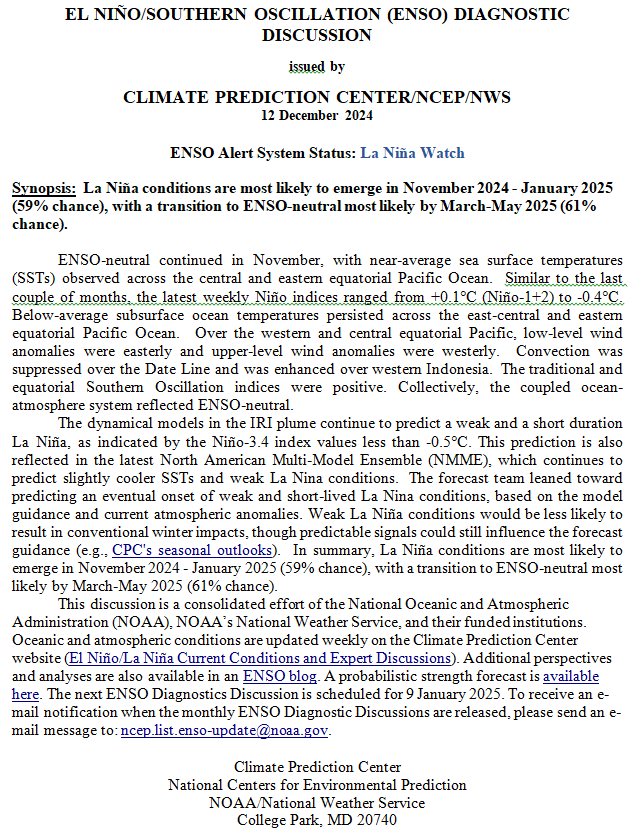
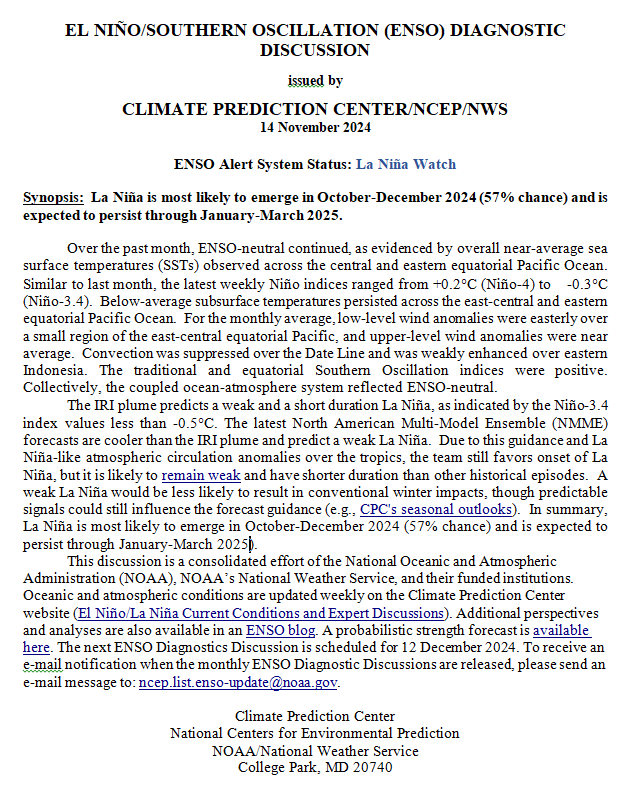
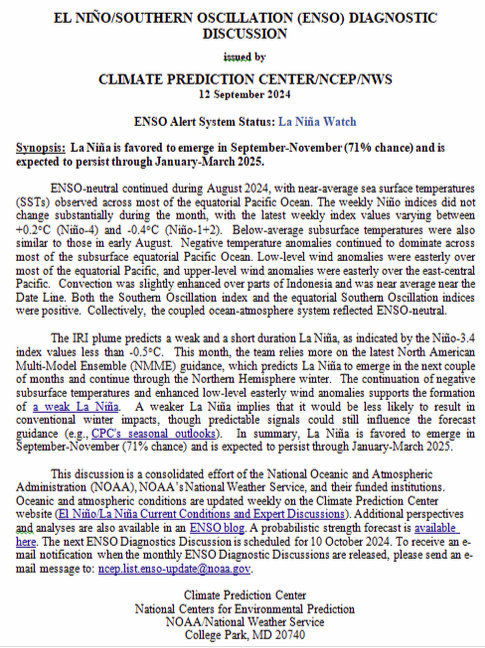
“The dynamical models in the IRI plume continue to predict a weak La Niña during the winter seasons, as indicated by the Niño-3.4 index values less than -0.5°C . The North American Multi-Model Ensemble (NMME) predicts slightly cooler SST anomalies with La Niña persisting through February-April 2025. The forecast team favors the NMME guidance, predicting weak La Niña conditions through the early spring before transitioning to ENSO-neutral. Weak La Niña conditions are less likely to result in conventional winter/spring impacts, though predictable signals can still influence the forecast guidance (e.g., CPC’s seasonal outlooks). In summary, La Niña conditions are present and are expected to persist through February-April 2025 (59% chance), with a transition to ENSO-neutral likely during March-May 2025 (60% chance). ” Below is the middle paragraph from the discussion last month. “The dynamical models in the IRI plume continue to predict a weak and a short duration La Niña, as indicated by the Niño-3.4 index values less than -0.5°C. This prediction is also reflected in the latest North American Multi-Model Ensemble (NMME), which continues to predict slightly cooler SSTs and weak La Nina conditions. The forecast team leaned toward predicting an eventual onset of weak and short-lived La Nina conditions, based on the model guidance and current atmospheric anomalies. Weak La Niña conditions would be less likely to result in conventional winter impacts, though predictable signals could still influence the forecast guidance (e.g., CPC’s seasonal outlooks). In summary, La Niña conditions are most likely to emerge in November 2024 – January 2025 (59% chance), with a transition to ENSO-neutral most likely by March-May 2025 (61% chance).” {Author’s Note: Has anything really changed?] |
We now provide additional details.
CPC Probability Distribution
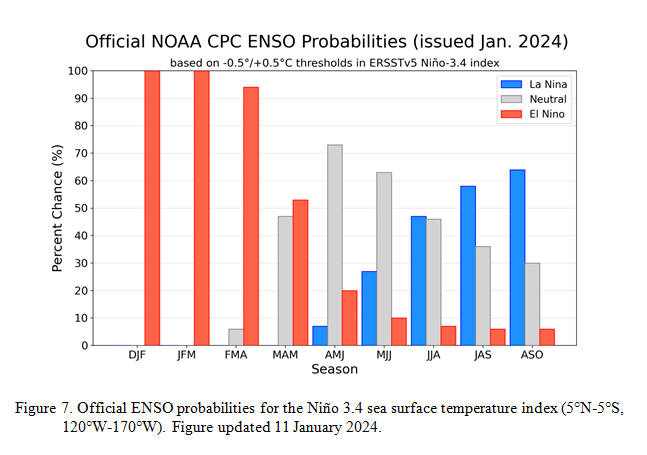
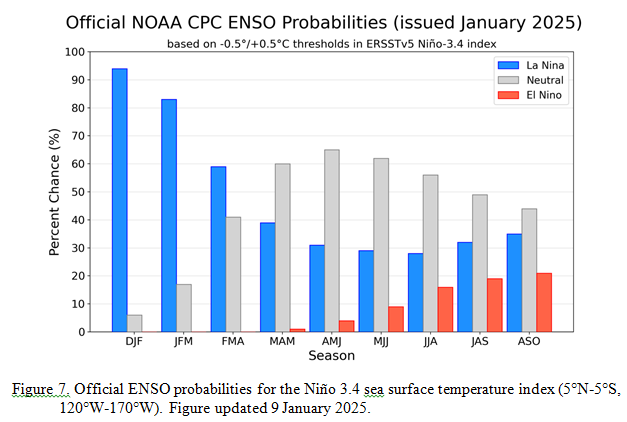
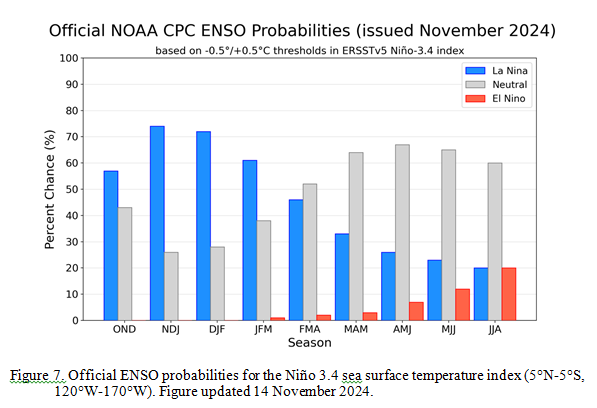
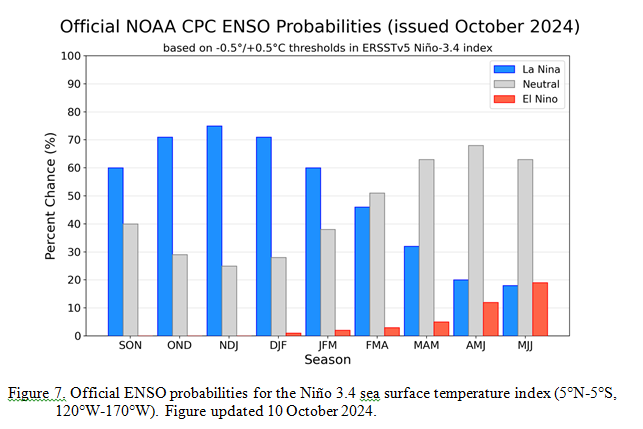
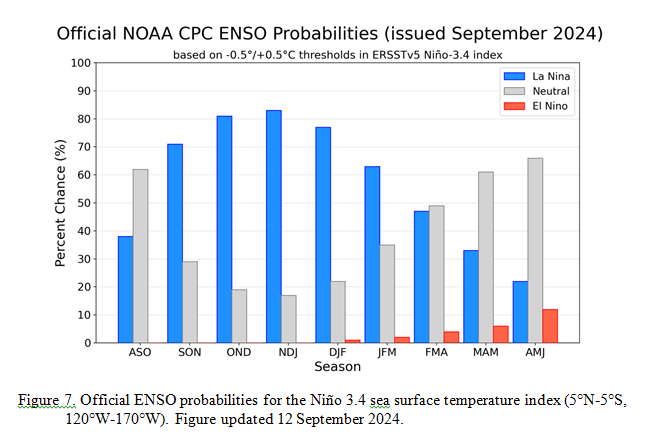
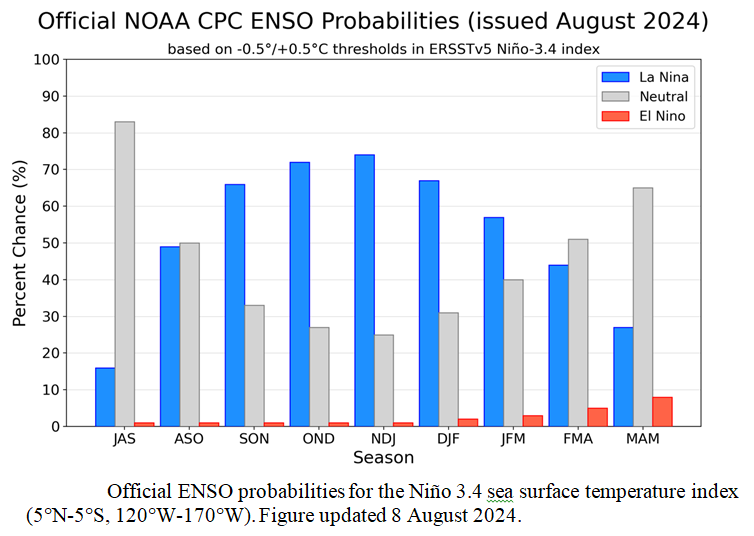
Here are the new forecast probabilities. The probabilities are for three-month periods e.g. NDJ stands for November/December/January.
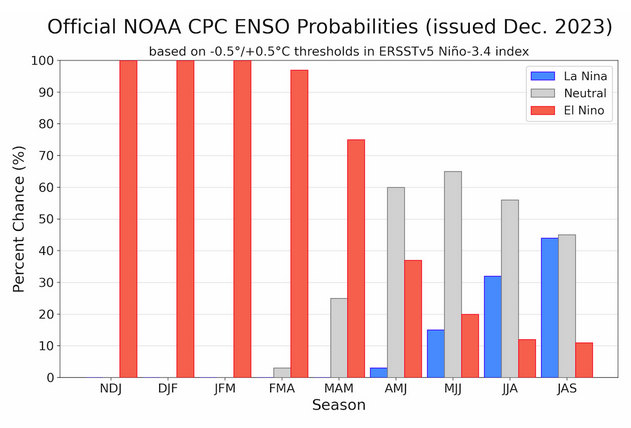
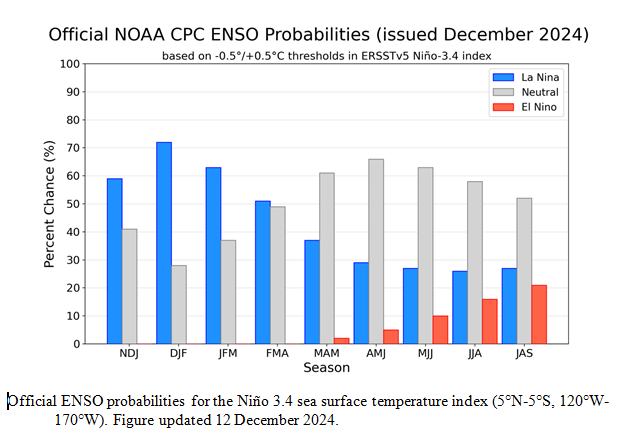
![]() Here is the forecast from last month.
Here is the forecast from last month.
| The analysis this month and last month are fairly similar. But a future El Nino is a bit more in the picture. |


 >
>
