02 AUG 2024 Market Close & Major Financial Headlines: Markets Opened Sharply Lower, Traded Sideways, Closing About 2% In The Red After Weak Jobs Report

Summary Of the Markets Today:

  • The Dow closed down 611 points or 1.51%,
  • Nasdaq closed down 2.43%,
  • S&P 500 closed down 1.84%,
  • Gold $2,479 down $1.10,
  • WTI crude oil settled at $74 down $2.41,
  • 10-year U.S. Treasury 3.799 down 0.178 points,
  • USD index $103.21 down $1.210,
  • Bitcoin $62,550 down $2,747 or 4.21%,
  • Baker Hughes Rig Count: U.S. -3 to 586 Canada +8 to 219

*Stock data, cryptocurrency, and commodity prices at the market closing.

Today’s Highlights:

The US stock market experienced a significant downturn today following the release of the July jobs report, which indicated further cooling in the labor market. This development has intensified concerns about a potential recession and raised questions about the Federal Reserve’s interest rate strategy. Key points from the market reaction:

Economic concerns:

  • The weak jobs report has fueled fears of an economic slowdown
  • Investors are worried that the Federal Reserve may have maintained high interest rates for too long

Interest rate expectations:

  • Market forecasts now indicate a higher likelihood of a 0.5 percentage point rate cut in September
  • Treasury yields declined, with the 10-year yield falling below 4%

Tech sector impact:

  • Intel’s stock plummeted by 29% following disappointing guidance and layoff announcements
  • Amazon’s shares fell by 12.5% after missing quarterly financial projections

Broader economic indicators:

  • Factory orders declined by 3.3%, the largest drop since April 2020
  • Manufacturing activity and construction spending were lower than expected

The market reaction reflects growing uncertainty about the economic outlook and concerns that the Federal Reserve’s monetary policy may be too restrictive, potentially risking a “hard landing” for the economy.


Click here to read our current Economic Forecast – August 2024 Economic Forecast: New Recession Flag


Today’s Economic Releases Compiled by Steven Hansen, Publisher:

The unemployment rate rose to 4.3% in July 2024, and nonfarm payroll employment grew by 114,000 – the second-worst growth this year. Employment continued to trend up in health care, in construction, and in transportation and warehousing, while information lost jobs (see employment change bar chart in second graph below). The household survey (which produces the unemployment rate) shows employment growth of only 67,000 – versus the headline establishment survey’s 114,000 (see red bar on graph below). Further, the primary reason for the significant jump in the unemployment rate is because the household survey added 420,000 people to the workforce – not that a lot of people lost their jobs. Looking at the employment-population ratio which has been worsening since April 2024, it declined this month and remains below the levels seen from 2018 to 2020. Also from the establishment survey, Over the last year – the number of people unemployed has increased 380,000 or 21% year-over-year. To say the economy is stumbling at this point may turn out to be an understatement.

Contrary to the June 2024 Federal Reserve Industrial Production 1.1% year-over-year growth, the US Census manufacturing data shows new orders for manufactured goods in June 2024 declined 5.2% year-over-year. This data moves industrial production into a significant recession in June 2024, and early data has July 2024 manufacturing data also in a recession. Remember that imports are increasing which only suggests that despite the current policy to increase US manufacturing – manufacturing is leaving the country.

Here is a summary of headlines we are reading today:

Click on the “Read More” below to access these, other headlines, and the associated news summaries moving the markets today.

Today Through the Fourth Friday (22 to 28 days) Weather Outlook for the U.S. and a Six-Day Forecast for the World: posted August 2, 2024

This article focuses on what we are paying attention to in the next 48 to 72 hours. The article also includes weather maps for longer-term U.S. outlooks and a six-day World weather outlook which can be very useful for travelers.

First the NWS Short Range Forecast. The afternoon NWS text update can be found here after about 4 p.m. New York time but it is unlikely to have changed very much from the morning update. The images in this article automatically update.

Short Range Forecast Discussion
NWS Weather Prediction Center College Park MD
Fri Aug 02 2024
Valid 12Z Fri Aug 02 2024 – 12Z Sun Aug 04 2024

…A dangerous heat wave will impact much of the East Coast, Southeast and
Northwest through tonight…

…Excessive Rainfall concerns across portions of the Eastern U.S. this
weekend…

…Monsoonal storms continue across the Southwest/Four Corners through the
weekend…

A familiar upper-level pattern over the lower 48, with ridging in the West
and troughing over the Great Lakes and Ohio/Tennessee Valley, will support
heat waves and excessive rainfall concerns this weekend. High temperatures
in the 100s will represent a 10-15 degree positive anomaly across the
Northwest today. Some of these temperatures will tie or break records.
Overnight temperatures in the upper 60s to upper 70s will tie or break
widespread temperature records across the West tonight as well. The
combination of very hot daytime conditions and a lack of overnight relief
could harm those without adequate shelter or hydration. Cloudy conditions
will support near record breaking warmth over portions of the coastal
Northeast and Florida peninsula tonight.

Showers and thunderstorms will develop along a cold front moving through
the Midwest today and spread eastward toward the East Coast. Slight Risks
of Excessive Rainfall leading to Flash Flooding are in effect for portions
of the Lower Great Lakes, Ohio Valley and Northeast today due to the
higher rates within some of the storms that move through those areas.
Orographic lift over portions of the Central/Southern Appalachians will
promote additional Flash Flooding concerns, hence another Slight Risk area
for parts of eastern Tennessee, southeastern Kentucky, southwestern
Virginia, western North Carolina and northern Alabama/Georgia. The cold
front slows down across the Mid-Atlantic/Southeast on Saturday and becomes
the focus for additional Excessive Rainfall concerns, due in part to a
significant moisture plume from the Tropics. A Slight Risk of Excessive
Rainfall is in effect for portions of southeastern Virginia down into the
Carolina/Georgia Piedmont.

A tropical disturbance is forecast to impact the Florida Peninsula
beginning late tonight when heavy rainfall and thunderstorms are supposed
to spread across southern Florida and eventually work their way up the
peninsula on Saturday. A Slight Risk of Excessive Rainfall is in effect
for portions of southern Florida on Saturday as a result. Monsoonal
moisture is expected to continue flowing into the Southwest/Four Corners
region this weekend. Scattered showers and thunderstorms may lead to
isolated Flash Flooding across portions of the aforementioned areas,
particularly burn scars and slot canyons.

To get your local forecast plus active alerts and warnings click HERE and enter your city, state or zip code.

Learn about wave patterns HERE.

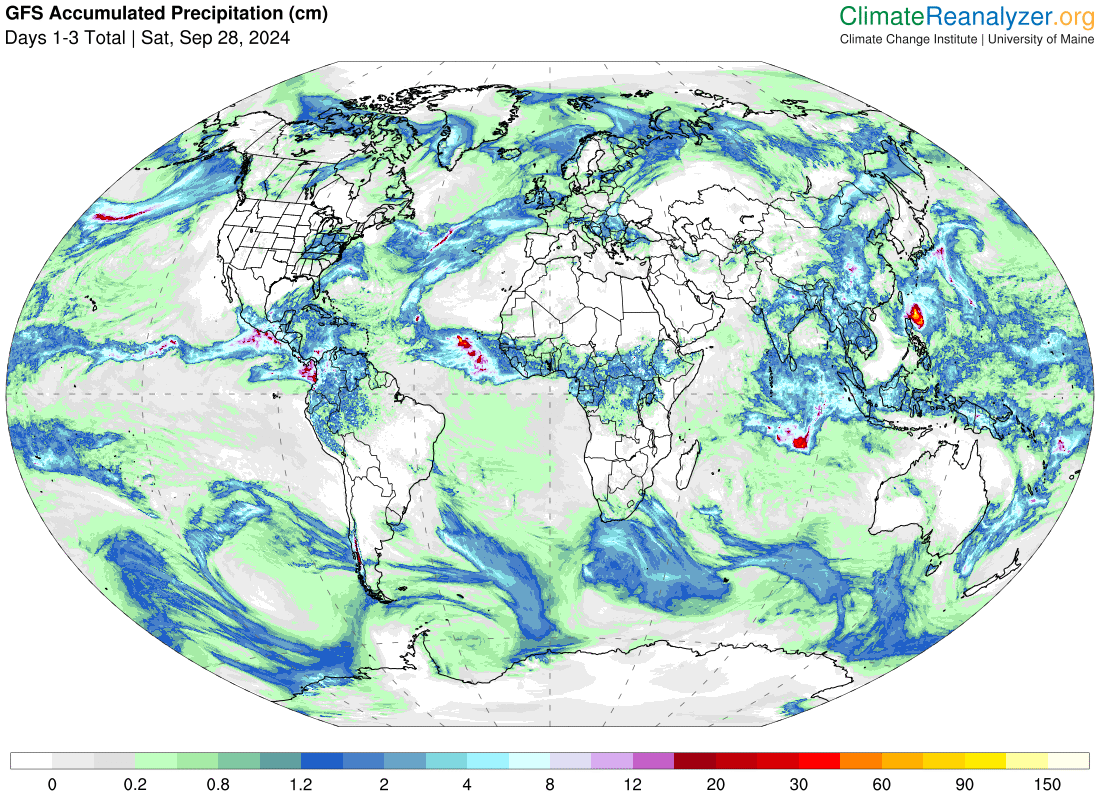
Then, looking at the world and of course, the U.S. shows here also. Today we are looking at precipitation.

Please click on “Read More” below to access the full Daily Report issued today.

01 AUG 2024 Market Close & Major Financial Headlines: Murky Data Sends The Dow Down Almost 500 Points, Nasdaq Down 3%, S&P 500 Down 2%, 10 Year Treasury Yield Falls Below 4%

Summary Of the Markets Today:

  • The Dow closed down 495 points or 1.21%,
  • Nasdaq closed down 2.30%,
  • S&P 500 closed down 1.37%,
  • Gold $2,487 up $14.10,
  • WTI crude oil settled at $77 down $0.94,
  • 10-year U.S. Treasury 3.981 down 0.123 points,
  • USD index $104.39 down $0.300,
  • Bitcoin $63,346 down $1,268 or 1.96%,

Today’s Highlights:

US stocks experienced significant selling pressure on Thursday, with all three major indexes falling sharply. Here’s a summary of the key points:

  1. The tech-heavy Nasdaq Composite led the decline, falling 2.3%, while the S&P 500 dropped 1.4% and the Dow Jones Industrial Average lost 494 points (1.2%).
  2. Chip stocks were hit particularly hard, with the Philadelphia Semiconductor Index falling more than 7%. Arm Holdings plummeted 15% after disappointing results, dragging down other market leaders like Nvidia and AMD, which fell over 6% and 8% respectively.
  3. The 10-year Treasury yield dropped below 4% for the first time since February, settling around 3.98%.
  4. Weak economic data contributed to the sell-off. The US manufacturing sector contracted further in July, jobless claims rose to an 11-month high, and construction spending unexpectedly declined in June.
  5. Despite the Federal Reserve signaling a likely rate cut in September, investors reacted negatively to the economic data, viewing it as “bad news” rather than a potential catalyst for steeper rate cuts.
  6. Traders increased bets on more aggressive Fed moves, with the probability of a 50 basis point rate cut in September rising from 11% to 25%.
  7. Meta was a notable exception, rising 4.4% after reporting better-than-expected quarterly results.
  8. The July jobs report, due on Friday, is the next key data release that investors will be watching closely.

This sell-off highlights the market’s sensitivity to economic data and suggests that investors are becoming more concerned about economic growth rather than just focusing on potential rate cuts.


Click here to read our current Economic Forecast – August 2024 Economic Forecast: New Recession Flag


Today’s Economic Releases Compiled by Steven Hansen, Publisher:

U.S.-based employers announced 25,885 job cuts in July 2024, a 47% decrease from the 48,786 cuts announced one month prior – but up 9% from the 23,697 cuts announced in the same month in 2023. Andrew Challenger, Senior Vice President of Challenger, Gray & Christmas, Inc. perspective:

The job market is indeed cooling, with hiring at the lowest point in over a decade.  While we are seeing increased cuts in manufacturing sectors, both consumer and industrial, most industries are cutting below last year’s levels.


Construction spending during June 2024  is 6.2% above June 2023 estimate – but this is down from the 7.1% year-over-year in the previous month. Spending on private construction was up 5.9% year-over-year but down from the 6.5% growth in the previous month. Public construction was up 7.3% year-over-year but down from the 9.3% seen the previous month. Unfortunately, construction continues to slow even though it remains one of the bright spots in the U.S. economy.

The Manufacturing PMI® registered 46.8% in July 2024,down 1.7 percentage points from the 48.5% recorded in June. A Manufacturing PMI® above 42.5 percent, over a period of time, generally indicates an expansion of the overall economy. The New Orders Index remained in contraction territory, registering 47.4%, 1.9 percentage points lower than the 49.3 percent recorded in June. The July reading of the Production Index (45.9 percent) is 2.6 percentage points lower than June’s figure of 48.5 percent. Just one more nail in the manufacturing coffin indicating it has slid into a recession.

In the week ending July 27, the advance figure for seasonally adjusted initial unemployment claims 4-week moving average was 238,000, an increase of 2,500 from the previous week’s unrevised average of 235,500. Initial unemployment claims remain in territory associated with an expanding economy.

Nonfarm business sector labor productivity increased 2.7% year-over-year in the second quarter of 2024 with unit labor costs increasing 0.5% year-over-year. Note that the trends are that both productivity and unit labor costs are moderating – however with productivity growth being significantly higher than labor cost growth, it helps the U.S. competitive position.

NFIB’s July jobs report found a seasonally adjusted net 33% of small business owners reported raising compensation in July, down five points from last month and the lowest reading since April 2021. A net 18% (seasonally adjusted) plan to raise compensation in the next three months, down four points from June. NFIB Chief Economist Bill Dunkelberg stated:

Fewer small business owners are planning to raise compensation in the coming months, and plans to hire remain stable,. July marks the second month of net gains in employment on Main Street, and the number of firms with open positions remains exceptionally high.

Here is a summary of headlines we are reading today:

Click on the “Read More” below to access these, other headlines, and the associated news summaries moving the markets today.

NOAA Updates its Mid-month Outlook for August, 2024 – There are Some Changes – Posted on August 1, 2024

At the end of every month, NOAA updates its Outlook for the following month which in this case is August of 2024. We are reporting on that tonight.

There have been some significant changes in the Outlook for August and these are addressed in the NOAA Discussion so it is well worth reading.  We provided the prior Mid-Month Outlook for August for comparison. It is easy to see the substantial changes in the weather outlook by comparing the Mid-Month and Updated Maps.

The article includes the Drought Outlook for August. NOAA also adjusted the previously issued Seasonal (ASO) Drought Outlook to reflect the changes in the August Drought Outlook. We also provide the Week 2/3 Tropical Outlook for the World.

The best way to understand the updated outlook for August is to view the maps and read the NOAA discussion. I have highlighted the key statements in the NOAA Discussion.

I am going to start with graphics that show the updated Outlook for August and the Mid-Month Outlook for August. This is followed by a graphic that shows both the Updated Outlook for August and the previously issued three-month outlook for ASO 2024. So you get the full picture in three graphics.

Here is the updated Outlook for August 2024.


For Comparison Purposes, Here is the earlier Mid-Month Outlook for August.


It is important to remember that the maps show deviations from the current definition of normal which is the period 1991 through 2020.  So this is not a forecast of the absolute value of temperature or precipitation but the change from what is defined as normal or to use the technical term climatology.

It is a substantial change from what was issued on July 18, 2024. Remember, it is the first set of maps that are the current outlook for August.  One expects some changes  13 days later. However, the changes to the updated August Outlook are significant, particularly with respect to precipitation.  This then gives us some reason to question the (July 18, 2024) three-month ASO temperature and precipitation Outlooks which are shown in the following graphic.

NOAA provided a combination of the Updated Outlook for August and the Three-Month Outlook.

The top pair of maps are again the Updated Outlook for the new month. There is a temperature map and a precipitation map. The bottom row shows the three-month outlooks which includes August the new month. I think the outlook maps are self-explanatory.

To the extent that one can rely on a forecast, we would conclude that September and October will be very different than August, especially for precipitation. You can subtract Augusts from the three-month Outlook and divide by two to get a combined September-October Outlook.

However given the major change in the new August outlook from what was issued on July 18,  2024, we might not trust the Seasonal Outlook issued on July 18, 2024. Something to think about. But the major factor is the projected slower onset of La Nina. Thus this change is consistent with the pattern the NOAA has been predicting although they have been playing catch-up.

Some readers may need to click “Read More” to read the rest of the article.  Some will feel that they have enough information. But there is a lot more information in the rest of this article.

Today Through the Fourth Friday (22 to 28 days) Weather Outlook for the U.S. and a Six-Day Forecast for the World: posted August 1, 2024

This article focuses on what we are paying attention to in the next 48 to 72 hours. The article also includes weather maps for longer-term U.S. outlooks and a six-day World weather outlook which can be very useful for travelers.

First the NWS Short Range Forecast. The afternoon NWS text update can be found here after about 4 p.m. New York time but it is unlikely to have changed very much from the morning update. The images in this article automatically update.

Short Range Forecast Discussion
NWS Weather Prediction Center College Park MD
Thu Aug 01 2024
Valid 12Z Thu Aug 01 2024 – 12Z Sat Aug 03 2024

…Dangerous heat engulfs much of the country as one heatwave continues
from the Southern Plains to the Southeast/Mid-Atlantic and another begins
in the West…

…Severe weather and flash flooding expected for portions of the Midwest
Thursday…

… Locally heavy monsoonal shower and thunderstorm chances continue for
the Southwest…

Widespread, dangerous heat will unfortunately be the main weather story
for much of the country this week as one heatwave continues for the
Plains, Middle/Lower Mississippi Valley, Southeast, and Mid-Atlantic, and
another heatwave begins over portions of the West. A strong upper-level
ridge will remain in place over the southern-tier of the U.S. the next
couple days, allowing for high temperatures to reach into the low 100s
over portions of the Southern Plains/High Plains, the upper 90s to low
100s for the Lower Mississippi Valley, and the upper 90s for the Southeast
into the southern Mid-Atlantic. High humidity values for areas east of the
High Plains will bring heat indices into the 105 to 110 degree range,
potentially as high as 115 for parts of the Lower Mississippi Valley, with
many areas under heat-related advisories or warnings. The combination of
hot temperatures/high heat indices, as well as very warm morning lows only
dropping into the mid- to upper 70s, will be dangerous to anyone without
access to adequate air conditioning. Temperatures warming into the upper
80s/low 90s with periods of higher humidity will lead to some muggy,
potentially dangerous conditions for portions of New England as well,
particularly on Friday. An approaching cold front will bring relief to
northern portions of the Southern Plains and Middle Mississippi Valley on
Friday, with the expectation the heat wave will begin to wane for most
locations through the weekend.

In the West, an upper-level ridge will also begin to build northward,
sending high temperatures across much of the northern tier of the West
10-20 degrees above mid-Summer averages. Forecast highs Thursday are into
the upper 90s/low 100s for the inland Pacific Northwest/northern Great
Basin and mid- to upper 90s for the northern Rockies/High Plains.
Temperatures will get even hotter on Friday, with highs into the low to
mid-100s for most locations. Many near record-tying/breaking highs are
possible. Similar to areas further east, many heat-related advisories and
warnings have been issued as this heat will also reach dangerous levels
for the general public. Smoke from area wildfires will also continue to
plague parts of the region, resulting in hazy conditions and poor air
quality, and the risk for more wildfires will increase as the hot, dry
conditions settle in.

An upper-level low/accompanying surface frontal system traversing the
northern side of the ridge over the southern tier of the U.S. will bring
another round of showers and thunderstorms to the Midwest Thursday. High
surface moisture leading to very strong instability will support intense
thunderstorm development through the afternoon across the warm sector
ahead of an approaching cold front, with lingering outflow boundaries from
overnight convection helping to trigger individual and clusters of storms.
Sufficient shear with the passing upper-level wave will lead to the threat
of severe weather, with a Slight Risk (level 2/5) from the Storm
Prediction Center covering Illinois, Indiana, Kentucky, and southwestern
Ohio, mainly for the threat of some damaging winds. The threat for some
intense downpours given the high moisture/strong storms, and potential for
some more widespread, organized clusters of storms, will lead to some
heavier rainfall totals and the risk for flash flooding. Many of these
locations have seen recent heavy rainfall given repeated rounds of
organized storms passing through, leading to wetter antecedent conditions
more sensitive to any additional rainfall. A Slight Risk of Excessive
Rainfall (level 2/4) covers much of same region from northeastern Illinois
southeast through Indiana/western Ohio and into eastern Kentucky. Some
slow moving storms producing heavy rainfall under the passing upper-low
may also lead to some flash flooding, with the Slight Risk extending
northwest into southern Wisconsin. Some more isolated storms will be
possible further east into the Appalachians and Mid-Atlantic Thursday.
Additional storms will be possible across the region Friday as the system
shifts eastward, with a greater chance of storms spreading into the
Appalachians and the Mid-Atlantic. Some isolated severe storms and
instances of flash flooding will be possible. A lingering upper-level
weakness will lead to scattered showers and thunderstorms over Florida and
portions of the Southeast Thursday, with moderate to locally heavy
rainfall possible, especially over the Florida Peninsula. More widely
scattered storms will remain possible Friday.

Persistent Monsoonal conditions over the Southwest will continue to bring
daily shower and thunderstorm chances. Sufficient moisture across the
region will lead to the threat for some locally heavy downpours and an
isolated flash flooding, particularly over terrain sensitive areas such as
burn scars. A lingering frontal boundary will lead to some storms over
portions of the southern High Plains as well on Thursday, and a subtle
upper-level wave along the edge of the upper-ridging will bring storm
chances northwestward into portions of California Friday, particularly in
vicinity of the Sierra Nevada. Similar to areas further north, forecast
high temperatures more broadly in the region will be trending hotter and
above average, with 90s and low 100s for most locations outside of the
California Coast, and mid-100s to low 110s for the Desert Southwest.

To get your local forecast plus active alerts and warnings click HERE and enter your city, state or zip code.

Learn about wave patterns HERE.

Then, looking at the world and of course, the U.S. shows here also. Today we are looking at precipitation.

Please click on “Read More” below to access the full Daily Report issued today.

31 July 2024 Market Close & Major Financial Headlines: Small Caps Gap Upward At The Opening Bell, While The Dow Makes One Dip Into The Red, Nasdaq Closes Sharply Higher Above 2.6%

Summary Of the Markets Today:

  • The Dow closed up 99 points or 0.24%,
  • Nasdaq closed up 2.64%,
  • S&P 500 closed up 1.58%,
  • Gold $2,495 up $43.40,
  • WTI crude oil settled at $78 up $3.70,
  • 10-year U.S. Treasury 4.057 down 0.083 points,
  • USD index $104.09 down $0.460,
  • Bitcoin $65,224 down $946 or 1.43%,

Today’s Highlights:

Nvidia (NVDA) stock experienced a significant rally of nearly 13% on Wednesday, driven by several positive factors<:

  1. AMD’s strong performance: AMD’s better-than-expected quarterly results and optimistic guidance for the third quarter helped alleviate concerns about the sustainability of the AI trade.
  2. Morgan Stanley’s bullish call: Analysts at Morgan Stanley designated Nvidia as a ‘Top Pick’ following a recent pullback in the stock price. They maintained an Overweight rating with a price target of $144.
  3. Big Tech spending on AI infrastructure: Microsoft’s increased spending on data center infrastructure in its latest quarterly results signaled continued investment in AI technology, benefiting chip suppliers like Nvidia and AMD
  4. Industry-wide rally: Other semiconductor companies, including Broadcom, Micron, Taiwan Semiconductor, ASML, and Super Micro, also saw gains on Wednesday.

The rally came after a period of decline, with Nvidia’s stock having dropped more than 20% from its June peak. Morgan Stanley analysts identified five main factors contributing to the recent decline: spending strategies, competitive pressures, export limitations, supply chain anxieties, and valuation concerns. However, they believe that despite these issues, the earnings environment is likely to remain strong for Nvidia and the AI sector as a whole. Despite recent fluctuations, Nvidia’s stock has shown impressive growth in 2024, rising over 130% year-to-date and significantly outperforming the Nasdaq’s 17% increase. The company is scheduled to release its next quarterly earnings report on August 28, 2024

*Stock data, cryptocurrency, and commodity prices at the market closing.


Click here to read our current Economic Forecast – August 2024 Economic Forecast: New Recession Flag


Today’s Economic Releases Compiled by Steven Hansen, Publisher:

The ADP National Employment Report shows job creation edged down as pay gains continued to slow in July  2024, with private employers adding 122,000 jobs. Year-over-year pay gains for job-stayers were 4.8 percent in July, the slowest pace of growth in three years. Job-changers saw a big drop, with pay gains slowing to 7.2 percent from 7.7 percent. 122,000 job growth is not excellent for a growing economy – HOWEVER over the past 18 months, ADP’s job growth rate has been significantly under the BLS’ growth rate [see graph below]. ADP chief economist Nela Richardson added:
With wage growth abating, the labor market is playing along with the Federal Reserve’s effort to slow inflation. If inflation goes back up, it won’t be because of labor.

Pending home sales in June 2024 declined 2.6% from the previous year in June of 2024 but better than the 6.6% drop in May. Overall, home sales are down over 25% from 2001 levels. The household growth rate is slightly less than 1% per year since 2001 which means the need for housing should be up 25% from 2001 (not down 25%). NAR Chief Economist Lawrence Yun added:

The rise in housing inventory is beginning to lead to more contract signings. Multiple offers are less intense, and buyers are in a more favorable position.

The Chicago Business Barometer, also known as the Chicago PMI, fell to 45.3 in July 2024 from a seven-month high of 47.4 in June. Readings below 50 indicate contraction. This index is viewed as an early indicator the the national ISM manufacturing index which will be released tomorrow. The bottom line is that data continues to indicate that July manufacturing is in a recession.

The Federal Reserve released their FOMC meeting statement for 31 July 2025. The meeting statement seems to suggest that the FOMC is closer to starting a reduction in the federal funds rate. Here is a portion of the statement and you can draw your own conclusion.

Recent indicators suggest that economic activity has continued to expand at a solid pace. Job gains have moderated, and the unemployment rate has moved up but remains low. Inflation has eased over the past year but remains somewhat elevated. In recent months, there has been some further progress toward the Committee’s 2 percent inflation objective.

The Committee seeks to achieve maximum employment and inflation at the rate of 2 percent over the longer run. The Committee judges that the risks to achieving its employment and inflation goals continue to move into better balance. The economic outlook is uncertain, and the Committee is attentive to the risks to both sides of its dual mandate.

In support of its goals, the Committee decided to maintain the target range for the federal funds rate at 5-1/4 to 5-1/2 percent. In considering any adjustments to the target range for the federal funds rate, the Committee will carefully assess incoming data, the evolving outlook, and the balance of risks. The Committee does not expect it will be appropriate to reduce the target range until it has gained greater confidence that inflation is moving sustainably toward 2 percent. In addition, the Committee will continue reducing its holdings of Treasury securities and agency debt and agency mortgage‑backed securities. The Committee is strongly committed to returning inflation to its 2 percent objective.

In assessing the appropriate stance of monetary policy, the Committee will continue to monitor the implications of incoming information for the economic outlook. The Committee would be prepared to adjust the stance of monetary policy as appropriate if risks emerge that could impede the attainment of the Committee’s goals. The Committee’s assessments will take into account a wide range of information, including readings on labor market conditions, inflation pressures and inflation expectations, and financial and international developments.

Here is a summary of headlines we are reading today:

Click on the “Read More” below to access these, other headlines, and the associated news summaries moving the markets today.

Today Through the Fourth Friday (22 to 28 days) Weather Outlook for the U.S. and a Six-Day Forecast for the World: posted July 31, 2024

This article focuses on what we are paying attention to in the next 48 to 72 hours. The article also includes weather maps for longer-term U.S. outlooks and a six-day World weather outlook which can be very useful for travelers.

First the NWS Short Range Forecast. The afternoon NWS text update can be found here after about 4 p.m. New York time but it is unlikely to have changed very much from the morning update. The images in this article automatically update.

Short Range Forecast Discussion
NWS Weather Prediction Center College Park MD
428 PM EDT Tue Jul 30 2024
Valid 00Z Wed Jul 31 2024 – 00Z Fri Aug 02 2024

…There is an Enhanced Risk of severe thunderstorms over parts of the
Central Plains and Middle Mississippi Valley on Tuesday evening and
Wednesday with a Slight Risk of severe thunderstorms over parts of the
Ohio Valley on Thursday…

…There is a Slight Risk of excessive rainfall over parts of the Middle
Mississippi Valley and Ohio/Tennessee Valleys on Tuesday evening and
Wednesday…

…There is a Slight Risk of excessive rainfall over parts of Northern New
England and Southwest on Wednesday and over parts of the Ohio Valley on
Thursday…

…There are Excessive Heat Watches over parts of the Pacific Northwest
and Excessive Heat Warnings/Advisories over parts of the Central/Southern
Plains, Middle/Lower Mississippi Valley, Ohio/Tennessee Valleys, and the
Southeast.

A front with a wave of low pressure over the Northern High Plains will
move slowly eastward to the Ohio Valley/Great Lakes by Thursday. The
associated boundary will aid in triggering showers and severe
thunderstorms over parts of the Central Plains, Middle Mississippi Valley,
and parts of the Ohio/Tennessee Valleys. Therefore, the SPC has issued an
Enhanced Risk (level 3/5) of severe thunderstorms over the Central Plains
and Middle Mississippi Valley through Wednesday morning. The hazards
associated with these thunderstorms are frequent lightning, severe
thunderstorm wind gusts, hail, and a few tornadoes. Also, there is a
threat of severe thunderstorm wind gust of 65 knots, or greater over parts
of the Central Plains, Middle Mississippi Valley and hail two inches, or
greater over parts of the Central Plains.

In addition, showers and thunderstorms will create heavy rain over parts
of the Middle Mississippi Valley and Ohio/Tennessee Valleys. Therefore,
the WPC has issued a Slight Risk (level 2/4) of excessive rainfall over
parts of the Middle Mississippi Valley and Ohio/Tennessee Valleys through
Wednesday morning. The associated heavy rain will create mainly localized
areas of flash flooding, with urban areas, roads, small streams, and
low-lying areas the most vulnerable.

A second area of severe thunderstorms is forecast over parts of the
Northern Plains. Therefore, the SPC has issued a Slight Risk (level 2/5)
of severe thunderstorms over parts of the Northern Plains through
Wednesday morning. The hazards associated with these thunderstorms are
frequent lightning, severe thunderstorm wind gusts, hail, and a few
tornadoes.

As the wave of low-pressure moves eastward overnight Tuesday into
Wednesday, the system will create showers and severe thunderstorms over
parts of the Middle Mississippi Valley. Therefore, the SPC has issued an
Enhanced Risk (level 3/5) of severe thunderstorms over the Middle
Mississippi Valley from Wednesday through Thursday morning. The hazards
associated with these thunderstorms are frequent lightning, severe
thunderstorm wind gusts, hail, and a few tornadoes. Moreover, there is an
increased threat of severe thunderstorms wind gust of 65 knots or greater
over parts of the Central/Southern Plains and Upper/Middle Mississippi
Valley. Additionally, there is a threat of hail two inches or greater over
parts of the Northern/Central Plains and Upper Mississippi Valley.

Furthermore, showers and thunderstorms will produce heavy rain over parts
of the Northern Plains, Upper/Middle Mississippi Valley, and Ohio Valley.
Therefore, the WPC has issued a Slight Risk (level 2/4) of excessive
rainfall over parts of these areas from Wednesday through Thursday
morning. The associated heavy rain will create mainly localized areas of
flash flooding, with urban areas, roads, small streams, and low-lying
areas the most vulnerable.

Moreover, upper-level energy and a plume of moisture moving over New
England will produce areas of heavy rain. Therefore, the WPC has issued a
Slight Risk (level 2/4) of excessive rainfall over parts of Northern New
England from Wednesday through Thursday morning. The associated heavy
rain will create mainly localized areas of flash flooding, with urban
areas, roads, small streams, and low-lying areas the most vulnerable.

Similarly, upper-level energy and a plume of moisture will create areas of
heavy rain over parts of the Southwest. Therefore, the WPC has issued a
Slight Risk (level 2/4) of excessive rainfall over parts of the Southwest
from Wednesday through Thursday morning. The associated heavy rain will
create mainly localized areas of flash flooding, with urban areas, roads,
small streams, and low-lying areas the most vulnerable.

On Thursday, the wave of low pressure continues to move eastward,
producing showers and severe thunderstorms over parts of the Ohio Valley.
Therefore, on Thursday, the SPC issued a Slight Risk (level 2/5) of severe
thunderstorms over parts of the Ohio Valley. The hazards associated with
these thunderstorms are frequent lightning, severe thunderstorm wind
gusts, hail, and a few tornadoes.

Likewise, the showers and thunderstorms will create heavy rain over parts
of the Ohio Valley/Great Lakes. Therefore, the WPC has issued a Slight
Risk (level 2/4) of excessive rainfall over parts of the Ohio Valley/Great
Lakes on Thursday. The associated heavy rain will create mainly localized
areas of flash flooding, with urban areas, roads, small streams, and
low-lying areas the most vulnerable.

Meanwhile, upper-level ridging will build over the Pacific Northwest,
spawning Excessive Heat Watches over parts of the region. The upper-level
ridging will aid in creating intense and widespread heat across portions
of the West late this week. High temperatures 10-15 degrees above normal
are expected across the Northwest and Northern High Plains later this
week, where several daily record high temperatures are forecast.

Moreover, the upper-level high will develop over the central portion of
the country, which will foster Excessive Heat Warnings/ Heat Advisories
over parts of the Central/Southern Plains, Middle/Lower Mississippi
Valley, Ohio/Tennessee Valleys, and the Southeast. The associated
dangerous heat, with high temperatures exceeding 100F and heat indices
near 110F, persists over the South-Central Plains and Mid-South through
Thursday. Multiple days of Major to Extreme HeatRisk are forecast for
portions of the southern Plains to the Southeast. These levels of heat
mean health impacts become more likely in general, and may occur in ANYONE
without adequate hydration or cooling

To get your local forecast plus active alerts and warnings click HERE and enter your city, state or zip code.

Learn about wave patterns HERE.

Then, looking at the world and of course, the U.S. shows here also. Today we are looking at precipitation.

Please click on “Read More” below to access the full Daily Report issued today.

30 July 2024 Market Close & Major Financial Headlines: Small Caps Sink Blaming Struggling Tech, Bitcoin Looses Luster, Markets Close Mixed

Summary Of the Markets Today:

  • The Dow closed up 203 points or 0.50%,
  • Nasdaq closed down 1.28%,
  • S&P 500 closed down 0.50%,
  • Gold $2,405 up $27.50,
  • WTI crude oil settled at $75 down $0.69,
  • 10-year U.S. Treasury 4.142 down 0.034 points,
  • USD index $104.55 down $0.010,
  • Bitcoin $65,705 down $1,066 or 1.60%,

Today’s Highlights:

This week’s focus is on three major events:

This week is crucial for investors, featuring the Fed’s interest-rate decision, the July jobs report, and earnings from four of the “Magnificent Seven” mega cap companies. Investors are particularly focused on whether the recent stock pullback has ended and are weighing expectations for rate cuts against concerns about Big Tech’s AI-driven performance. Semiconductor stocks, especially Nvidia, lagged, with Nvidia’s shares dropping significantly. Investors are closely watching Microsoft’s quarterly report, which will be followed by earnings from Apple, Amazon, and Meta. The market is keen to see if substantial AI investments are beginning to yield returns, especially after a volatile July that saw investors shift from Big Tech to small caps. Additionally, Starbucks and AMD are set to report their earnings after the market close. Despite uncertainties surrounding AI, a trend has emerged where investors support companies that post weak results but indicate a positive business outlook. The Fed began its July policy meeting, with expectations that there will be no immediate change in borrowing costs but potential groundwork for a rate cut in September, following encouraging June inflation data.

*Stock data, cryptocurrency, and commodity prices at the market closing.


Click here to read our current Economic Forecast – August 2024 Economic Forecast: New Recession Flag


Today’s Economic Releases Compiled by Steven Hansen, Publisher:

The S&P CoreLogic Case-Shiller U.S. 20-City Composite posted a year-over-year increase of 6.8% in May 2024, dropping from a 7.3% increase in the previous month. New York reported the highest annual gain among the 20 cities with a 9.4% increase in May, followed by San Diego and Las Vegas with increases of 9.1% and 8.6%, respectively. Portland once again held the lowest rank for the smallest year-over-year growth, notching a 1.0% annual increase in May. From CoreLogic’s  Dr. Selma Hepp:

In May, the CoreLogic S&P Case-Shiller Index slowed for the second consecutive month, to a 5.9% year-over-year gain, after peaking at 6.5% in February and March. The slowing of yearly gains continues to reflect a residual comparison with the strong 2023 spring season, while also illustrating the impact of slowing housing demand on cooling price growth. The housing market experienced considerable cooling at the end of the spring home-buying season as mortgage rates pushed beyond the 7% benchmark – which seems to be a mental barrier for potential homebuyers in deciding to enter the home-buying process. June existing home sales activity, reflecting high April mortgage rates, slowed to the lowest since the Great Financial Crisis.

The Conference Board Consumer Confidence Index® rose in July 2024 to 100.3 (1985=100), from a downwardly revised 97.8 in June. Consumer confidence has been little changed over the last 2 years. Dana M. Peterson, Chief Economist at The Conference Board added:

Confidence increased in July, but not enough to break free of the narrow range that has prevailed over the past two years. Even though consumers remain relatively positive about the labor market, they still appear to be concerned about elevated prices and interest rates, and uncertainty about the future; things that may not improve until next year.

The number of job openings was unchanged at 8.2 million on the last business day of June 2024. As the graph below shows, there is a correlation between job openings and employment gains. As the number of job openings is little changed – one would expect little change in employment growth when the July data is released later this week. Over the month, both the number of hires and total separations were little changed at 5.3 million and 5.1 million, respectively.

Here is a summary of headlines we are reading today:

Click on the “Read More” below to access these, other headlines, and the associated news summaries moving the markets today.

August 2024 Economic Forecast: New Recession Flag

Authored by Steven Hansen

EconCurrent‘s Economic Index marginally improved and is slightly in negative territory. The economy remains very stratified where some sectors are going gangbusters, other sectors are barely above recessionary levels, whilst others are in recession territory. A new index is now indicating a recession is coming.  Read on to understand the currents affecting our economic growth.

Today Through the Fourth Friday (22 to 28 days) Weather Outlook for the U.S. and a Six-Day Forecast for the World: posted July 30, 2024

This article focuses on what we are paying attention to in the next 48 to 72 hours. The article also includes weather maps for longer-term U.S. outlooks and a six-day World weather outlook which can be very useful for travelers.

First the NWS Short Range Forecast. The afternoon NWS text update can be found here after about 4 p.m. New York time but it is unlikely to have changed very much from the morning update. The images in this article automatically update.

Short Range Forecast Discussion
NWS Weather Prediction Center College Park MD
Tue Jul 30 2024
Valid 12Z Tue Jul 30 2024 – 12Z Thu Aug 01 2024

…Daily scattered flash flooding and severe weather from the Mid-Atlantic
into the Northern Plains/Midwest…

…Dangerous mid-summer heat wave to expand across the Central U.S. and
Southeast; more hot weather across the West…

An active, unsettled pattern will continue across the eastern half of the
Lower 48 as an elongated frontal system with access to abundant moisture
and instability leads to repeat bouts of thunderstorms through midweek.
This will maintain a daily threat of scattered (level 2/5) flash flooding
and severe weather from the Mid-Atlantic, Ohio/Tennessee Valley, Midwest,
and Northern Plains through Thursday. Daily isolated flash flooding
chances should also continue across the Southwest tied to the monsoon.

Thunderstorms aside, heat will become the big story over the Central and
Southeast U.S. this week as an upper-level high strengthens. Forecast high
temperatures Monday and Tuesday are expected to soar into the triple
digits over the Central Plains, with upper-90s to low 100s to the west
over much of the High Plains, and mid-to upper 90s for the Middle and
Lower Mississippi Valley. High humidity values over the Mississippi Valley
and eastern portions of the plains will lead to heat indices in the
105-110 degree range, potentially as high as 115 for some locations, with
widespread Excessive Heat Warnings and Advisories in place. Warm morning
lows only dropping into the mid- to upper 70s will provide little relief
from the heat overnight. This combination of hotter temperatures to the
west, higher heat indices to the east, and the multi-day duration of this
heat wave will increase the danger not only to more sensitive groups, but
also the general public, particularly those without adequate air
conditioning.

West of the Continental Divide, a troughing pattern and associated cool
weather over the West will give way to widespread warm weather by Thursday
as a stationary Pacific front washes away beneath widespread height rises
across the region. By Friday, we can expect high temperatures in the 90’s
and triple digits across much of the West which could challenge numerous
records across the region. Unfortunately, smoke from area wildfires will
also continue to plague parts of the West, particularly over portions of
the northern Great Basin, resulting in poor air quality and areas of
reduced visibility.

To get your local forecast plus active alerts and warnings click HERE and enter your city, state or zip code.

Learn about wave patterns HERE.

Then, looking at the world and of course, the U.S. shows here also. Today we are looking at precipitation.

Please click on “Read More” below to access the full Daily Report issued today.