Today Through the Fourth Friday (22 to 28 days) Weather Outlook for the U.S. and a Six-Day Forecast for the World: posted July 2, 2024

This article focuses on what we are paying attention to in the next 48 to 72 hours. The article also includes weather maps for longer-term U.S. outlooks and a six-day World weather outlook which can be very useful for travelers.

First the NWS Short Range Forecast. The afternoon NWS text update can be found here after about 4 p.m. New York time but it is unlikely to have changed very much from the morning update. The images in this article automatically update.

Short Range Forecast Discussion
NWS Weather Prediction Center College Park MD
Tue Jul 02 2024
Valid 12Z Tue Jul 02 2024 – 12Z Thu Jul 04 2024

…Dangerously hot conditions to impact much of the southern Plains, lower
Mississippi Valley, and western U.S. this week…

…Severe thunderstorms and flash flooding possible over portions of the
Midwest through midweek…

…Unsettled weather with localized flash flooding chances continue across
the Southeast and southern Rockies…

Over 60 million residents are currently under heat-related watches,
warnings, and advisories this morning as early-July heat swelters much of
the south-central and western United States. The weather pattern
responsible for the potentially record-breaking heat includes upper-level
ridging just off the West Coast and and a separate upper ridge over the
south-central U.S. today before sliding to the east by midweek. For the
southern Plains, high temperatures are forecast to soar into the upper 90s
and low 100s. When combined with elevated humidity levels, heat indices
are forecast to rise into the 110s across the lower Mississippi Valley and
Gulf Coast. Excessive Heat Warnings and Heat Advisories currently span
from Kansas/Missouri to the Gulf Coast States. After enjoying a refreshing
start to the workweek, the Midwest and East Coast can expect a gradual
return to muggy summer warmth by Wednesday as surface high pressure
reorients itself off the East Coast and ushers in southerly flow. Extreme
heat building throughout the West Coast and more specifically interior
California this week will be particularly dangerous for those without
effective cooling. High temperatures away from the immediate coastline are
forecast to reach into the 105-115F range, which could break numerous
daily records in the San Joaquin and Sacramento Valleys. Heat begins to
build northward on Independence Day as highs into the 90s reach Oregon and
interior Washington. Excessive Heat Warnings, Watches, and Heat Advisories
go into effect today for some and stretch from southwest Washington to the
Desert Southwest. The duration of this heat wave is concerning as the
current forecast keeps scorching conditions in place through at least the
end of the week. This magnitude and duration of heat could pose a danger
to the public if proper heat safety is not followed. This includes staying
hydrated, out of direct sunlight, and in properly air-conditioned
buildings. Additionally, it is very important to check on vulnerable
friends, family, and neighbors to confirm their safety.

Active and stormy weather associated with a few storm systems progressing
from the northern Rockies to the Midwest this week will create fireworks
of their own this holiday week. Initially, a cold front swinging from the
upper Midwest to the Great Lakes by early Wednesday is forecast to spark
numerous thunderstorms from northeast Kansas to central Wisconsin. Some
storms could turn severe and produce damaging wind gusts, a few tornadoes,
and large hail from northeast Kansas to southern Iowa. This area is
highlighted by the Storm Prediction Center as having an Enhanced Risk
(level 3/5) of severe weather. Thunderstorms are also expected to contain
intense rainfall rates as elevated levels of atmospheric moisture content
remain in place. Flood Watches have been issued for much of Iowa, with the
threat of scattered flash floods also encompassing much of the Midwest
today. For areas experiencing swollen rivers from prior rainfall, any
additional heavy rain could exacerbate flooding concerns. By Wednesday, a
cold front is forecast to stretch from the lower Great Lakes to the
central/southern Plains and provide a focus for additional potent
thunderstorms across the mid-Mississippi Valley. Once again thunderstorms
are expected to produce the potential for damaging wind gusts and flash
flooding. A separate area of potentially organized convection may impact
the central High Plains, where a greater threat for large hail and
tornadoes exists. The Fourth of July will feature the aforementioned
frontal boundary lingering over the Ohio Valley and lifting as a warm
front over the central Plains as an area of low pressure ejects off the
High Plains. This will lead to shower and thunderstorm chances from the
northern Plains and Midwest to the Ohio Valley and Mid-Atlantic, with the
highest chances for severe weather extending from eastern Kansas to
central/southern Missouri.

Continued sufficient moisture content over the Southwest and southern
Rockies will also aid in the development of daily showers and
thunderstorms capable of producing localized instances of flash flooding
through midweek. Regions most likely to be affected by scattered downpours
include southeast Arizona and New Mexico, with burn scars and sensitive
terrain the most at risk for flash flooding. Meanwhile, a dying stationary
front entering the Southeast from the western Atlantic will also aid in
daily widely scattered thunderstorms across the Gulf Coast, Florida, and
the Southeast coastline/southern Georgia.

To get your local forecast plus active alerts and warnings click HERE and enter your city, state or zip code.

Learn about wave patterns HERE.

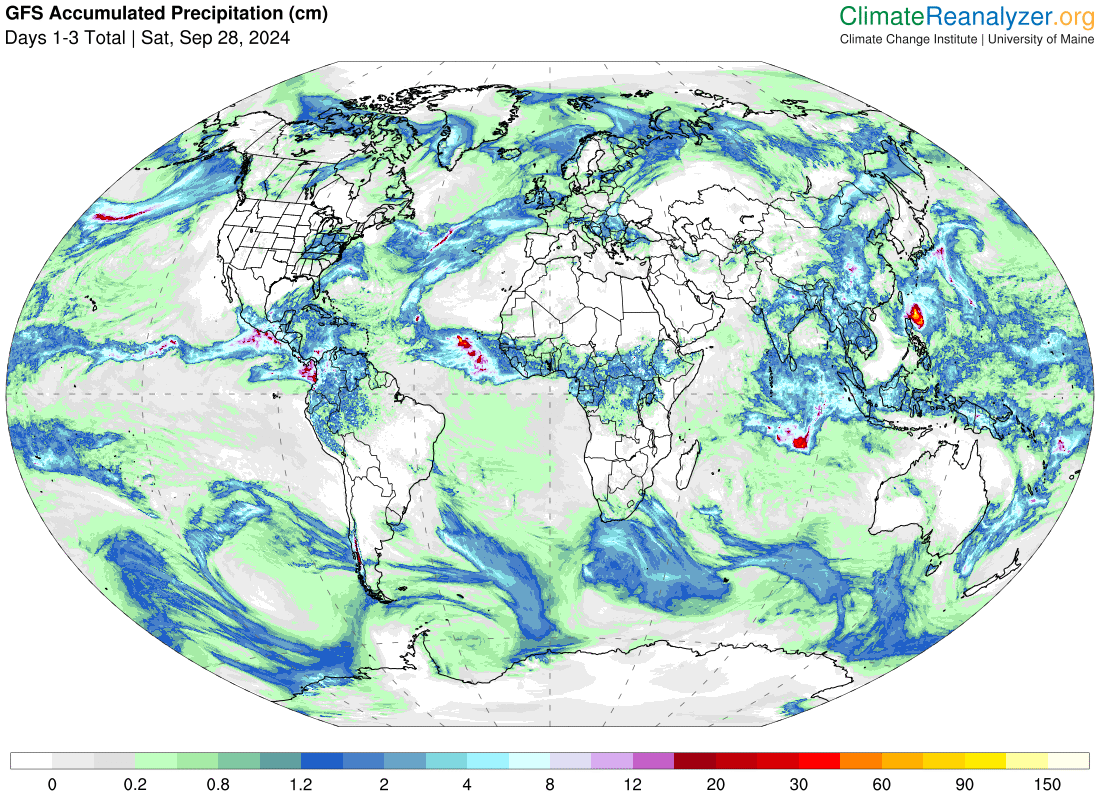
Then, looking at the world and of course, the U.S. shows here also. Today we are looking at precipitation.

Please click on “Read More” below to access the full Daily Report issued today.

01 July 2024 Market Close & Major Financial Headlines: Wall Street’s Three Major Indexes Gapped Fractionally Higher At The Opening Bell Then Dropping To The unchanged Line For Most Of The Session, Finally Closing In The Green

Summary Of the Markets Today:

  • The Dow closed up 51 points or 0.13%,
  • Nasdaq closed up 0.83%,
  • S&P 500 closed up 0.27%,
  • Gold $2,341 up $1.40,
  • WTI crude oil settled at $84 up $1.96,
  • 10-year U.S. Treasury 4.469 up 0.126 points,
  • USD index $105.82 down $0.04,
  • Bitcoin $63,205 up $537 or 0.86%

*Stock data, cryptocurrency, and commodity prices at the market closing.


Click here to read our current Economic Forecast – July 2024 Economic Forecast: One Recession Flag Removed But Little Indication The Economy Is Strengthening


Today’s Economic Releases Compiled by Steven Hansen, Publisher:

Total Construction spending is up 6.4% year-over-year in May 2024 – down from 7.6% year-over-year last month. Private construction was up 5.4% year-over-year whilst public construction was up 9.7% year-over-year. As one can see from the graph below, construction spending is on a slowing trendline – but still remains a bright spot in the economy.

The Manufacturing PMI® registered 48.5 percent in June 2024, down 0.2 percentage point from the 48.7 percent recorded in May. A Manufacturing PMI® above 42.5 percent, over a period of time, generally indicates an expansion of the overall economy. The New Orders Index remained in contraction territory, registering 49.3 percent, 3.9 percentage points higher than the 45.4 percent recorded in May. The Backlog of Orders Index registered 41.7 percent, down 0.7 percentage point compared to the 42.4 percent recorded in May. The bottom line is that  for the last 18 months, manufacturing has remained a weak spot in the economy with no evidence of growing strength.

Here is a summary of headlines we are reading today:

Click on the “Read More” below to access these, other headlines, and the associated news summaries moving the markets today.

NOAA Updates its Mid-month Outlook for July, 2024 – Did they Get it Right this Time? – Posted on July 1, 2024

At the end of every month, NOAA updates its Outlook for the following month which in this case is July of 2024. We are reporting on that tonight.

There have been some significant changes in the Outlook for July and these are addressed in the NOAA Discussion so it is well worth reading.  We provided the prior Mid-Month Outlook for July for comparison. It is easy to see the substantial changes in the weather outlook by comparing the Mid-Month and Updated Maps.

The article includes the Drought Outlook for July. NOAA also adjusted the previously issued Seasonal (JAS) Drought Outlook to reflect the changes in the July Drought Outlook. We also provide the Week 2/3 Tropical Outlook for the World.

The best way to understand the updated outlook for July is to view the maps and read the NOAA discussion. I have highlighted the key statements in the NOAA Discussion.

I am going to start with graphics that show the updated Outlook for July and the Mid-Month Outlook for July. This is followed by a graphic that shows both the Updated Outlook for July and the previously issued three-month outlook for JAS 2024. So you get the full picture in three graphics.

Here is the updated Outlook for July 2024.


For Comparison Purposes, Here is the earlier Mid-Month Outlook for July.

It is important to remember that the maps show deviations from the current definition of normal which is the period 1991 through 2020.  So this is not a forecast of the absolute value of temperature or precipitation but the change from what is defined as normal or to use the technical term climatology.

It is a substantial change from what was issued on June 20, 2024. Remember, it is the first set of maps that are the current outlook for July.  One expects some changes  10 days later. However, the changes to the updated July Outlook are significant.  This then gives us some reason to question the (June 20, 2024) three-month JAS temperature and precipitation Outlooks which are shown in the following graphic.

NOAA provided a combination of the Updated Outlook for July and the Three-Month Outlook.

The top pair of maps are again the Updated Outlook for the new month. There is a temperature map and a precipitation map. The bottom row shows the three-month outlooks which includes July the new month. I think the outlook maps are self-explanatory.

To the extent that one can rely on a forecast, we would conclude that August and September will be very different than July, especially for precipitation. You can subtract July from the three-month Outlook and divide by two to get a combined August-September Outlook.

However given the major change in the new July outlook from what was issued on June 20,  2024, we might not trust the Seasonal Outlook issued on June 20, 2024. Something to think about.

Some readers may need to click “Read More” to read the rest of the article.  Some will feel that they have enough information. But there is a lot more information in the rest of this article.

Today Through the Fourth Friday (22 to 28 days) Weather Outlook for the U.S. and a Six-Day Forecast for the World: posted July 1, 2024

This article focuses on what we are paying attention to in the next 48 to 72 hours. The article also includes weather maps for longer-term U.S. outlooks and a six-day World weather outlook which can be very useful for travelers.

First the NWS Short Range Forecast. The afternoon NWS text update can be found here after about 4 p.m. New York time but it is unlikely to have changed very much from the morning update. The images in this article automatically update.

Short Range Forecast Discussion
NWS Weather Prediction Center College Park MD
Mon Jul 01 2024
Valid 12Z Mon Jul 01 2024 – 12Z Wed Jul 03 2024

…Dangerously hot conditions will continue across the southern Plains and
lower Mississippi Valley, while simmering heat builds throughout
California’s Central Valley starting Tuesday…

…Heavy rain and flash flooding likely across parts of the Southeast
coastline today…

…Severe thunderstorm and heavy rain threat situated over northern Plains
and Midwest early this week…

July kicks off with anomalous and potentially dangerous heat impacting the
south-central U.S. and portions of the West Coast. As of this morning,
over 50 million residents are under heat-related watches, warnings, and
advisories. The upper-level pattern throughout the next few days
responsible for the summer heat consists of ridging just off the West
Coast and over the lower Mississippi Valley, while an upper trough
situates over the northern Rockies and northern Plains. For the central
U.S., high temperatures are forecast to soar into the upper 90s and low
100s across the southern Plains through midweek. When combined with
elevated humidity levels, heat indices are forecast to rise into the 110s
across the lower Mississippi Valley and Gulf Coast. Excessive Heat
Warnings and Heat Advisories currently span from Kansas to the Gulf Coast
States. After enjoying a refreshing start to the workweek, the Midwest and
East Coast can expect a gradual return to muggy summer warmth by Wednesday
as surface high pressure reorients itself off the East Coast and ushers in
southerly flow. Extreme heat building throughout the West Coast and more
specifically interior California this week will also be particularly
dangerous for those without effective cooling. High temperatures away from
the immediate coastline are forecast to reach into the 100-110F range,
which could break numerous daily records in the San Joaquin and Sacramento
valleys on Tuesday and Wednesday. Excessive Heat Warnings, Watches, and
Heat Advisories go into effect as early as Tuesday and span from southern
Oregon to the low desert of southeast California. The duration of this
heat wave is concerning as the current forecast keeps scorching conditions
in place through at least the end of the week. This level of heat could
pose a danger to the entire population if proper heat safety is not
followed. This includes staying hydrated, out of direct sunlight, and in
properly air-conditioned buildings. Additionally, it is very important to
check on vulnerable friends, family, and neighbors to confirm their safety.

A cold front sliding down the East Coast today is forecast to slow its
southerly motion as it intersects the Southeast coastline, with developing
thunderstorms along the boundary. Some storms are expected to contain
intense rainfall rates and slow propagation, which creates the threat for
flash flooding. Parts of the South Carolina coastline, including the city
of Charleston, has been highlighted as having a Moderate Risk (level 3/4)
of Excessive Rainfall today. Areas most at risk for flooding are locations
with poor drainage, where heavy rainfall coincides with the afternoon high
tide, and in urbanized communities. Be sure to remain weather aware and
always remember to never drive through flooded roads.

Additionally, a storm system exiting the northern Rockies this morning is
anticipated to create some pre-Independence Day fireworks across the
northern Plains and Midwest through midweek as the threat of heavy rain
and severe weather slides eastward with time. Severe thunderstorm chances
are centered over Nebraska South Dakota today, with neighboring states
included in the potential for potent thunderstorms capable of containing
damaging wind gusts and sporadic hail. Of potentially greater concern
throughout the upper Mississippi Valley is the prospect for more heavy
rainfall over saturated soils and swollen rivers. As approaching frontal
boundaries provide a focus for several clusters of thunderstorms, areas of
intense rainfall rates are possible throughout the northern Plains and
upper Midwest today before sliding gradually eastward on Tuesday, but
still remaining centered over the Midwest. Probabilities for at least 1
inch of rain are high (70-90%) for much of Iowa, eastern Nebraska,
southern Minnesota, central/southern Wisconsin, and far northwest Illinois
through Tuesday. This next round of heavy rain could create instances of
flash flooding as well as exacerbate ongoing river flooding across areas
still recovering from last weeks heavy rainfall.

Continued sufficient moisture content over the Southwest and southern
Rockies will also aid in daily showers and thunderstorms capable of
producing localized instances of flash flooding. Regions most likely to be
affected by scattered downpours include Arizona, New Mexico, and
southwestern Colorado, with burn scars and sensitive terrain the most at
risk for flash flooding.

To get your local forecast plus active alerts and warnings click HERE and enter your city, state or zip code.

Learn about wave patterns HERE.

Then, looking at the world and of course, the U.S. shows here also. Today we are looking at precipitation.

Please click on “Read More” below to access the full Daily Report issued today.

M2 Money Supply and CPI Inflation. Part 4

This article concludes the analysis of the correlation patterns between the M2 Money Supply and Consumer Inflation (CPI).  The last of the three types of inflation patterns (time periods with no significant inflation trends) is the subject of analysis here.  The other two types of patterns (inflation surges1 and disinflation/deflation surges2) were analyzed previously.  The conclusion discusses the correlation patterns for all time periods, looks for any common threads, and identifies important differences across time periods and types of correlation patterns.


Image by Gerd Altmann from Pixabay.

Today Through the Fourth Friday (22 to 28 days) Weather Outlook for the U.S. and a Six-Day Forecast for the World: posted June 30, 2024

This article focuses on what we are paying attention to in the next 48 to 72 hours. The article also includes weather maps for longer-term U.S. outlooks and a six-day World weather outlook which can be very useful for travelers.

First the NWS Short Range Forecast. The afternoon NWS text update can be found here after about 4 p.m. New York time but it is unlikely to have changed very much from the morning update. The images in this article automatically update.

Short Range Forecast Discussion
NWS Weather Prediction Center College Park MD
Sun Jun 30 2024
Valid 12Z Sun Jun 30 2024 – 12Z Tue Jul 02 2024

…Dangerously hot conditions will continue for the Southeast through the
end of the weekend, while simmering heat builds across the southern Plains
and California’s Central Valley early this week…

…Severe thunderstorm and heavy rain threat for the East Coast today…

…Showers and thunderstorms for the Four Corners/Southwest over the next
few days; wet weather returns to the upper Midwest by Monday…

The transition to July will continue to feature areas of potentially
dangerous heat throughout parts of the southern U.S. and California. At
the upper levels, higher pressure over the southern Plains and lower
Mississippi Valley will focus much of the heat over the south-central U.S.
over the next few days before ridging begins to build toward the West
Coast by Tuesday. This equates to high temperatures in the mid-to-upper
90s today from the Mid-Atlantic to the southern Plains. This level of heat
and the potential for maximum temperatures into the low 100s are expected
to remain throughout the south-central U.S. through at least Tuesday,
while much of the Southeast and Mid-Atlantic cools off behind a cold
front. Overnight temperatures are expected to be quite warm over the
southern Plains and not offer much time for relief after scorching daytime
temperatures. In fact, several daily warm minimum temperature records
could be broken/tied over the next few days in this region. Excessive Heat
Warnings and Heat Advisories currently stretch from Texas to New Jersey.
For California, a dangerous and long-duration heat event is forecast to
begin on Tuesday as high temperatures soar into the triple digits, which
has prompted Excessive Heat Warnings and Watches to be posted. These
readings will impact interior valley locations and areas away from the
immediate coastline. Residents and visitors are urged to follow proper
heat safety as this level of heat could be deadly for anyone without
effective cooling.

Thunderstorms and instances of heavy rain are forecast to impact parts of
the East Coast, Midwest, and Four Corners/Southwest over the next few
days. A potent cold front ushering in a comfortable airmass to the Great
Lakes and Midwest today will continue to trek towards the East Coast while
sparking numerous showers and thunderstorms. A few storms could turn
severe between Maine and the Carolinas, with damaging wind gusts the
primary weather hazard. Heavy rain could also lead to isolated flash
floods between New England and the Southeast. This same frontal boundary
is anticipated to focus additional thunderstorm chances on Monday across
the Southeast. The flash flood threat is expected to be highest across
coastal South Carolina and southeast Georgia, where slow-moving storms
could produce a few inches of rainfall in a very short period of time.

The other notable weather system impacting the Lower 48 at the midway
point of the year is forecast to push from the Intermountain West to the
upper Midwest by early this week. Lingering rainfall chances and the
potential for flash flooding is expected to continue as the upper trough
traversing the western U.S. maintains a fresh flow of moisture-rich air
into the Southwest and southern Rockies. Flash Flood Watches remain in
effect across parts of New Mexico, Colorado, and Utah. On the dry side of
the system, gusty winds and low relative humidity are anticipated to
create Critical Fire Weather across parts of the central Great Basin
today. Meanwhile, areas of robust thunderstorms could turn severe by this
evening throughout the northern High Plains as an area of low pressure
develops. This low pressure system is then forecast to spread unsettled
weather into the northern Plains and Upper Midwest on Monday. Scattered
severe thunderstorms are possible, with an elevated threat for tornadoes,
damaging wind gusts, and large hail over parts of central Nebraska. For
the upper Midwest, any heavy rain will be unwelcome as ongoing river
flooding impacts the region. Any additional rainfall could exacerbate
flooding concerns, with the potential for numerous thunderstorms creating
an increasing flash flood risk for this part of the country. As the system
continues to progress eastward on Tuesday and an attached cold front slows
its forward progress over the Midwest and central Plains, additional
chances for severe weather and heavy rain are expected to continue.

To get your local forecast plus active alerts and warnings click HERE and enter your city, state or zip code.

Learn about wave patterns HERE.

Then, looking at the world and of course, the U.S. shows here also. Today we are looking at precipitation.

Please click on “Read More” below to access the full Daily Report issued today.

Taking a Look at the June, 2024 EIA Monthly Energy Review – Posted on June 29, 2024

EIA  the U.S. Energy Information Agency has issued their Monthly Energy Review.

In this article, I present selected tables and graphics from the EIA Monthly Energy Review.  My comments as usual are in a box.

At the end of the article, I provided a link to the full Monthly Review. The EIA Monthly Energy Review is separate from its annual reporting on crude oil and natural gas reserves. My article on their estimates of reserves can be accessed HERE.

There are a number of graphics like this that show the source of the energy and where used.  As a bonus, this graphic also shows transmission costs for electricity which is more than the amount of electric energy that makes it to the end user. Notice the small contribution of renewables. Notice the large contribution of natural gas of which the U.S.  has substantial reserves.

This shows the emissions of greenhouse gases (actually only carbon dioxide.  Not surprisingly, the transportation sector is where most emissions are released.

Again you see the small contribution of wind and solar both of which are dominated by using wood which is kind of pathetic. The electric power industry uses a lot of energy to make electricity.

Here they look at petroleum products, not raw crude oil, and look at where they are used: Transportation. Will electric vehicles improve the situation? Probably not depending on how the electricity for electric vehicles is generated.

Some readers will need to click on “Read More” to access the remainder of this article.

Today Through the Fourth Friday (22 to 28 days) Weather Outlook for the U.S. and a Six-Day Forecast for the World: posted June 29, 2024

This article focuses on what we are paying attention to in the next 48 to 72 hours. The article also includes weather maps for longer-term U.S. outlooks and a six-day World weather outlook which can be very useful for travelers.

First the NWS Short Range Forecast. The afternoon NWS text update can be found here after about 4 p.m. New York time but it is unlikely to have changed very much from the morning update. The images in this article automatically update.

Short Range Forecast Discussion
NWS Weather Prediction Center College Park MD
Sat Jun 29 2024
Valid 12Z Sat Jun 29 2024 – 12Z Mon Jul 01 2024

…Severe thunderstorm and heavy rain threat enters the lower Great Lakes
and northern Mid-Atlantic today before sliding to the East Coast on
Sunday…

…Unsettled weather remains throughout parts of the southern Rockies and
Southwest over the next few days, while wet weather returns to the upper
Midwest by Monday…

…Dangerously hot conditions will continue from parts of the southern
Plains to the Southeast this weekend…

A surface low pressure system currently crossing the upper Great Lakes and
anticipated to swing through southeast Canada this weekend will help push
a cold front into the lower Great Lakes by tonight. This cold front is
expected to spark scattered strong to severe thunderstorms from the Ohio
Valley to the lower Great Lakes and northern Mid-Atlantic, with damaging
wind gusts and a few tornadoes the most likely weather hazards,
particularly from eastern Ohio to central Pennsylvania. Heavy rain may
also lead to instances of flash flooding throughout this region and into
the interior Northeast. As the cold front nears the East Coast on Sunday,
another round of robust thunderstorms are possible between the Southeast
and New England, with some storms containing frequent lightning and gusty
winds. This same frontal boundary will also be responsible for isolated to
widely scattered thunderstorms extending westward across the
mid-Mississippi Valley, central/southern Plains, and southern Rockies this
weekend. The slow-moving nature of thunderstorms over the sensitive
terrain of the southern Rockies and Southwest will create additional daily
chances for flash flooding through at least early next week. More
specifically, parts of northern New Mexico, southern Colorado, and
southeast Arizona are most likely to be dealing with thunderstorms
producing intense rainfall rates this weekend.

The next upper-level trough to traverse the Intermountain West is forecast
to spark thunderstorms across the northern High Plains on Sunday prior to
spreading rainfall chances into the upper Midwest on Monday. Heavy rain is
not welcome for much of the upper Mississippi and middle Missouri valleys
as ongoing river flooding continues. However, the threat for another round
of organized thunderstorms capable of containing intense rainfall rates
and severe weather has prompted a Slight Risk (level 2/4) of Excessive
Rainfall to be issued for much of the region on Monday.

Dangerously high heat and humidity is forecast to continue across the
south-central and southeastern U.S. through the start of July. High
temperatures into the mid-to-upper 90s and low 100s can be expected, with
heat index values up to 110 degrees throughout the lower Mississippi
Valley and parts of the southern Plains. Overnight temperatures will not
offer much relief and only dip into the low 80s and upper 70s. In fact,
the warm overnight temperatures are forecast to break dozens of daily
records and potentially a few June monthly records from the southern
Plains to Mid-Atlantic. Much cooler weather and below average temperatures
are forecast to follow high pressure as it builds southward from the
northern Plains today to the Midwest and Great Lakes on Sunday.
Comfortable high temperatures in the 70s with mostly sunny skies can be
anticipated across these locations.

To get your local forecast plus active alerts and warnings click HERE and enter your city, state or zip code.

Learn about wave patterns HERE.

Then, looking at the world and of course, the U.S. shows here also. Today we are looking at precipitation.

Please click on “Read More” below to access the full Daily Report issued today.

28 Jun 2024 Market Close & Major Financial Headlines: Small Caps Set New Historic Highs With The Nasdaq Rising Above 18K For The First Time. Unfortunately, The Markets Trended Sharply Down, Finally Closing Down Moderately In The Red.

Summary Of the Markets Today:

  • The Dow closed down 45 points or 0.12%,
  • Nasdaq closed down 0.71%, (Closed at 17,733, New Historic high 18,035)
  • S&P 500 closed down 0.41%,
  • Gold $2,337 down $0.10,
  • WTI crude oil settled at $81 down $0.29,
  • 10-year U.S. Treasury 4.396 up 0.106 points,
  • USD index $105.89 down $0.020,
  • Bitcoin $59,943 down $1,665 or 2.70%,
  • Baker Hughes Rig Count: U.S. -7 to 581 Canada +10 to 176

*Stock data, cryptocurrency, and commodity prices at the market closing.


Click here to read our current Economic Forecast – July 2024 Economic Forecast: One Recession Flag Removed But Little Indication The Economy Is Strengthening


Today’s Economic Releases Compiled by Steven Hansen, Publisher:

Real Disposable Personal Income increased 1.1% year-over-year in May 2024 – up marginally from last month’s 0.9% gain year-over-year. Real Personal Consumption Expenditures increased 2.4% year-over-year – up from 2.3% year-over-year last month. The inflation adjustment (price index) fell from 2.7% year-over-year last month to 2.6% in May 2024. The bottom line is that today’s data is a marginal improvement BUT this is not strong data – and I see no trend lines that scream that the data is slowly improving.

The Chicago PMI unexpectedly increased to 47.4 in June 2024 from last month’s 35.4. A reading above 50 would indicate a manufacturing expansion. Pundits use the Chicago PMI as an indicator of the direction of the National PMI which will be released next week. I am not a fan of surveys, and I see no data that would explain this improvement.

Here is a summary of headlines we are reading today:

Click on the “Read More” below to access these, other headlines, and the associated news summaries moving the markets today.
July 2024 Economic Forecast: One Recession Flag Removed But Little Indication The Economy Is Strengthening

Authored by Steven Hansen

EconCurrent‘s Economic Index marginally declined but remained slightly in positive territory. The economy remains very stratified where some sectors are going gangbusters, other sectors are barely above recessionary levels, whilst others are in recession territory. A major index is no longer indicating a recession is coming.  Read on to understand the currents affecting our economic growth.