Summary Of the Markets Today:
- The Dow closed down 28 points or 0.10%,
- Nasdaq closed down 0.09%,
- S&P 500 down 0.33%,
- WTI crude oil settled at $87 down $1.57,
- USD $113.31 up $0.01,
- Gold $1682 down $3.80,
- Bitcoin $19,140 up 1.71% – Session Low 19,003,
- 10-year U.S. Treasury 3.898% down 0.041%
*Stock data, cryptocurrency, and commodity prices at the market closing.
Today’s Economic Releases:
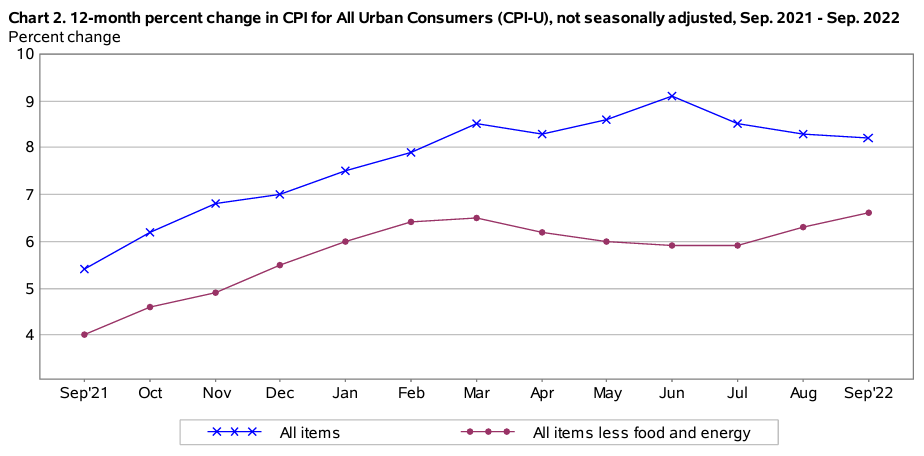
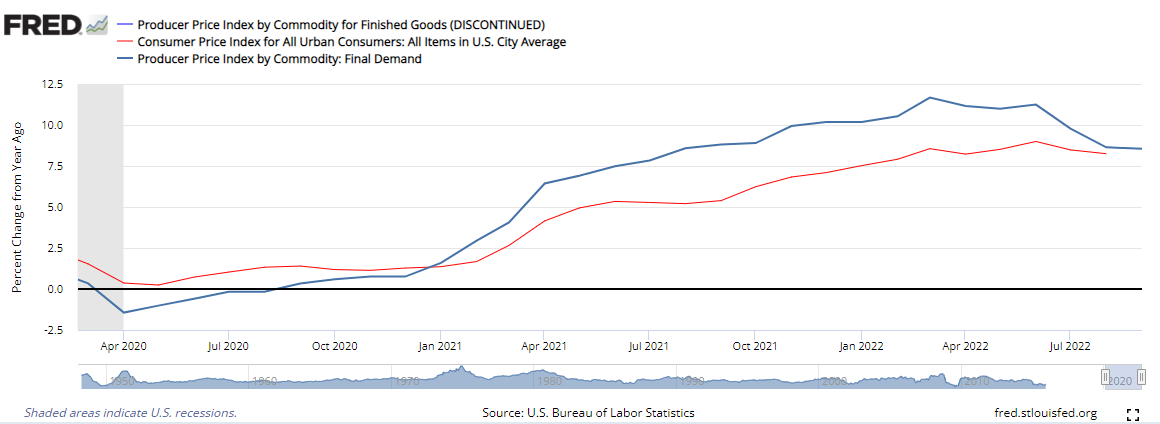
The Producer Price Index for final demand increased by 0.4% in September 2022. The index for final demand advanced 8.5% for the 12 months that ended in September. This would suggest that the CPI will come in near 8% (see graph below).
The Federal Reserve released the Minutes of the Federal Open Market Committee which was held on September 20-21, 2022. The bottom line was that the existing policy of aggressively raising the federal funds rate to stop inflation by slowing the economy would continue. Some interesting highlights:
…In discussing potential policy actions at upcoming meetings, participants continued to anticipate that ongoing increases in the target range for the federal funds rate would be appropriate to achieve the Committee’s objectives.
… Participants observed that inflation remained unacceptably high and well above the Committee’s longer-run goal of 2 percent. Participants commented that recent inflation data generally had come in above expectations and that, correspondingly, inflation was declining more slowly than they had previously been anticipating. Price pressures had remained elevated and had persisted across a broad array of product categories.
… Participants noted that, in keeping with the Committee’s Plans for Reducing the Size of the Federal Reserve’s Balance Sheet, balance sheet runoff had moved up to its maximum planned pace in September and would continue at that pace. They further observed that a significant reduction in the Committee’s holdings of securities was in progress and that this process was contributing to the move to a restrictive policy stance.
… They noted also that inflation had not yet responded appreciably to policy tightening and that a significant reduction in inflation would likely lag that of aggregate demand. Participants observed that a period of real GDP growth below its trend rate, very likely accompanied by some softening in labor market conditions, was required.
… participants remarked that purposefully moving to a restrictive policy stance in the near term was consistent with risk-management considerations. Many participants emphasized that the cost of taking too little action to bring down inflation likely outweighed the cost of taking too much action. Several participants underlined the need to maintain a restrictive stance for as long as necessary, with a couple of these participants stressing that historical experience demonstrated the danger of prematurely ending periods of tight monetary policy designed to bring down inflation.
Home Prices: How Much Trouble Are YOU In? Elliott Wave International just released a NEW report that shows you the dangers — and opportunities — unfolding now in key property markets around the world. If you own a home — or are thinking about buying one — you need to read this report. Get it FREE for a limited time at elliottwave.com now ($29 value).
A summary of headlines we are reading today:
- Trans-Pacific Shipping Rates Nosedive As Demand Dries Up
- Global Nickel Supply Shifts Into Surplus
- AMC Entertainment struggles with falling stock, high debt load, and light blockbuster schedule
- Nike moves to curb sneaker-buying bots and resale market with penalties
- PepsiCo hikes forecast after higher pricing helps boost revenue
- Demand for riskier home loans is high as interest rates soar
- Financial Crisis-Era Warning Bell Chimes For S&P 500
- FOMC Minutes Show Hawkish Fed Warn “Cost Of Doing Too Little Outweigh Cost Of Doing Too Much”
- Investors nervous as market sell-off intensifies
- Bond Report: Treasury yields drop by most in a week after Fed’s September meeting minutes
These and other headlines and news summaries moving the markets today are included below.


