26 NOV 2024 Market Close & Major Financial Headlines: The Dow And The S&P 500 Set New Historic Highs, But The S&P 500 Took A Steep Nosedive Ending Today’s Session Only Fractionally Higher In The Green

Summary Of the Markets Today:

  • The Dow closed up 124 points or 0.28%, (Closed at 44,293, New Historic high 44,903)
  • Nasdaq closed up 119 points or 0.63%,
  • S&P 500 closed up 35 points or 0.57%, (Closed at 6,001, New Historic high 6,021)
  • Gold $2,632 up $13.10 or 0.50%,
  • WTI crude oil settled at $69 down $0.29 or 0.42%,
  • 10-year U.S. Treasury 4.296 up 0.035 points or 0.821%,
  • USD index $106.95 up $0.13 or 0.12%,
  • Bitcoin $91,333 down $2,325 or 3.79%, (24 Hours)

*Stock data, cryptocurrency, and commodity prices at the market closing

Today’s Highlights

US stocks showed resilience on Tuesday despite President-elect Donald Trump’s threat to impose new tariffs on China, Canada, and Mexico. Both the Dow and S&P500 closed at record levels. Markets initially reacted negatively to Trump’s late Monday announcement of plans to implement significant tariffs on the US’s largest trading partners on his first day in office. This announcement reignited trade war concerns and dampened Wall Street’s expectations that Treasury Secretary nominee Scott Bessent would moderate any extreme actions by the new administration. Carmaker stocks, both domestic and international, experienced declines following Trump’s “America First” stance. The Mexican peso and Canadian dollar dropped sharply as the US dollar rallied. Investors also analyzed the minutes from the recent Federal Open Market Committee meeting, which indicated a preference for gradual interest rate cuts if the economy remains stable. Some officials noted that persistent inflation or a labor market downturn could lead to a pause in the easing cycle.


Click here to read our current Economic Forecast – November 2024 Economic Forecast: Our Index Marginally Declines – We Are Stuck With The Crappy Economy We Have Seen So Far This Year


Today’s Economic Releases Compiled by Steven Hansen, Publisher:

Sales of new single-family houses in October 2024 were 9.4% below October 2023. The median sales price of new houses sold in October 2024 was $437,300. The average sales price was $545,800. The seasonally-adjusted estimate of new houses for sale at the end of October was 481,000. This represents a supply of 9.5 months at the current sales rate. New home sales are declining due to high mortgage rates and high home prices.

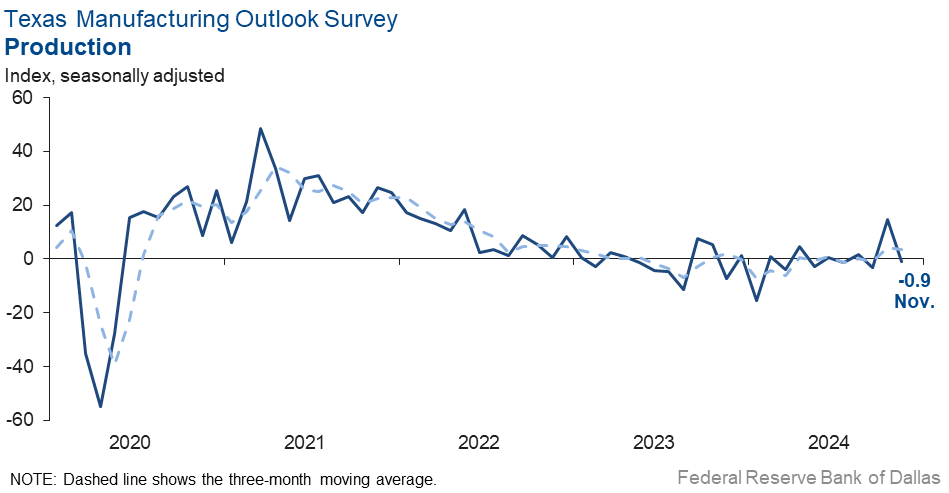
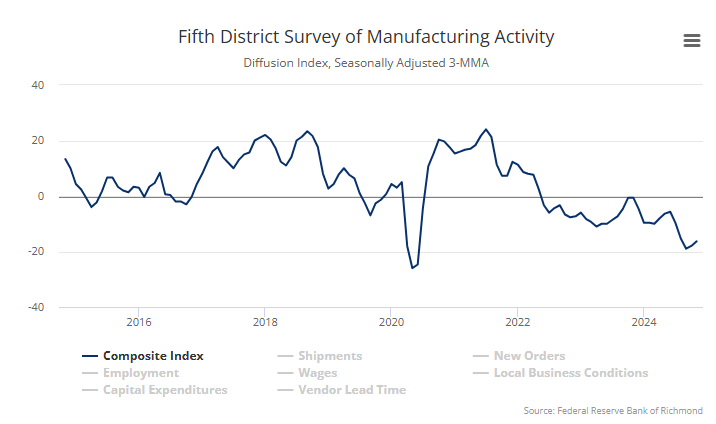
Richmond Fed manufacturing activity remained sluggish in November 2024. The composite manufacturing index remained at −14 in November. Of its three component indexes, shipments decreased from −8 to −12, new orders edged down from −17 to −19, and employment increased from −17 to −10. Manufacturing remains in a recession in the US.

The S&P CoreLogic Case-Shiller 20-City Composite posted a year-over-year increase of 4.6%, dropping from a 5.2% increase in the previous month. Home prices seem to be slightly moderating but home prices increasing do not make housing more affordable. I would expect further slowdown of existing home sales volumes.

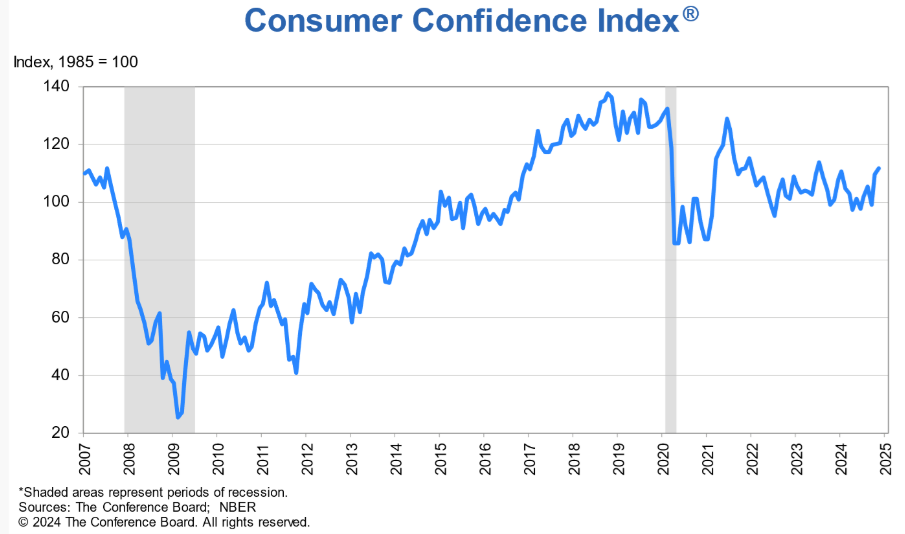
The Conference Board Consumer Confidence Index® increased in November 2024 to 111.7 (1985=100), up 2.1 points from 109.6 in October. Likely the results of the election pushed this OPINION index higher but I am not a fan of opinion. In the case of consumer confidence, it is generally believed that higher consumer confidence results in consumers spending more. Dana M. Peterson, Chief Economist at The Conference Board added:

Consumer confidence continued to improve in November and reached the top of the range that has prevailed over the past two years. November’s increase was mainly driven by more positive consumer assessments of the present situation, particularly regarding the labor market. Compared to October, consumers were also substantially more optimistic about future job availability, which reached its highest level in almost three years. 

The Federal Reserve issued meeting minutes for the Federal Open Market Committee meeting on November 6–7, 2024. I did not find any surprises in the meeting minutes. The following are a summary of the participants’ observations and evaluations:

  • Inflation has significantly decreased from its peak, although core inflation remains elevated. Most participants believe that inflation is on track to return sustainably to 2% despite expected month-to-month volatility. Disinflationary trends are evident across a broad range of core goods and services, with price increases now closer to historical stability rates. Participants noted increased consumer price sensitivity and reluctance from firms to raise prices.
  • While housing service prices are still high, expectations are that these will slow as rent increases for new tenants stabilize.
  • Recent data indicates solid labor market conditions, although temporary fluctuations have occurred due to strikes and natural disasters. Job vacancies and turnover rates are declining, suggesting easing labor demand. Nominal wage growth is decreasing, with job switchers facing a reduced wage premium. Participants noted that wage increases are unlikely to contribute to inflationary pressures in the near term. Businesses are becoming more selective in hiring due to a larger pool of qualified applicants willing to accept moderate wages.
  • Economic activity remains strong, supported by a robust labor market and rising household wealth. However, low-income households face financial strains, which could impact their spending behavior.
  • Favorable supply developments continue to support business expansion. However, there is uncertainty regarding the sustainability of recent productivity gains attributed to various factors including technology integration.
  • Participants agreed to lower the federal funds rate target range by 25 basis points to 4.5%-4.75%. This adjustment aims to sustain economic strength while progressing toward inflation goals. Future monetary policy decisions will depend on economic data trends and risks associated with employment and inflation goals. Participants emphasized the need for a balanced approach in adjusting policies based on evolving economic conditions.
  • Participants noted vulnerabilities in the financial system, particularly concerning commercial real estate (CRE) and potential risks from unrealized losses on bank assets. Cyber risks and rising delinquency rates among low-income households were also highlighted as areas needing close monitoring.

Here is a summary of headlines we are reading today:

  • Don’t Underestimate Trump’s Impact on U.S. LNG
  • U.S. Gas Drillers Saddle Up for Data Center-Fueled Demand Ride
  • U.S. Oil Output Hits Record High in August
  • Exxon: Don’t Expect ‘Drill, Baby, Drill’ Under Trump
  • China Set to Import Record-High Volume of Coal in November
  • Fed officials see interest rate cuts ahead, but only ‘gradually,’ meeting minutes show
  • Israel-Lebanon permanent ceasefire has been accepted, Biden says
  • Stocks rise Tuesday, Dow and S&P 500 close at records: Live updates
  • Small caps historically outperform even the Santa Claus rally, starting before Thanksgiving
  • Senate report slams airlines for raking in billions in seat fees
  • Bitcoin drops to $91,000 level as crypto markets slump: CNBC Crypto World
  • FOMC Minutes Show “Many” Members Suddenly Favor More Gradual Rate-Cutting-Cycle
  • 10-year Treasury yield logs biggest gain in 2 weeks after Fed minutes point to slower rate cuts

Click on the “Read More” below to access these, other headlines, and the associated news summaries moving the markets today.

Weather Outlook for the U.S. for Today Through at Least 22 Days and a Six-Day Forecast for the World: posted November 26, 2024

This article focuses on what we are paying attention to in the next 48 to 72 hours. The article also includes weather maps for longer-term U.S. outlooks (up to four weeks) and a six-day World weather outlook which can be very useful for travelers.

First the NWS Short Range Forecast. The afternoon NWS text update can be found here after about 4 p.m. New York time but it is unlikely to have changed very much from the morning update. The images in this article automatically update.

Short Range Forecast Discussion
NWS Weather Prediction Center College Park MD
Tue Nov 26 2024
Valid 12Z Tue Nov 26 2024 – 12Z Thu Nov 28 2024

…Heavy snow over parts of the Sierra Nevada Mountains, Great Lakes and
Central Rockies…

…Below average temperatures in the Plains…

A moderate level atmospheric river event will accompany a surface low
pressure system as it moves into the West today. This AR will spread
anomalous moisture over southern/central California, the Great Basin and
Central Rockies. Heavy coastal and mountain rain may lead to instances of
flash flooding, particularly over the windward foothills of the southern
Sierra Nevada below 8000 feet, where excessive rainfall may cause
land/rock/mudslides. Heavy snow accumulating between 1-3 feet are possible
over the higher elevations of the southern Sierra, as well as much of the
Intermountain West and Central Rockies today. Snow diminishes over the
Sierra on Wednesday while snow showers persist over the Colorado Rockies.
Snow showers continue across the Great Lakes this week with parts of the
Upper Peninsula of Michigan and downwind areas of Lake Ontario picking up
between 4-8 inches of snow by Thursday morning.

Troughing across the northern tier states will continue to promote below
average temperatures over the next several days. High temperatures in the
teens and 20s will represent a 15-25 degree departure from normal for much
of the far Northern Plains today and Wednesday. A pair of mid-level
disturbances are expected to phase over the Central U.S. and facilitate an
arctic outbreak across the region Wednesday night into Thanksgiving
Thursday.

To get your local forecast plus active alerts and warnings click HERE and enter your city, state or zip code.

Learn about wave patterns HERE.

Then, looking at the world and of course, the U.S. shows here also. Today we are looking at precipitation.

Please click on “Read More” below to access the full Daily Report issued today.

25 NOV 2024 Market Close & Major Financial Headlines: Wall Street’s Three Main Indexes Opened In The Green, The Dow And The S&P 500 recorded New Historic Highs, Finally Closing Fractionally Higher

Summary Of the Markets Today:

  • The Dow closed up 440 points or 0.99%,
  • Nasdaq closed up 51 points or 0.27%,
  • S&P 500 closed up 18 points or 0.30%,
  • Gold $2,629 down $84.30 or 3.12%,
  • WTI crude oil settled at $69 down $2.17 or 3.05%,
  • 10-year U.S. Treasury 4.265 down 0.147 points or 3.288%,
  • USD index $106.88 down $0.67 or 0.63%,
  • Bitcoin $94,959 down $1,700 or 1.79%, (24 Hours)

*Stock data, cryptocurrency, and commodity prices at the market closing

Today’s Highlights

U.S. stocks rose on Monday, driven by optimism over President-elect Donald Trump’s nomination of Scott Bessent for Treasury secretary. This announcement boosted investor sentiment, leading to significant gains across major indices: Dow Jones Industrial Average closing at a new record high. Russell 2000 surged over 2%, reaching a record high, as small-cap stocks rallied strongly. The market’s positive reaction was partly due to the perception that Bessent might moderate fiscal policies, which helped ease concerns about inflationary pressures. Additionally, investors are looking forward to the Federal Reserve’s preferred inflation measure, the Personal Consumption Expenditures price index, set for release on Wednesday. Bitcoin was attempting to reach the $100,000 mark but fell back below $95,000.


Click here to read our current Economic Forecast – November 2024 Economic Forecast: Our Index Marginally Declines – We Are Stuck With The Crappy Economy We Have Seen So Far This Year


Today’s Economic Releases Compiled by Steven Hansen, Publisher:

The Chicago Fed National Activity Index (CFNAI) three-month moving average, CFNAI-MA3, decreased to –0.24 in October 2024 from –0.21 in September. This is my favorite coincident indicator although like all indicators – at times, it is wrong in trend and value. And the 85 individual indicators it monitors will be revised for decades. That is why the CFNAI looks like it parallels GDP – but in real time it missed the start of the Great Recession. Consider this a tea leaf to be read in conjunction with other tea leaves.  According to the Chicago Fed: “a recession has historically been associated with a CFNAI-MA3 value below –0.70. Conversely, following a period of economic contraction, an increasing likelihood of an expansion has historically been associated with a CFNAI-MA3 value above –0.70 and a significant likelihood of an expansion has historically been associated with a CFNAI-MA3 value above +0.20.” Bottom line – there is little change in October which means the economy is not strong.

Texas Manufacturing Outlook Survey was flat in November 2024 falling to a -0.9 level after rising to 14.6 last month. The new orders index pushed further negative to -11.9, indicating continued declines in demand. The capacity utilization and shipments indexes slipped back into negative territory, coming in at -4.8 and -5.9, respectively. Not a question in my mind that the manufacturing recession continues.

Here is a summary of headlines we are reading today:

  • Russia’s Uranium Gambit: A Wake-Up Call for U.S. Energy Independence
  • Oil for Troops: Russia’s Barter System with North Korea Exposed
  • Oil Prices Fall On Possible Mid-East Peace Deal
  • UK Slaps Largest Sanctions Package Yet on Russia’s Shadow Tanker Fleet
  • IMF’s Proposed Carbon Restrictions Could Have Major Economic Repercussions
  • U.S. stock and bond markets love Trump’s pick of Bessent for Treasury — here’s why
  • Dow jumps 400 points to new record close, Russell 2000 hits all-time high as investors cheer Trump’s Treasury pick
  • Warren Buffett speaks out against creating family wealth dynasties, gives away another $1.1 billion
  • MicroStrategy acquires 55,500 more bitcoin amid stock volatility: CNBC Crypto World
  • Arabica Futs “Bull Run” Surges To 13-Year High Amid Panic About Brazilian Stockpiles
  • Gold tumbles 3% on reports of Israel-Hezbollah ceasefire, US Treasury pick
  • Long-term Treasury bonds log biggest rally in nearly 4 months after Trump picks Bessent

Click on the “Read More” below to access these, other headlines, and the associated news summaries moving the markets today.

Weather Outlook for the U.S. for Today Through at Least 22 Days and a Six-Day Forecast for the World: posted November 25, 2024

This article focuses on what we are paying attention to in the next 48 to 72 hours. The article also includes weather maps for longer-term U.S. outlooks (up to four weeks) and a six-day World weather outlook which can be very useful for travelers.

First the NWS Short Range Forecast. The afternoon NWS text update can be found here after about 4 p.m. New York time but it is unlikely to have changed very much from the morning update. The images in this article automatically update.

Short Range Forecast Discussion
NWS Weather Prediction Center College Park MD
Mon Nov 25 2024
Valid 12Z Mon Nov 25 2024 – 12Z Wed Nov 27 2024

…Heavy snow over parts of the Sierra Nevada Mountains, Upper Great Lakes
and Central Rockies…

…Below average temperatures in the Northern Plains; above average temps
in the Southern Plains/Lower Mississippi Valley today...

An upper-level trough will swoop into the West Coast from the northeast
Pacific early this week. This trough will direct a very anomalous
subtropical moisture plume along its base at central and southern
California today and Tuesday. A surface low pressure system will help
focus the anomalous moisture over coastal areas as well as the Sierra
Nevada. Parts of the southern Sierra below about 8000 feet may experience
instances of Flash Flooding today. Rock/mud slides and general debris flow
are some of the possible impacts from excessive rainfall in mountainous
areas. Heavy snow is probable at the higher elevations of the southern
Sierra, where 3-4 feet are forecast to accumulate with isolated higher
amounts possible by Wednesday morning. The anomalous moisture feed is also
expected to penetrate into the interior of the West. Parts of the Great
Basin will experience snow showers while heavy snow blankets the
Intermountain West and Colorado Rockies with 1-2′ (isolated 3′) likely
over the next couple of days.

Elsewhere, a pair of low pressure systems moving through the Upper
Midwest/Great Lakes will generate several inches of snow over the Upper
Peninsula of Michigan, while snow showers occur across the greater Upper
Midwest and Lower Great Lakes. Temperatures will remain above average for
one last day from the Southern Plains into the Midwest before a strong
cold front pushes through on Tuesday. Some record high temperatures (in
the mid to upper 80s) might be set over south Texas today. Highs topping
out in the teens and 20s will represent a negative 20-30 degree departure
from normal for parts of the Northern Plains today. Mild conditions
continue over much of the East Coast through Tuesday.

To get your local forecast plus active alerts and warnings click HERE and enter your city, state or zip code.

Learn about wave patterns HERE.

Then, looking at the world and of course, the U.S. shows here also. Today we are looking at precipitation.

Please click on “Read More” below to access the full Daily Report issued today.

Weather Outlook for the U.S. for Today Through at Least 22 Days and a Six-Day Forecast for the World: posted November 24, 2024

This article focuses on what we are paying attention to in the next 48 to 72 hours. The article also includes weather maps for longer-term U.S. outlooks (up to four weeks) and a six-day World weather outlook which can be very useful for travelers.

First the NWS Short Range Forecast. The afternoon NWS text update can be found here after about 4 p.m. New York time but it is unlikely to have changed very much from the morning update. The images in this article automatically update.

Short Range Forecast Discussion
NWS Weather Prediction Center College Park MD
Sun Nov 24 2024
Valid 12Z Sun Nov 24 2024 – 12Z Tue Nov 26 2024

…Heavy Snowfall for parts of the Sierra Nevada…

…Above average temperatures spread from the central U.S. into the East
while cold airmass descends into the Great Plains…

A weak low pressure system will continue directing a plume of moisture at
the West Coast over the next few days. This will likely result in coastal
and low elevation rain, while moderate to heavy snow proliferates across
the coastal ranges of Washington, Oregon and California. The heaviest
snowfall is likely to occur over portions of the Sierra Nevada, with the
southern Sierra poised to accumulate 2-3 feet with isolated higher
amounts. Snow showers will also impact the Colorado Rockies over the next
few days. Heavy rain and snow chances increase on Tuesday as another
atmospheric river event arrives across parts of central California.

Relatively zonal flow across the southern tier of the country will support
another day of above average temperatures for the Central/Southern U.S.
today. An upper trough will pickup steam over the northern tier and send a
strong cold front diving south through the Great Plains over the next 48
hours. Highs in the teens will represent 20-30 degree departures from
normal over the Northern High Plains through Monday. Temperatures will
drop precipitously, from highs in 60s and 70s today to 40s and 50s on
Monday over parts of the Southern Plains as the cold front propagates
through. The associated warm front will spread mild air across the Eastern
U.S. on Monday before the cold front arrives and drops temperatures for
the rest of the week.

To get your local forecast plus active alerts and warnings click HERE and enter your city, state or zip code.

Learn about wave patterns HERE.

Then, looking at the world and of course, the U.S. shows here also. Today we are looking at precipitation.

Please click on “Read More” below to access the full Daily Report issued today.

Weather Outlook for the U.S. for Today Through at Least 22 Days and a Six-Day Forecast for the World: posted November 23, 2024

This article focuses on what we are paying attention to in the next 48 to 72 hours. The article also includes weather maps for longer-term U.S. outlooks (up to four weeks) and a six-day World weather outlook which can be very useful for travelers.

First the NWS Short Range Forecast. The afternoon NWS text update can be found here after about 4 p.m. New York time but it is unlikely to have changed very much from the morning update. The images in this article automatically update.

Short Range Forecast Discussion
NWS Weather Prediction Center College Park MD
Sat Nov 23 2024
Valid 12Z Sat Nov 23 2024 – 12Z Mon Nov 25 2024

…Very strong Atmospheric River to produce heavy snow across the Sierra
Nevada before winding down over north/central California today…

…Above average temperatures expand across the Central U.S. this
weekend…

Moisture associated with a highly impactful and dangerous atmospheric
river event will diminish as it sags south and east through central
California today. Heavy snow is likely over much of the Sierra Nevada this
morning where anywhere between 1-2 feet are expected to accumulate when
all said and done. Upslope portions of the Sierra below 7000 feet may
experience isolated instances of flash flooding this morning before snow
levels drop on the backside of the cold front pushing through the West
this afternoon. Snow showers spread into Northern/Central Rockies this
afternoon and the Intermountain West on Sunday. Snowfall totals of 6-12
inches are probable for the aforementioned areas by the end of the weekend.

Surface high pressure extending from central Canada down to the Gulf Coast
will support below average temperatures for those regions through tonight.
Parts of the Southeast will experience low temperatures in the mid to
upper 30s which may lead to some frost/freezes. A deepening upper trough
over the north-central U.S.and Ridge over Mexico will promote above
average temperatures across the Great Plains today and Sunday before
expanding into the East by Monday. Elsewhere, mixed precipitation can be
expected to continue across portions of upstate New York and New England
today.

To get your local forecast plus active alerts and warnings click HERE and enter your city, state or zip code.

Learn about wave patterns HERE.

Then, looking at the world and of course, the U.S. shows here also. Today we are looking at precipitation.

Please click on “Read More” below to access the full Daily Report issued today.

22 NOV 2024 Market Close & Major Financial Headlines: Wall Street’s Three Main Indexes Open Mixed Small Caps Finally Closing Fractionally Higher, While The Dow Closes Moderately Higher

Summary Of the Markets Today:

  • The Dow closed up 426 points or 0.97%,
  • Nasdaq closed up 31 points or 0.16%,
  • S&P 500 closed up 21 points or 0.35%,
  • Gold $2,708 up $33.10 or 1.23%,
  • WTI crude oil settled at $71 up $1.05 or 1.50%,
  • 10-year U.S. Treasury 4.416 down 0.016 points or 0.361%,
  • USD index $107.53 up $0.56 or 0.52%,
  • Bitcoin $99,411 up $1,402 or 1.41%, (24 Hours), (New Bitcoin Historic high 99,789)
  • Baker Hughes Rig Count: U.S. -1 to 583 Canada +1 to 201
    U.S. Rig Count is down 1 from last week to 583 with oil rigs up 1 to 479, gas rigs down 2 to 99 and miscellaneous rigs unchanged at 5.

*Stock data, cryptocurrency, and commodity prices at the market closing

Today’s Highlights

The U.S. stock markets closed near its session highs on Friday, with the major indices showing positive momentum. The major indices closed the week with gains exceeding 1%, despite a sluggish start following the post-election rally. Market participants re-calibrated after Nvidia’s earnings, which raised questions about AI’s continued impact on stock prices. For the week, Tesla shares rose almost 4%, while Nvidia experienced a more than 3% dip. Wall Street continues to anticipate President-elect Donald Trump’s cabinet selections, particularly the Treasury secretary position, which could significantly impact market dynamics. Bitcoin maintained its upward trajectory, approaching the $100,000 milestone. The cryptocurrency briefly surpassed $99,500 early Friday, buoyed by expectations of favorable crypto regulations under the incoming Trump administration. Finally, the market awaits a shortened trading week due to Thanksgiving with oil prices increasing amid escalating tensions in the Russia-Ukraine war.


Click here to read our current Economic Forecast – November 2024 Economic Forecast: Our Index Marginally Declines – We Are Stuck With The Crappy Economy We Have Seen So Far This Year


Today’s Economic Releases Compiled by Steven Hansen, Publisher:

No releases today

Here is a summary of headlines we are reading today:

  • Iran Escalates Nuclear Tensions with Advanced Centrifuge Installation
  • U.S. Drilling Activity Slips Further As Market Volatility Remains
  • Texas Pacific Land Replaces Marathon Oil in S&P 500 After ConocoPhillips Deal
  • Geopolitical Risk and Supply Outages Underpin Oil Prices
  • Is the Russia-Ukraine War Really Escalating?
  • ‘I have no money’: Thousands of Americans see their savings vanish in Synapse fintech crisis
  • Dow rises more than 400 points for record close, Wall Street posts weekly gain: Live updates
  • The case for altcoins and memes as bitcoin, now approaching $100,000, faces a potential correction
  • Bitcoin tests $100,000 heading into the weekend: CNBC Crypto World
  • Egg Prices Surge Again As Grocers Face Shortages Amid Bird Flu Outbreak
  • 2-year Treasury yield has 8th straight week of gains on improved U.S. outlook
  • U.S. oil prices score a more than 6% weekly gain on supply risks tied to the Russia-Ukraine war

Click on the “Read More” below to access these, other headlines, and the associated news summaries moving the markets today.

NOAA Updates its Seasonal Outlook on November 21, 2024 – Still based on a weak La Nina starting very soon – Posted on November 22, 2024

On the third Thursday of the month right on schedule NOAA issued their updated Seasonal Outlook which I describe as their Four-Season Outlook because it extends a bit more than one year into the future. The information released also included the Mid-Month Outlook for the following month plus the weather and drought outlook for the next three months.  I present the information issued by NOAA and try to add context to it. It is quite a challenge for NOAA to address the subsequent month, the subsequent three-month period as well as the twelve successive three-month periods for a year or a bit more.

With respect to the long-term part of the Outlook which I call the Four-Season Outlook, the timing of the transition from Neutral to LaNina has been challenging to predict.  We are still in ENSO Neutral. La Nina is the likely scenario soon, but the strength of the La Nina may be fairly weak.

From the NOAA discussion:

“Taken collectively, statistical and dynamical model forecast guidance of the Niño3.4 index favor the development of a weak and most likely short duration La Niña event. Some statistical model forecasts do favor a continuation of ENSO-neutral into and through winter 2024-2025. Dynamical model guidance predictions tend to support weak La Niña conditions to develop, including the majority of participant models from the NMME and C3S forecast suites. Most recent observations and the forecast guidance noted above favor La Niña to emerge during OND 2024 (57% chance) and it is expected to persist through JFM 2025. After JFM 2025, ENSO-neutral is the most likely category into the northern hemisphere summer of 2025.”

“Based on a weak La Nina and models overdoing trends, observed trends become more of the signal. Furthermore, higher frequency patterns (AO, MJO, and stratospheric variability) that result in increased uncertainty can also play a larger role. Those modes are largely not predictable on seasonal timescales,”

I personally would not have total confidence in this outlook given the uncertainty about there actually being a La Nina and its strength if it does happen.  I forecasted the JAMSTEC three-season forecast last Saturday LINK. I do not have a lot of confidence that NOAA knows how to deal with a La Nina Modoki. The number of El Nino and La Nina events since 1950 is a fairly small number. When you further segment them by strength you end up with a very small number of events in each category (El Nino v La Nina and three or four categories of strength within each of perhaps 8  to 10 subcategories. This makes both statistical methods and dynamical models have a large error range.  We are pretty confident now that we will have either a weak La Nina or Neutral with a La Nina bias meaning it will be in the Neutral Range but closer to a La Nina than an El Nino. This suggests that there is value in this forecast. The maps show the level of confidence that NOAA (really the NOAA Climate Prediction Center) has for the outlook shown when they show a part of the U.S. or Alaska differing from normal.

Let’s Take a Look at the (mid-month) Outlook for December.

It will be updated on the last day of November.

Then we look at a graphic that shows both the next month and the next three months.

The top row is what is now called the Mid-Month Outlook for next month which will be updated at the end of this month. There is a temperature map and a precipitation map. The second row is a three-month outlook that includes next month.  I think the outlook maps are self-explanatory. What is important to remember is that they show deviations from the current definition of normal which is the period 1991 through 2020.  So this is not a forecast of the absolute value of temperature or precipitation but the change from what is defined as normal or to use the technical term “climatology”.

Notice that the Outlook for next month and the three-month Outlook are fairly similar except in two places.  This tells us that January and February will be substantially the same as December for most of CONUS and Alaska. Part of the explanation for this is that NOAA expects La Nina to impact all three months.

The full NOAA Seasonal Outlook extends through December/January/February of 2026 (yes that is more than a year out). All of these maps are in the body of the article. Large maps are provided for December and the three-month period December/January/February  Small maps are provided beyond that through December/January/February of 2026 with a link to get larger versions of these maps. NOAA provides a discussion to support the maps. It is included in the body of this article.

In some cases, one will need to click on “read more” to read the full article. For those on my email list where I have sent the url of the article, that will not be necessary.