Some Information on Lake Effect Snow – Published December 28, 2024


 This graphic explains it all. Until lakes freeze, they serve as cloud generators when cold air blows across them. Those clouds tend to rise due to the heat content from the lake’s evaporation and cool, precipitating rapidly, producing a lot of snow along the edge of the lake on the opposite side from where the cold air originated. Global Warming may increase the impact of Lake-Effect Snow.

Some will have to click on “Read More”  to read the rest of this article.

Seasonal Peak Snow Predictability Derived from Early-Season Snow in North America – Published on December 21, 2024.

This is an article about the ability to predict peak snow and snow water content (SWE) accumulation early in the season. This can be helpful to water planners. I came across this in a webinar that had four excellent presentations and one was related to this article.  Here is the link to the recording of that presentation. You may want to watch and listen to the recording of that webinar. The overall conclusion is that predictability from early-season snowfall is greatest where it is coldest which usually means high latitudes. That is not surprising but some may find the methodology of quantifying the degree of predictability to be interesting. A lot of detail is provided for the U.S. West but Figure 2 shows it is true across North America.

Abstract

SNOwpack TELemetry observations and model simulations both demonstrate that the fractional contribution of October through December (early season) snowfall to peak snow accumulation in North America increases with latitude due to both colder temperatures and Pacific storm tracks focusing further north earlier in the season. Early season snowfall also makes up greater than 60 percent of peak accumulation in interior low-precipitation locations leeward of mountains, particularly those that are subject to strong, warm winds and midwinter snow loss. Early season snow observations show promise in predicting peak snow water equivalent in locations where large-scale ocean-atmosphere patterns similarly influence fall and winter conditions, and in northern maritime locations where winter temperatures are warm enough that rain on snow and midwinter melt occur. Because climate change is likely to increase the extent of midwinter melt, the latter relationship is expected to become important over more locations in the future.

Key Points

  • Fall snow contributes more to peak snow at colder and more northerly locations
  • Fall snow can be used to predict peak snow where large scale ocean and atmosphere patterns influence annual snowfall variations
  • Fall snow regulates cold content, which in warm regions may tip a snowpack between lasting or ablating midwinter, influencing peak snow

Plain Language Summary

Across North America, snow accumulates from October until the following spring. Early season snow, defined as the snow that accumulates by the end of December, is a greater fraction of total snow accumulation at higher latitudes and at colder locations. Early season snow accumulation can be used to predict peak snow accumulation. Predictions are more skillful at locations where fall precipitation is correlated with winter precipitation because more snow at the end of December indicates that weather patterns are favorable for greater than average snowfall to continue. Predictions also have skill at warmer northern locations where more snow on the ground early season increases the likelihood that mixed rain-snow events add water to the snowpack rather than melting the snow. Predictions at warm southern locations do not have skill because winter and spring snowfall is highly variable, and frequently little to no snow has accumulated by the end of December.

Some may need to click  on “Read  Here”  to access the rest of this article.

Ecological Drought – Another Dimension to Drought – Posted on October 19, 2024


Drought has traditionally been viewed in terms of its agricultural, hydrological, and socioeconomic impacts. However, this does not fully address the impacts to ecosystems, and the critical services they provide to humans. In 2017, an Ecological Drought Framework was developed by the U.S. Geological Survey in conjunction with the Nature Conservancy and the Wildlife Conservation Society that intentionally considers the interconnectedness of nature and humans. The objective of this framework is to identify drought policy and natural resource management strategies that are mutually beneficial.

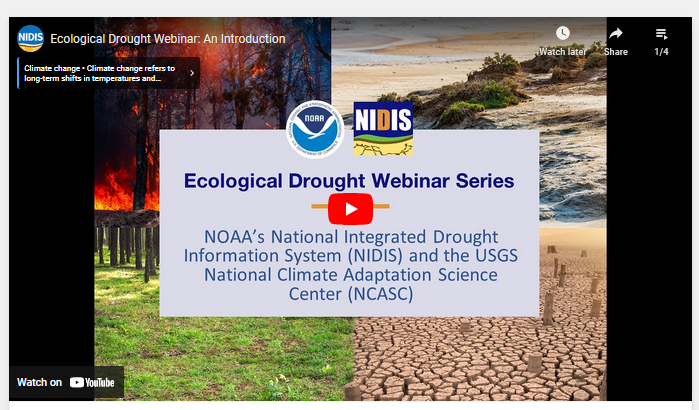
The National Integrated Drought Information Center (NIDIS) and the U.S. Geological Survey National Climate Adaptation Science Center (NCASC) co-organized a series of four webinars in early 2021 to raise awareness of ecological drought and share new research and practical actions to strengthen ecosystem resilience to drought. These webinars introduced the ecological drought concept, and explored how to incorporate ecological drought in planning for ecosystem resilience, wildfire management, and vibrant coastal ecosystems. The series included speakers from the research community, tribal nations, and government agencies.

Remember this is the 2021 Webinar Series. If you want to watch it, click HERE. This will present the above graphic but it will be alive so you can then click on the start arrow. You may have to wait a few seconds and “skip” a commercial to get to the actual presentation.

However, the focus of this article is not the 2021 Webinar Series but the current Webinar Series on ecological drought. It is more than three years later so there has been progress in understanding the causes of and how to deal with ecological drought. There are many different kinds of drought and THIS is a pretty good explanation of the different types. Until recently the different types of drought related almost totally to the direct impact on people. The impact on ecology was almost totally ignored.  The webinar series in 2021 was one of the first attempts to consider how drought impacts ecology.  The 2024-2025 series of webinars is an attempt to better understand the impact of drought on ecology and the impact of ecology on drought.

Please click on “Read Here”  to access the body of this article.

Declining Reservoir Reliability and Increasing Reservoir Vulnerability: Long-Term Observations Reveal Longer and More Severe Periods of Low Reservoir Storage for Major United States Reservoirs – Published on September 8, 2024

I am republishing this  Open Access article as I think this will be new information for EconCurrents.com readers. I have published related articles recently which can be accessed  HERE and HERE.

I have provided the below article in full but HERE is the link.  I have highlighted some statements and my comments are either  surrounded by  brackets []  or in  a text box

Citation: Simeone, C. E., Hammond, J. C., Archfield, S. A., Broman, D., Condon, L. E., Eldardiry, H., Olson, C. G., & Steyaert, J. C. (2024). Declining Reservoir Reliability and Increasing Reservoir Vulnerability: Long-Term Observations Reveal Longer and More Severe Periods of Low Reservoir Storage for Major United States Reservoirs. Geophysical Research Letters, 51(16), e2024GL109476. https://doi.org/10.1029/2024GL109476

Abstract

Hydrological drought is a pervasive and reoccurring challenge in managing water resources. Reservoirs are critical for lessening the impacts of drought on water available for many uses. We use a novel and generalized approach to identify periods of unusually low reservoir storage—via comparisons to operational rule curves and historical patterns—to investigate how droughts affect storage in 250 reservoirs across the conterminous U.S. (CONUS). We find that the maximum amount of water stored in reservoirs is decreasing, and that periods of unusually low storage are becoming longer, more severe, and more variable in (a) western and central CONUS reservoirs, and (b) reservoirs with primarily over-year storage. Results suggest that reservoir storage has become less reliable and more vulnerable to larger deviations from desired storage patterns. These changes have coincided with ongoing shifts to the hydroclimate of CONUS, and with sedimentation further reducing available reservoir storage. [Editor’s Note: Drought is natural.  It is an error to asume that a period of drought is due to a changing hydroclimate. It may be or may not be. It just as well be the combination of the phases of the Ocean Cycles. To the extent that  drought is caused by warmer temperatures we have a a better basis for attributing it to Global Warming. Same goes  for increased evaporation from reservoirs.]

Key Points

  • Low-storage periods are longer, more severe, and more variable in over-year storage reservoirs and in the western and central CONUS
  • Longer periods of low storage for some regions in recent years suggests decreased reservoir reliability in a changing hydroclimate
  • Maximum annual storage is also declining across CONUS, furthered by storage losses from sedimentation

Plain Language Summary

Drought in water systems is a major challenge in managing water resources. Reservoirs are important as they can lessen the impacts of drought on water availability for many users. However, they are impacted by drought as well. We use a novel and generally applicable method to identify when reservoir storage is unusually low, potentially from drought, at 250 reservoirs across the conterminous U.S. We find that the maximum amount of water stored in reservoirs is decreasing across the U.S. We also find that periods of unusually low storage are becoming longer and more severe in western and central U.S. regions as well as for certain types of reservoirs. This suggests that reservoir storage may be less reliable and more vulnerable to extreme conditions and may be further impacted by changing climate and hydrology across the U.S. and by sediment building up behind reservoirs.

Some may need to click on “Read  More” to read the rest of the article.

Recent Upper Colorado River Streamflow Declines Driven by Loss of Spring Precipitation – Published September 7, 2024

I am just republishing this  Open Access article as I think this will be new information for EconCurrents.com readers.  I am a bit surprised that the reduction of spring precipitation plays such a large role.

Citation: Hogan, D., & Lundquist, J. D. (2024). Recent Upper Colorado River Streamflow Declines Driven by Loss of Spring Precipitation. Geophysical Research Letters, 51(16), e2024GL109826. https://doi.org/10.1029/2024GL109826

Abstract

Colorado River streamflow has decreased 19% since 2000. Spring (March-April-May) weather strongly influences Upper Colorado River streamflow because it controls not only water input but also when snow melts and how much energy is available for evaporation when soils are wettest. Since 2000, spring precipitation decreased by 14% on average across 26 unregulated headwater basins, but this decrease did not fully account for the reduced streamflow. In drier springs, increases in energy from reduced cloud cover, and lowered surface albedo from earlier snow disappearance, coincided with potential evapotranspiration (PET) increases of up to 10%. Combining spring precipitation decreases with PET increases accounted for 67% of the variance in post-2000 streamflow deficits. Streamflow deficits were most substantial in lower elevation basins (<2,950 m), where snowmelt occurred earliest, and precipitation declines were largest. Refining seasonal spring precipitation forecasts is imperative for future water availability predictions in this snow-dominated water resource region.

Key Points

  • Significant decreases in spring precipitation have been observed since 2000 in headwater basins of the Upper Colorado
  • Drier springs have corresponded with greater spring potential evapotranspiration (PET)
  • Spring precipitation decreases and PET increases explain much of the variability in observed streamflow deficits in these headwater basins

Plain Language Summary

With over 40 million people dependent on the Colorado River, the 19% drop in streamflow since 2000 has been worrying, especially because its cause is not well understood. To explain this drop, we focused on changes to spring weather in snow-dominated basins, which contribute over 80% of the river’s water. We found spring precipitation decreases since 2000 not only reduced streamflow but also correlated with higher temperatures and evaporation rates and less cloudiness. These impacts combined to intensify streamflow declines in basins with earlier snowmelt. The importance of spring precipitation to Colorado River streamflow underscores the need to improve seasonal precipitation forecasts. Such improvements would enhance water availability predictions for the one billion people worldwide reliant on snow for water resources.

Some will have to click on “Read More” to access the full article.

The Impact of Climate Change on Work – Published on Labor Day September 2, 2024

I  am not able to comment inside of the posted pages since they are images but here is a short summary of the key points.

  • Reductions in the  Demand for Labor
  • Reductions in the Demand for Labor due to Weather  Extremes.
  • Worker Absentism.
  • Declines in Productivity (heat is a major factor)
  • Impact on the self-employed.
  • Reallocation of Labor

It is a thorough report on the possible impacts but a bit short on data as to what the impacts have been but there is quite a bit of data in the report it is just not complete. It is a very interesting report to read on  Labor Day.

Some will have to click on “read more” to access the full article.

Impact of Drought on Hydro Power – Posted on August 24, 2024

A recent study found drought in the United States has led to approximately 300 million MWh in lost hydropower and $28 billion in lost revenue between 2003 and 2020.

Unraveling the hydropower vulnerability to drought in the United States

Pouya Moghaddasi
et al 2024
Environ. Res. Lett. 19 084038 DOI 10.1088/1748-9326/ad6200

Pouya Moghaddasi1,2,* , Keyhan Gavahi1,2, Hamed Moftakhari1,2 and Hamid Moradkhani1,2,*

Published 23 July 2024 © 2024 The Author(s). Published by IOP Publishing Ltd
Environmental Research Letters, Volume 19, Number 8 Citation Pouya Moghaddasi et al 2024 Environ. Res. Lett. 19 084038 DOI 10.1088/1748-9326/ad6200

This article is OPEN ACCESS  so  I have reproduced it here in its entirety.  It is very well written so  I have not seen the need to add comments to the article but  I might highlight certain sentences.  I will provide one caution which is that the period studied is a period that was characterized by a lot of drought so it may not be fully representative of the future.

Abstract

Drought, a potent natural climatic phenomenon, significantly challenges hydropower systems, bearing adverse consequences for economies, societies, and the environment. This study delves into the profound impact of drought on hydropower generation (HG) in the United States, revealing a robust correlation between hydrologic drought and hydroelectricity generation. Our analysis of the period from 2003 to 2020 for the Contiguous United States (CONUS) indicates that drought events led to a considerable decline in hydroelectricity generation, amounting to approximately 300 million MWh, and resulting in an estimated loss of $28 billion to the sector. Moreover, our findings highlight the adverse environmental effect of drought-induced HG reductions, which are often compensated by increased reliance on natural gas usage, which led to substantial emissions of carbon dioxide (CO2), sulfur dioxide (SO2), and nitrogen oxide (NOX), totaling 161 700 kilotons, 1199 tons, and 181 977 tons, respectively. In addition to these findings, we assess the state-level vulnerability of hydropower to drought, identifying Washington and California as the most vulnerable states, while Nevada exhibits the least vulnerability. Overall, this study enhances understanding of the multifaceted effects of drought on hydropower, which can assist in informing policies and practices related to drought management and energy production.

Some may need to click on “read more”  to access the full article.

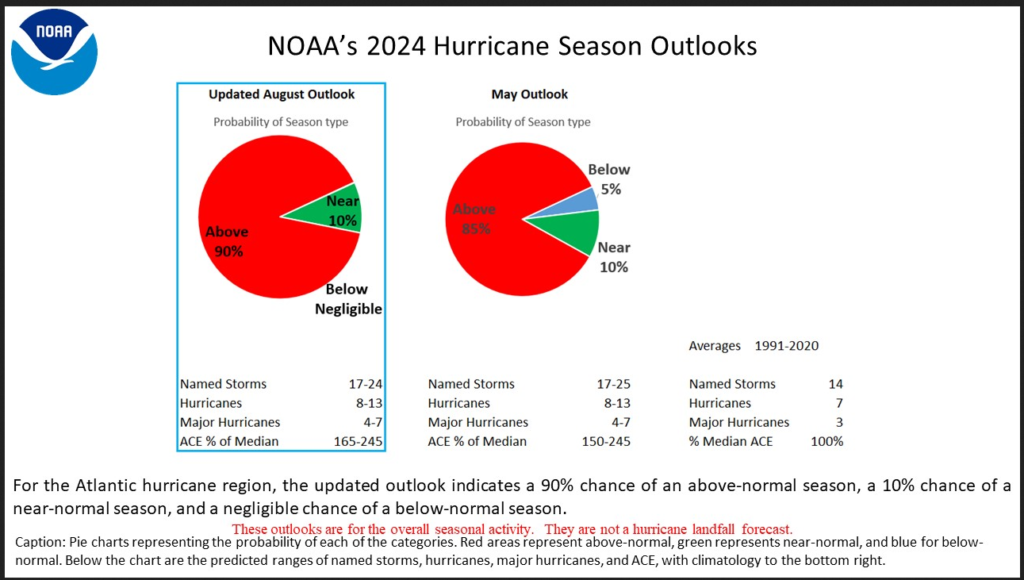
NOAA 2024 Atlantic Hurricane Season Outlook Issued on August 8, 2024 and Posted on August 10, 2024

 This is an update from the original Outlook issued in May.

The links lead to graphics that are very technical and IMO not too helpful but the links are HERE,  and HERE (and this pertains to the Eastern Pacific).

This is a good summary of the current Outlook compared to what was issued in May.

The above I believe just covers the Atlantic and is not much changed. They do not define the term ACE which is defined on the Colorado State Website as: “ACE is calculated by summing the square of the maximum sustained winds of each tropical cyclone (in knots) every six hours when the system is classified as either tropical or sub-tropical. The resulting value is then divided by 10,000. Details of the calculation are available on Wikipedia’s website:”  It is generally accepted that the impact of wind increases with the square of the wind speed so this measure is to some extent logical. Notice how this year is expected to compare to the 1991-2020 average which is considered climatology.

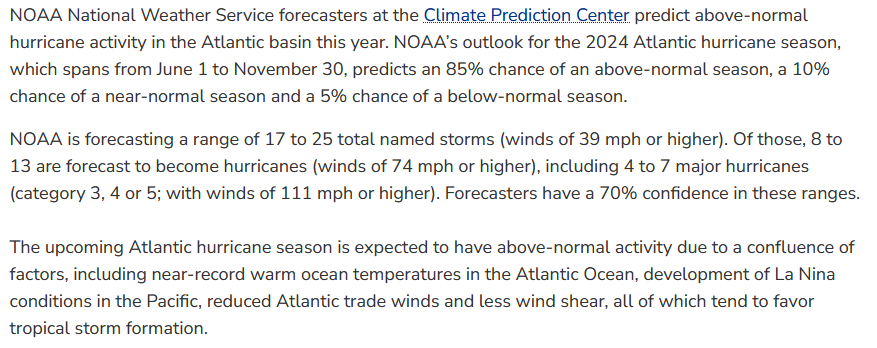
I will now present to full NOAA Press Release. Any comments by me will be in a box or I will simply highlight in bold type what I consider to be important or insert my thoughts within brackets [ ].

Some may need to click on “Read More” to access the full article.
2024 Hurricane Season Official Forecast – Posted May 25, 2024

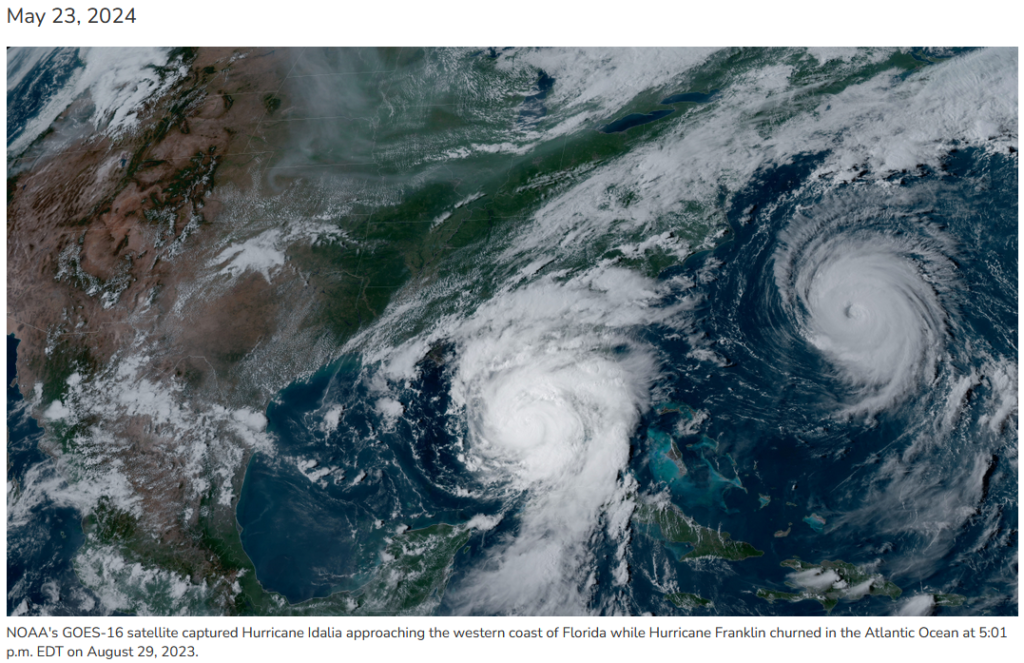
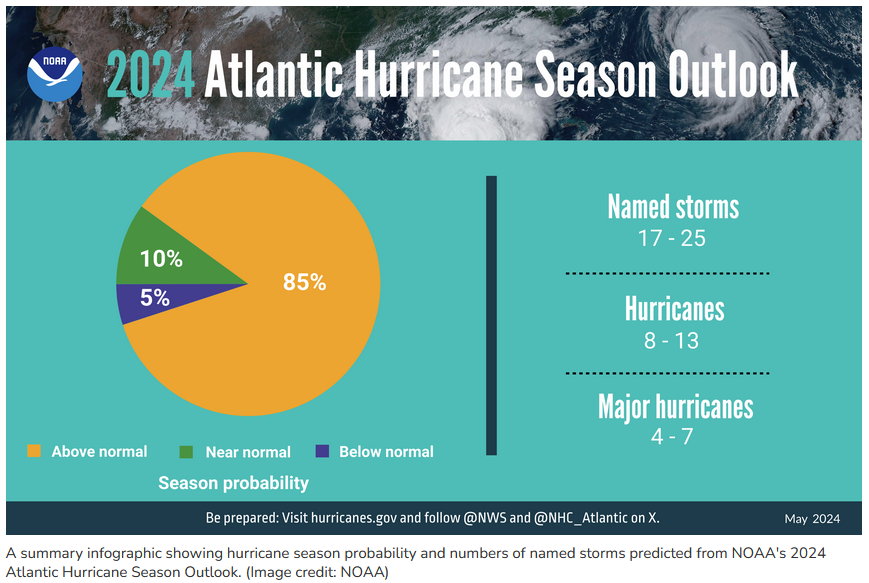
In this article, I present NOAA articles about the Atlantic Hurricane Season. One is the Outlook for this season and the other is a review of the 2023 Hurricane Season with an informative YouTube. I interweave these two a bit and hope that I do not confuse the reader. Then I provide some additional information on Atlantic Hurricanes and how they are influenced by the Atlantic Multidecadal Oscillation (AMO), the Bermuda High, and the phase of ENSO.


Some may have to click on “Read More” to access the remainder of this article.