On the second Thursday of every month, NOAA issues its analysis of the status of ENSO. This includes determining the Alert System Status. Although the current status remains the same i.e. La Nina Advisory, the forecast has been adjusted somewhat from last month. The forecast calls for the La Nina to continue to fade. The timing is shown in the NOAA discussion and the IRI probability analysis. The Australian Meteorological Service thinks this will happen sooner and I agree. I present some information that suggests that NOAA has the timing wrong and that the transition to ENSO Neutral will occur fairly soon.
The impact of the NOAA forecast for the transition from La Nina to ENSO Neutral will show up next Thursday when NOAA issues its Seasonal Outlook. The NOAA ENSO Status Update provides an advance indication of how the forecast might change. To repeat, I expect the demise of La Nina to occur somewhat sooner than predicted by NOAA. It is not a significant difference. There is a lag between the ENSO state and the impact on U.S. weather. Thus the exact date when a fading La Nina meets the criteria for ENSO Neutral may not be very important in terms of the actual impact on Spring and Summer weather including the North American Monsoon (NAM). We will learn what NOAA thinks next Thursday.
CLIMATE PREDICTION CENTER ENSO DISCUSSION
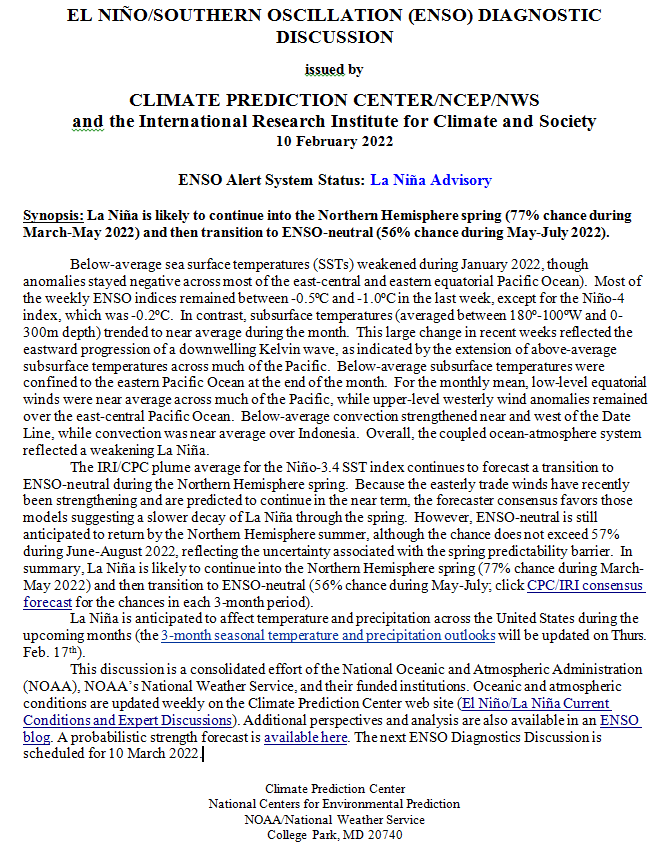
The key message is that we remain in La Nina. But it has weakened but it is not exactly clear when it will end. It is not likely to end during March through May – It has a fair chance to transition to ENSO Neutral during the three-month period May through July. More on that later.
IRI CPC ENSO STATE Probability Distribution (IRI stands for the International Research Institute for Climate and Society
Here are the new forecast probabilities. This information is released twice a month and the first release is based on a survey of Meteorologists. The probabilities are for three-month periods e.g. JFM stands for January/February/March.
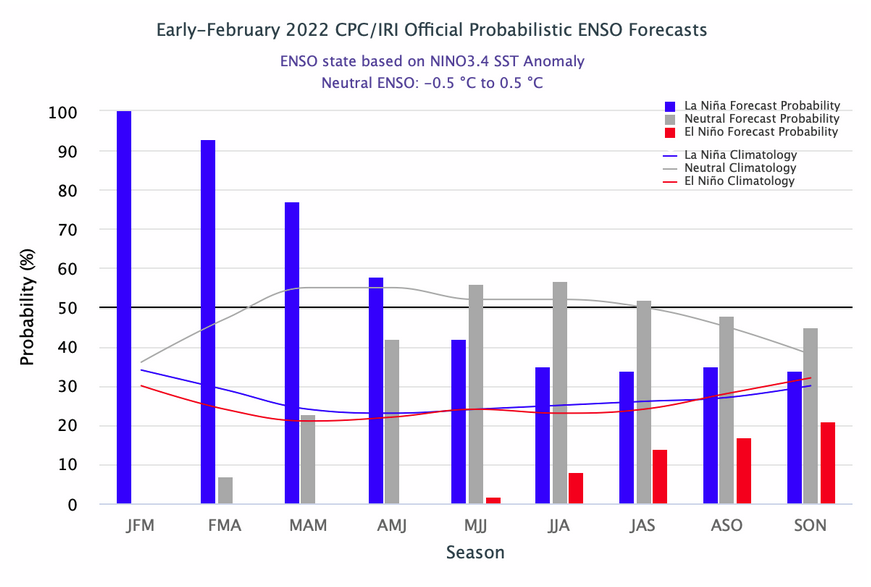
Early February ENSO Probabilities
Sometimes it is useful to compare this to the forecast from the prior month. I do not have that handy but I do have the forecast from the second half of January. That forecast is based on the computer model results from around the world. Thus there is a certain amount of comparing apples to oranges – But I think it is still very useful to compare the two forecasts.
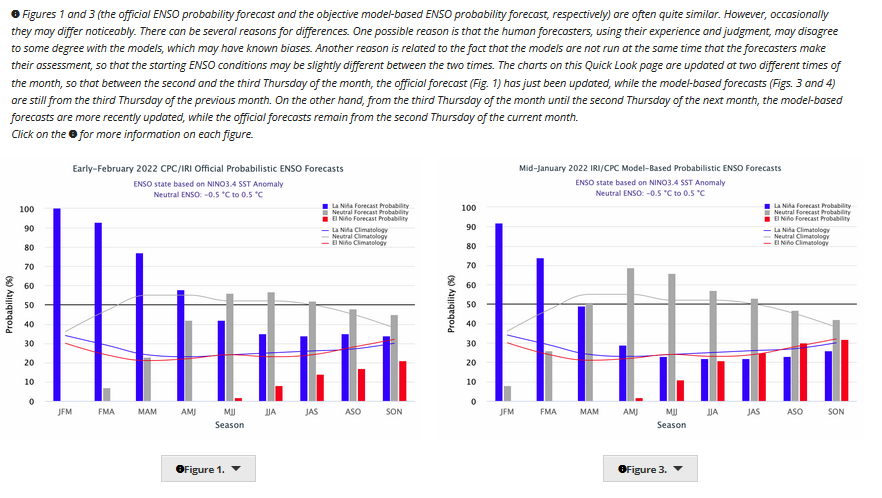
Although this looks like a change from the prior forecast it is not a change from the previous early January forecast (not shown). The text above the two probably forecasts attempts to explain this. I found it confusing.
What Does the NOAA Proprietary ENSO Model Forecast?

I am not sure but the above may auto-update. I tried to set it up that way, we will see. This model shows La Nina continuing indefinitely and IRI does not agree with what this model says.
I like to compare forecasts from other meteorological agencies and I do not yet have the forecast from JAMSTEC but I do from the Australian Meteorological Agency BOM
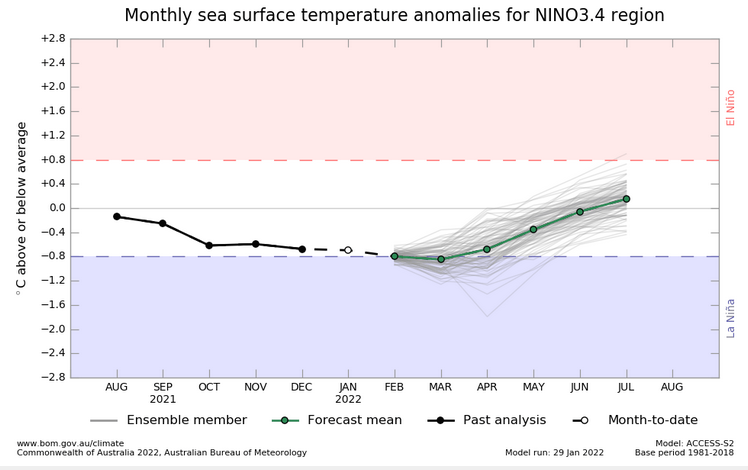
The BOM has a different threshold for what constitutes a La Nina so they are showing it ceasing to be a La Nina in April. But even if you use the NOAA criteria the BOM forecast would end the La Nina before May so it is a difference of perhaps a week. The BOM criteria probably reflect what values of the Nino 3.4 Index that cause La Nina conditions in Australia.
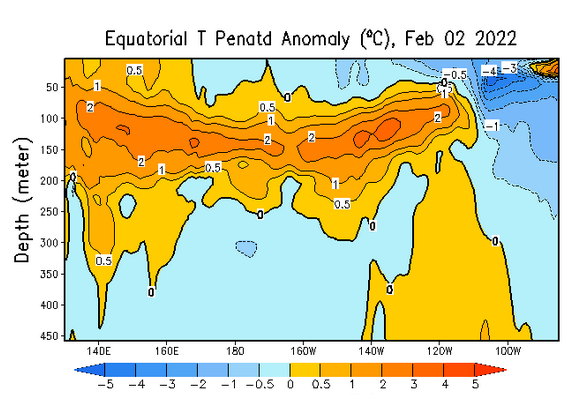
Sea Surface Temperature Anomalies
Here is the latest.
And the prior.
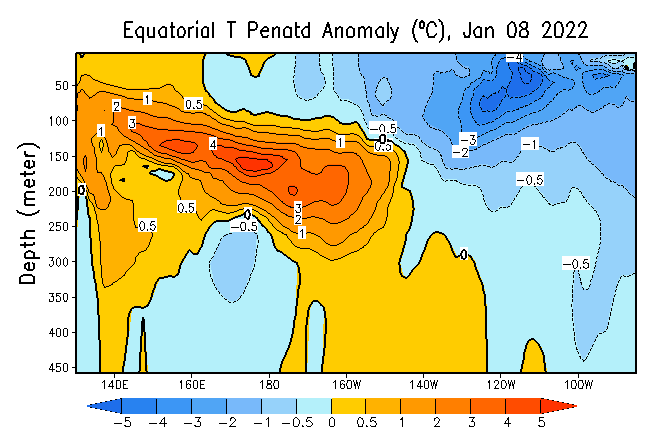
So there has been a lot of progress in moving warmer water under the cool water and replacing it which explains the reduction of the intensity of the La Nina. This suggests that the IRI probabilities might be incorrect and the La Nina may be gone sooner rather than later. The analysis updates every five days but the graphics in this article are frozen. However, an updated version of this graphic can be found at https://www.cpc.ncep.noaa.gov/products/analysis_monitoring/ocean/weeklyenso_clim_81-10/wkteq_xz.gif. It comes with an upper graphic like shown above which is the temperature anomalies. It also has a lower graphic which is the actual water temperatures. Both are useful.
Additional Information
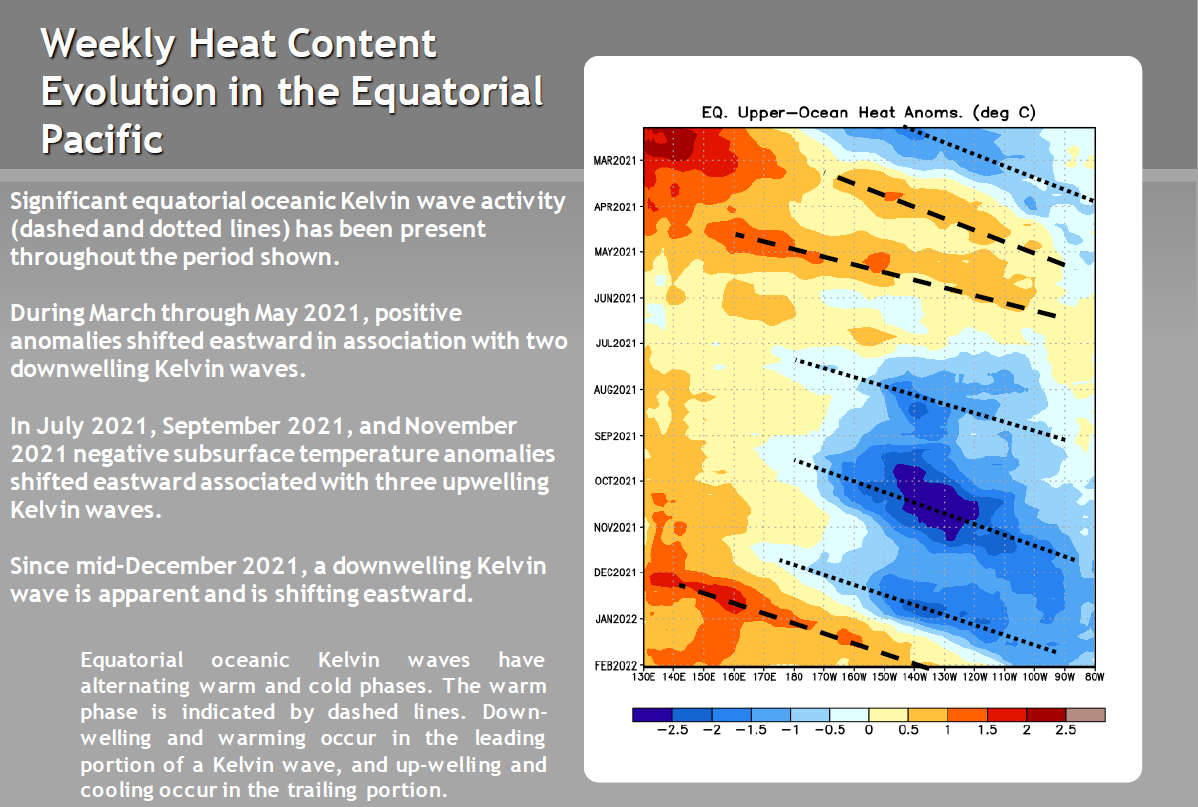
Impact of Kelvin Wave
OMG, I have not been paying attention to Kelvin waves. A Kelvin wave started in December and has been moving warm water from the IndoPacific Warm Pool east. It is playing out but is a mechanism for ending a La Nina or even starting an El Nino. With the transition from econintersect.com to econcurrents.com, I had lost the URL to obtain this graphic so I apologize for that. But the Kelvin Wave explains a lot. It certainly has sped up the demise of this La Nina. But the impact of the Kelvin Wave is dissipating. This makes the forecasting of the completion of the demise of this La Nina additionally complicated.
What is a Kelvin Wave?
I am not going to provide a full explanation in this article as it would be a distraction. Let’s just say that a La Nina skims off warm water at the surface and moves that warmer water to the west which adds it to the Indo-Pacific Warm Pool. The IPWP slowly expands to the east and certain events trigger some of that water to move farther east. That warmer water nudges a La Nina towards ENSO Neutral or nudges ENSO Neutral towards El Nino. The warm water is close to the surface and the leading edge of this is called the downwelling phase. That is then followed by an upwelling phase sometimes called the trailing edge. NOAA makes it easy for us by adding dashed lines and dotted lines to the graphic. The explanation is also to the left of the graphic that shows the history of these waves.
I do not know if this is the best explanation as it is very technical but I am providing it for those interested. One can always do a search on any term that is in my articles to obtain more information. Here is a good highly technical reference https://www.sciencedirect.com/topics/earth-and-planetary-sciences/kelvin-wave. Remember this is an Equatorial Oceanic Kelvin Wave. There are other kinds of Kelvin Waves.
Has this Equatorial Oceanic Kelvin Wave eliminated the La Nina?
The answer is no but that it has contributed to the weakening of the current La Nina.
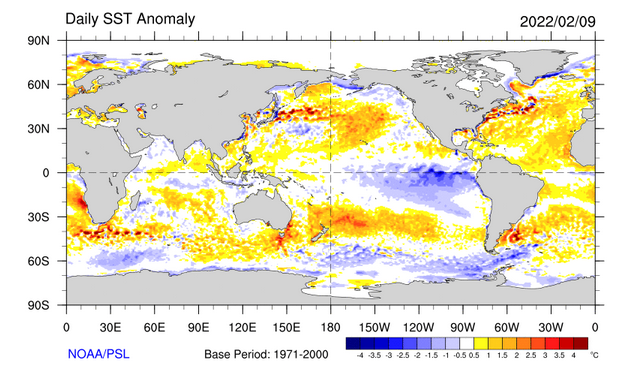
Looking at the surface you can still see the La Nina. But notice how the bulk of it is south of the Equator. We are mostly interested in the area that extends from 170W to 120W and is within 5 degrees from the Equator north and south. And the amount of and the intensity of the blue within that area is not that intense as the impression one gets from looking at the entire blue blob.
Another way of looking at it is the impact on the atmosphere. Here we show the near-surface temperatures.
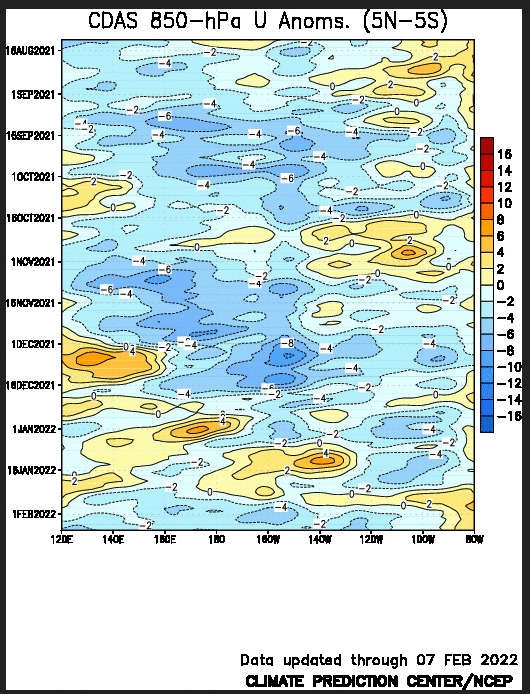
This type of diagram is called a Hovmöller diagram. It is sort of like a tape that records the information and adds the current information so that the bottom of the diagram is the most recent information and the earlier information is shown above it. So you can see the warm event back in December and how it moved to the east. There is really no sign of it now in the atmosphere. I assume that it was an MJO event. This type of diagram allows one to see what occurred over a period of time.
Other Useful Information
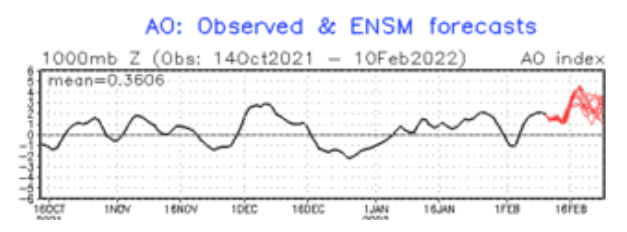
This is a short-term forecast for the Arctic Oscillation and it is showing a forecast for a very positive AO which suggests that cold air will be contained north of the U.S. for the next week or two.
What are the Typical Winter Impacts of La Nina
I was not sure if I should include these two graphics as we are coming to the end of winter. I do not have similar graphics for the other three seasons. They may exist. In general, ENSO is less important in Fall and Spring than in Winter since the winter pattern is dominated by the Jet Stream. ENSO has similar impacts on Fall and Spring but not as extreme. The impact on Summer is very different. In general, it impacts the Southern Tier and the East Coast more than the rest of the Northern Tier. This is because ENSO has a big impact on the Tropical Patterns in Summer. I will see if I can expand the discussion next month especially in terms of Spring.
I am sure that NOAA will take the changing impact of La Nina into account in their Seasonal Outlook that will be issued next Thursday. Their statistical approach to forecasts beyond a month to six weeks is a very good way of doing this. They are good at it.
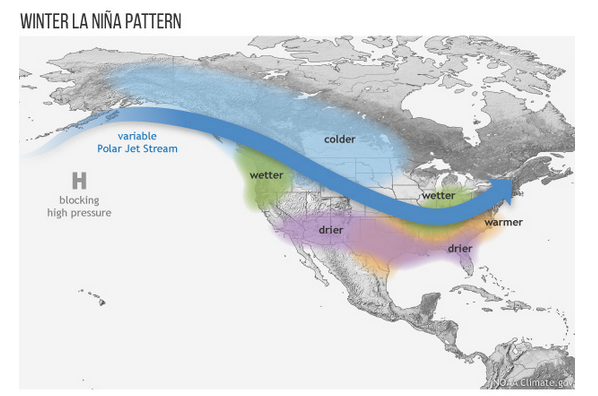
Above is what we have now or at least it is typically what we would get with a La Nina. That does not mean that winter weather follows this pattern every single day. It just means that this is the typical pattern with a typical La Nina.
This compares to the below image.
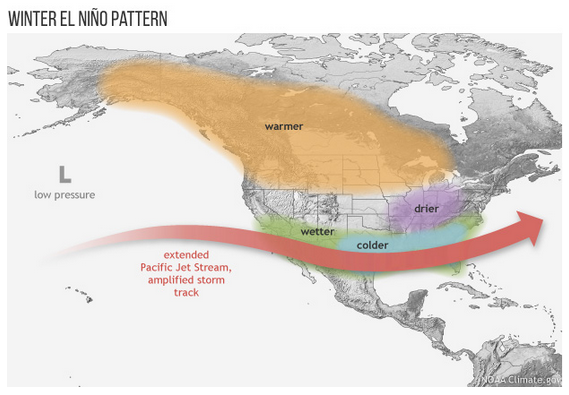
The pattern is very different. One major difference is the location of the Jet Stream. For El Nino it is much farther south. This generally means that more of CONUS is cooler and storms from the Pacific tend to enter CONUS from the west but farther south. With La Nina which is our current pattern, the Jet Stream is farther north but it has more of a wavy pattern. Thus tracking the low-pressure systems as they cross CONUS may be more challenging. There can be more cold air intrusions perhaps.
ENSO is not the only factor that impacts our weather and no two El Ninos or La Ninas are identical. But it is a major factor so we pay a lot of attention to it.