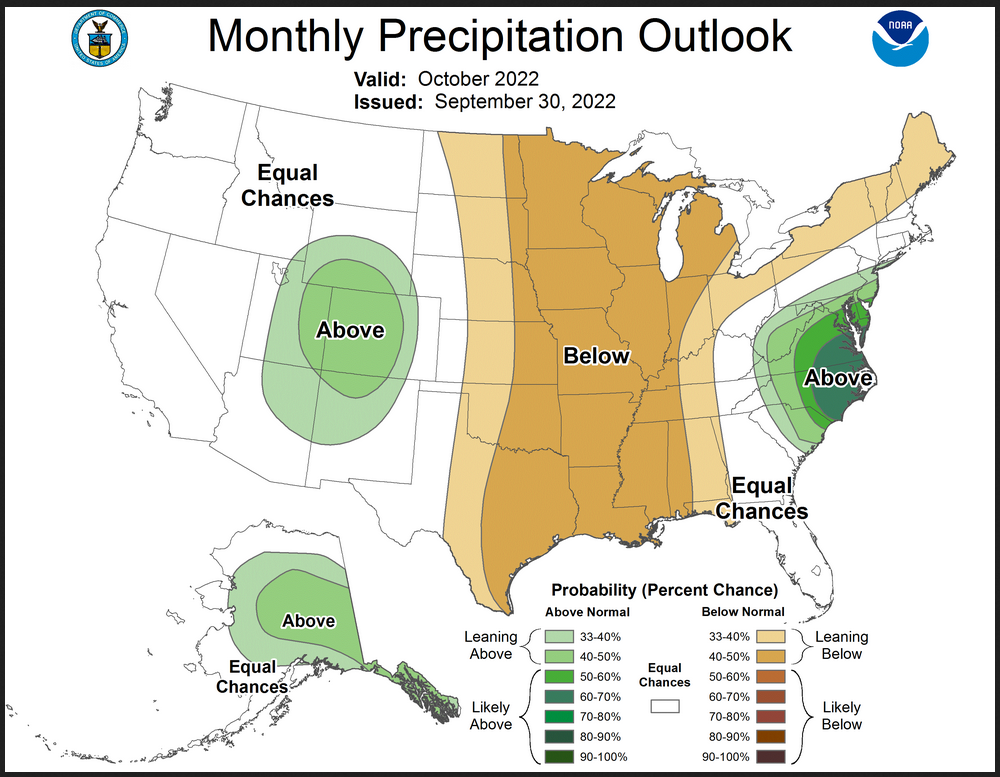
Drought expands in the Southern and to a lesser extent Central Great Plains. Anomalous wetness centered on Colorado and a cool/wet Mid-Atlantic Region.
At the end of every month, NOAA updates their Outlook for the following month which in this case is October. They also issue a Drought Outlook for the following month. We are reporting on that tonight.
There have been some significant changes in the Outlook for October and these are addressed in the NOAA Discussion so it is well worth reading. We highlighted some of the important changes within the NOAA Discussion.
Of significant interest is the Drought Outlook for October. Tropical activity has eliminated the East Coast Drought but we are beginning the increase in drought for the Great Plains that will likely continue until the end of this La Nina.
We have also included four months of Wildland Fire Potential Outlooks and also a map showing the year-to-date precipitation in the West. We also provide the Week 2/3 Tropical Outlook for the World
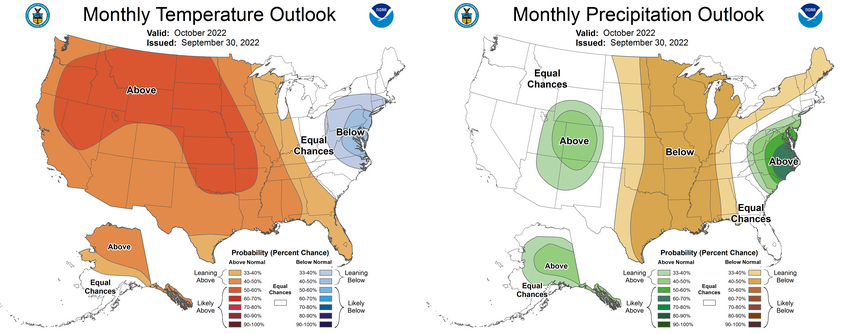
Here is the updated Outlook for October
Combination of the Updated Outlook for October and Three-Month Outlook
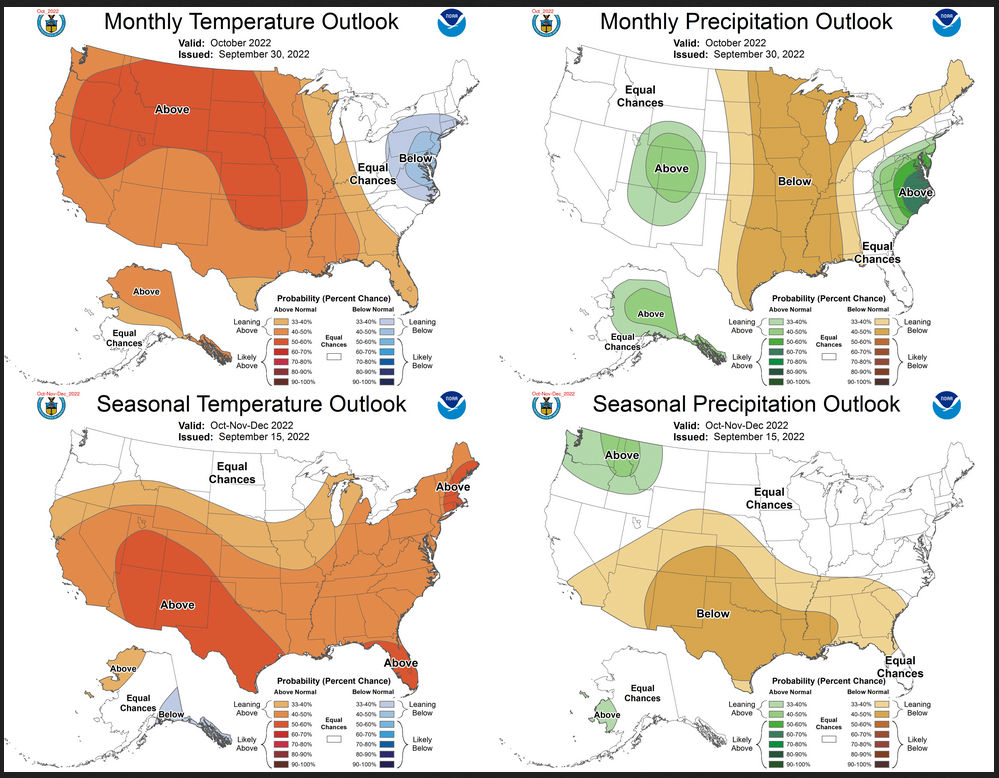
| The differences are mainly due to tropical activity and the MJO in October |
There are some reversals in the new forecast for October relative to the three-month forecast. By a reversal we mean a change from wet to dry or warm to cool. Most of the changes are from Wet/dry/warm/cool to neutral or the reverse. But there are some significant reversals.
| For both temperature and precipitation, if you assume the colors in the maps are assigned correctly, it is a simple algebra equation to solve the month two/three anomaly probability for a given location = (3XThree-Month Probability – Month One Probability)/2*. So you can derive the month two/three outlook this way. You can do that calculation easily for where you live or for the entire map. |
It is important to remember that the October Outlook was updated on September 30 and the three-month Outlook was issued on September 15. So we always wonder if a change in the one-month outlook suggests that the three-month outlook would need to also be adjusted. I think that in this case, the answer is probably NO.
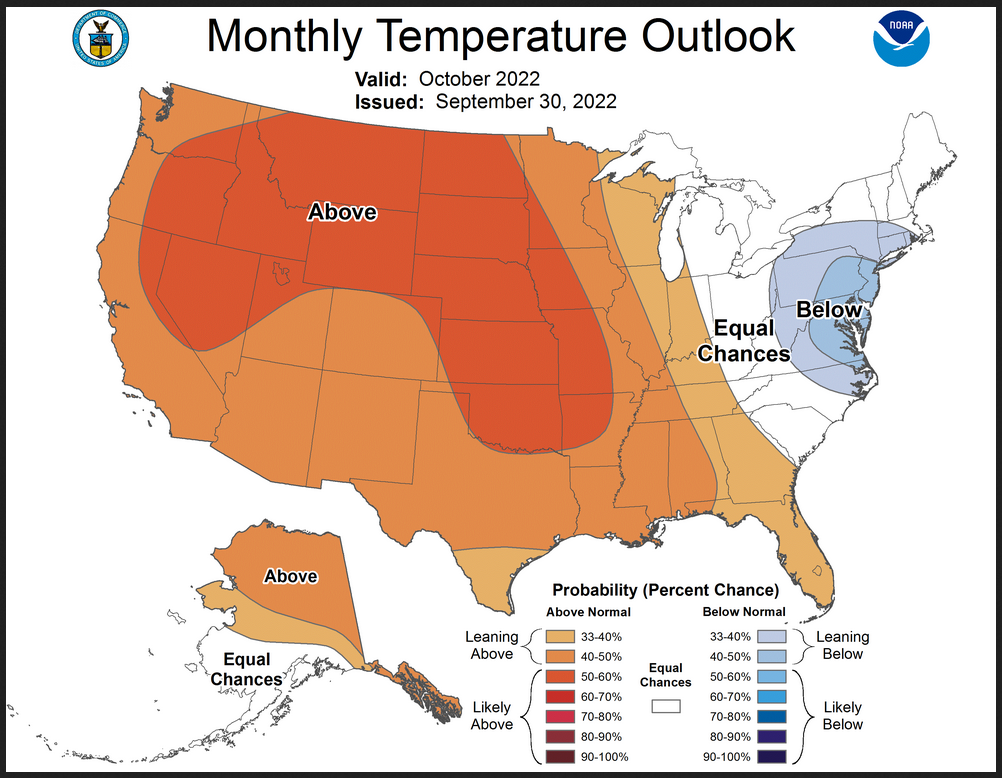
Here are larger versions of the Temperature and Precipitation Outlook maps
NOAA Discussion (I have shown certain important points in bold type)
30-DAY OUTLOOK DISCUSSION FOR OCTOBER 2022
The October updated monthly outlook is adjusted by utilizing model forecast guidance from the short, extended and subseasonal time range as well as considerations from potential MJO influences (primarily for the second half of the month). Model predictions of the RMM index indicate the development of a MJO signal that will propagate eastward to the western Pacific (Phase 6) by the middle of October. Although tropical extratropical connections are generally not as robust this time of the year (as compared to the winter/spring seasons), this evolution would tend to develop warmer conditions for the eastern CONUS and troughing and colder conditions for the western CONUS late in October.
The revised October outlook for monthly mean temperatures is generally not significantly changed from the previous outlook for most of the forecast domain. Above-normal temperatures remain favored for most of the CONUS, however, the area of focus is shifted westward so that the highest odds are now forecast for the western and central CONUS. Elevated odds for below-normal temperatures are forecast for the mid-Atlantic. The primary reason for the change in this region is cooler conditions at the start of the month from (1) cloudiness and rainfall associated with the remnants of Hurricane Ian, (2) northerly flow behind this system and trough development forecast by medium and extended range model guidance over Southeast Canada and the Northeast. The area is modest in size because anticipated cooler than normal conditions the first 10 days of October are favored to be modified during the remainder of the month consistent with subseasonal guidance and tendencies noted earlier by lagged composites of the MJO from Phase 6 during the later part of October.
Model guidance across time scales favors above-normal temperatures for much of the western and central CONUS with the greatest probabilities forecast for parts of the Pacific Northwest, northern Rockies and northern and central Plains.
For Alaska, anticipated troughing to the west of the state with a west-southwesterly flow favors high odds for above-normal temperatures for most of the state during the first 1-2 weeks and signals thereafter are not particularly strong and reliable for sufficient confidence that colder conditions would develop for the second half of the month so the area of below-normal temperatures favored in the mid-month outlook has been removed with an increase in coverage across the state for favored above-normal temperatures.
For precipitation, in the short-term in the mid-Atlantic region, the forecast is driven by the eventual rainfall from the remnants of Hurricane Ian that are forecast to occur the first few days of October. High probabilities of above-normal monthly precipitation totals are depicted for a small area in the coastal mid-Atlantic. The favored below-normal precipitation area from the mid-month outlook has been shifted eastward and oriented more north-south in the revised outlook. Anomalous northerly, drier flow after the transition and departure of Ian along with forecast trough development over eastern North America favors below-normal precipitation for the central CONUS from the Canadian border to the Gulf of Mexico.
A change was made from the mid-month outlook for the western CONUS as precipitation is anticipated during the first 1-2 weeks of October at various times for portions of the Southwest, central Rockies and Far west resulting in considerable uncertainty for the western CONUS. The forecast area of EC is increased from the mid-month outlook and an area of elevated odds for above-normal precipitation is depicted for parts of the central Rockies and Southwest. For Alaska, the aforementioned trough west of Alaska and southwesterly flow favors above-normal precipitation for much of interior part of the state and Alaska Panhandle.
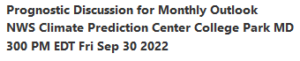
Drought Outlook
Here is the newly issued Drought Outlook for October 2022
–
| You can see where drought development is likely. The summary and detailed discussions that accompany this graphic can be accessed here https://www.cpc.ncep.noaa.gov/products/expert_assessment/mdo_summary.php |
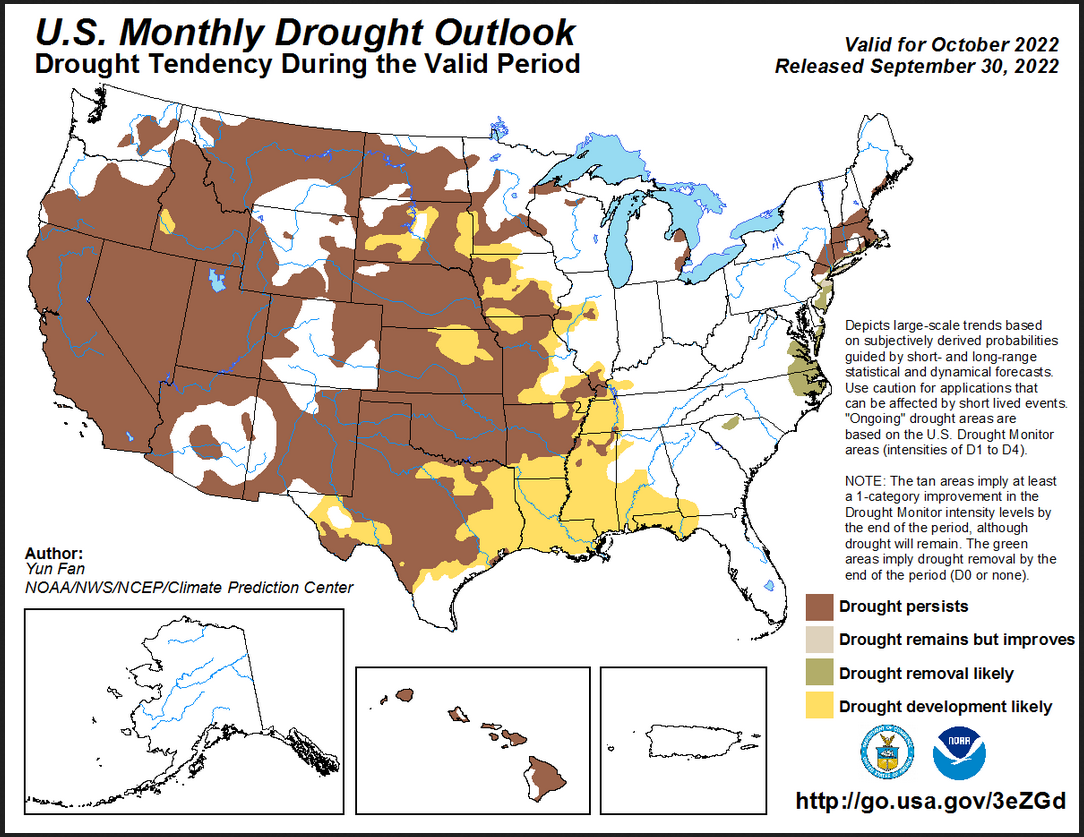
Worldwide Tropical Forecast
–
| Notice the below-normal precipitation predicted for Mexico intruding into the Southern Great Plains of the U.S.. Southern Asia looks pretty wet. The cyclone risks are only shown for Week 2. To update this forecast (which updates on Tuesdays) click HERE |
Tracking Temperature and Precipitation as the month proceeds
Looking back at September this is what we have observed.

Month-to-date Temperature as the current month evolves can be found at https://hprcc.unl.edu/products/maps/acis/MonthTD eptUS.png
Looking back at September this is what we observed.
Month-to-date Precipitation as the current month evolves can be found at https://hprcc.unl.edu/pro ducts/maps/acis/MonthPNormUS.png
No Podcast this month: sorry.
Fire Outlook: Current and Forecast
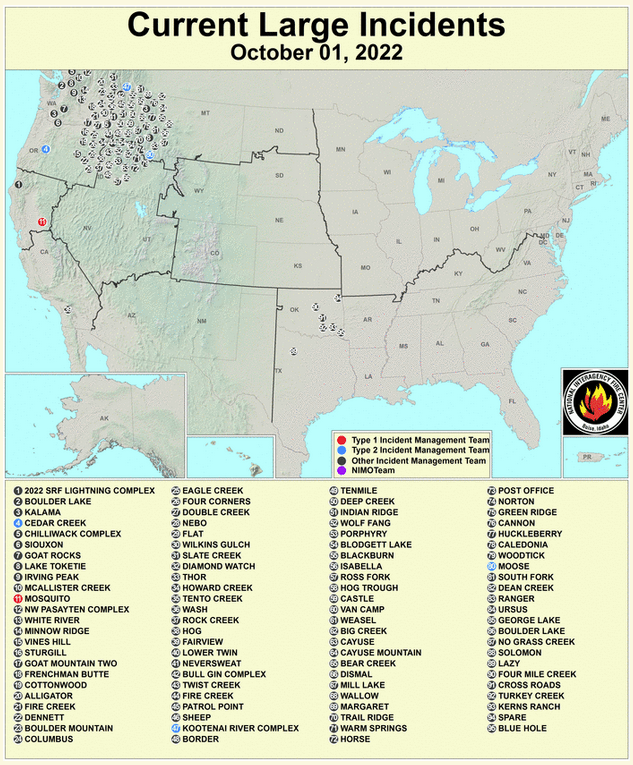
Updates to the major fire situation can be found by clicking here https://fsapps.nwcg.gov/afm/index.php
Now looking at the wildland fire potential outlooks


I have updated the above maps. If you read this article a month from now, you can update these graphics by clicking here https://www.nifc.gov
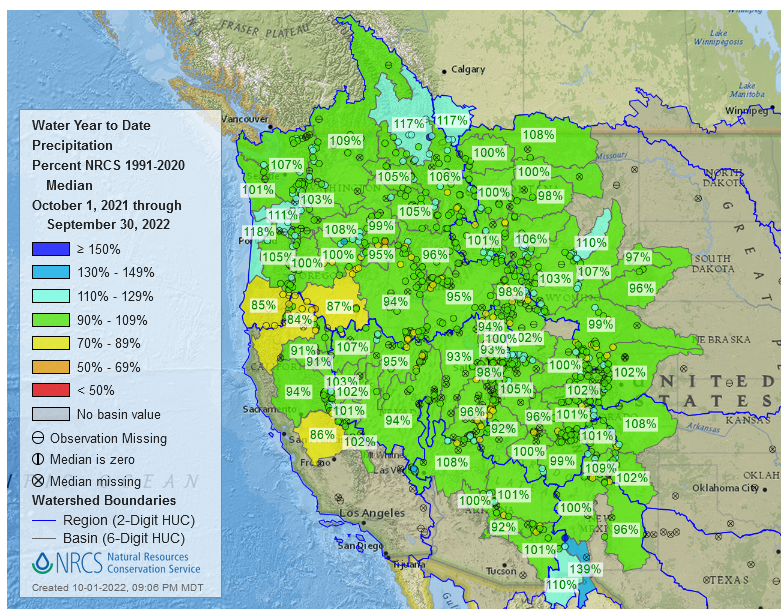
Water-Year to Date Precipitation
Water year-to-date precipitation can be found by clicking here https://www.nrcs.usda.gov/wps/portal/wcc/home/ I provided a map current as of October 1, 2022
–
| I have some questions about the above graphic. It seems too wet. Compare it to the state rankings we published recently. But we do not have the state rankings for September yet nor of course year-to-date through September so we will have to take a look at this when we have that data. Please remember the water year starts on October 1 of the prior calendar year. So the above completes the water year but does not include the first three months of the water year. It has been more a question of heat rather than a shortage of precipitation. |
| I hope you found this article interesting and useful |