Updated at 2:30 am EDT July 2, 2022 to incorporate the Week 3 – 4 Outlook which suggests that the second half of July will not be as cool in the Northwest but perhaps less warm elsewhere and the Monsoon may be less robust but some other areas will be less dry.
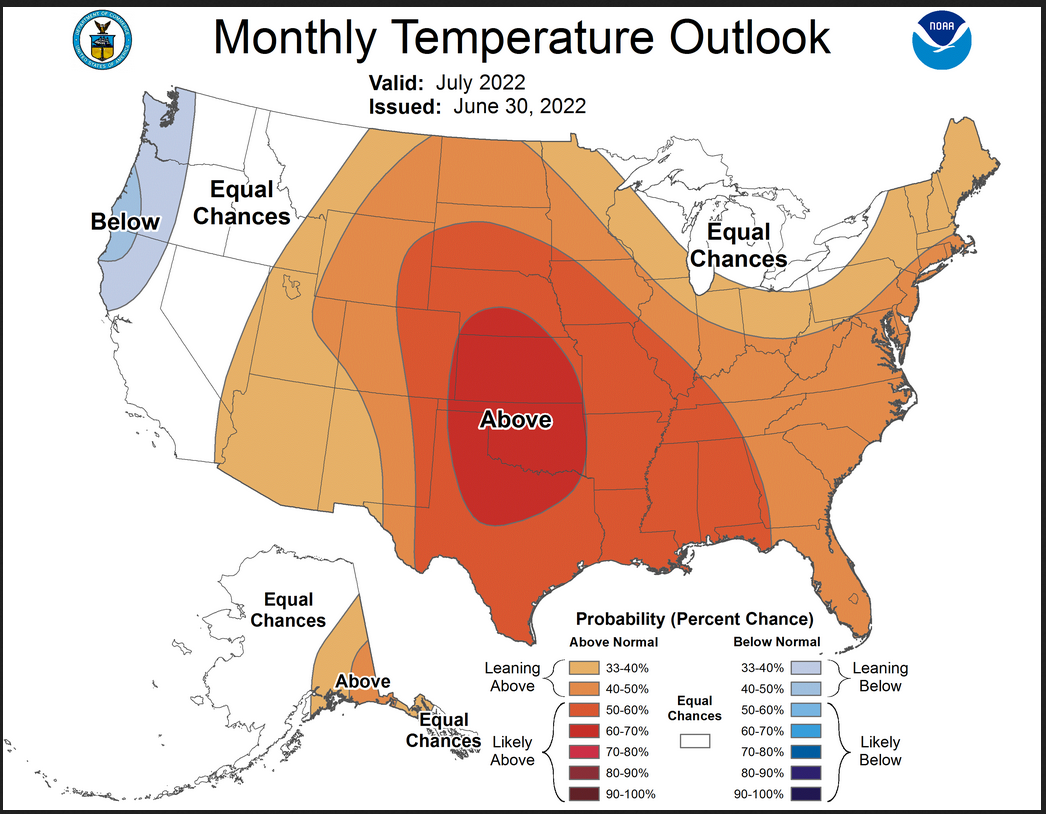
At the end of every month, NOAA updates their Mid-Month Outlook for the following month which in this case is July. They also issue a Drought Outlook for the following month and update the three-month Drought Outlook. We are reporting on that tonight. The updated Outlook is very similar to the Mid-Month Outlook. This is surprising since the Mid-Month Outlook was issued two weeks ago and there usually are more changes in that period of time.
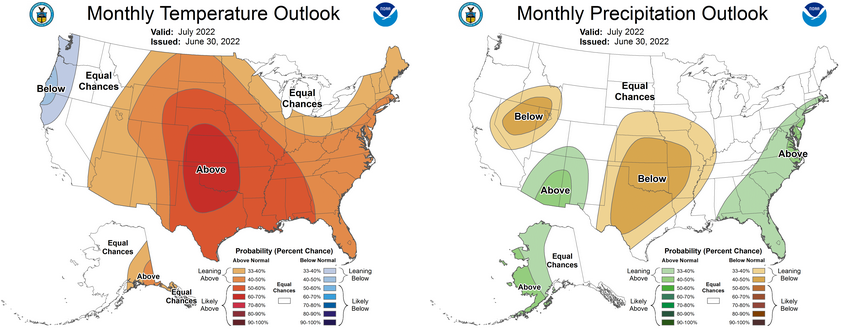
For temperature, the shape and location of the large dry anomaly have changed a bit. The cool anomaly in the Northwest is now slightly larger. For precipitation, the area where an above-average Monsoon is forecasted is a little larger and shifted a bit to include more of New Mexico. there is a new small dry anomaly
We provide partial-month Outlooks for the first 22 days of July which allows us to somewhat assess if the Monthly Outlook is consistent with the partial-month Outlooks and it generally is. But we will not be able to answer that question definitively until the Week 3-4 Outlook is issued tomorrow. We will provide an update at that time.
We also provide enough information for readers to understand any changes from the Mid-Month Outlook and we try to figure out why these changes were made. Many of the changes are explained in the NOAA discussion which is included in the article. The partial-month forecasts that we have provided show how NOAA thinks this will play out as the weather pattern evolves during July.
There is also a discussion of the ENSO condition which is ever so slightly different than what NOAA used to develop the Mid-Month Outlook. But there is a fairly strong signal that this La Nina will end in late winter 2022/2023. The impacts on weather may not be noticed until Spring. But that is just the current forecast and can change.
We have also begun our tropical storm coverage. Yes, it is that time of the year. We are also providing special coverage of the Monsoon by providing the links to those daily updates.
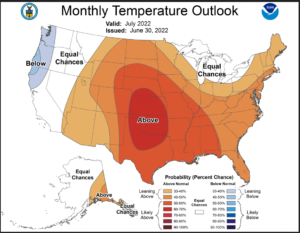
Here is the updated Outlook for July
Combination of the Updated Outlook for July and Three-Month Outlook
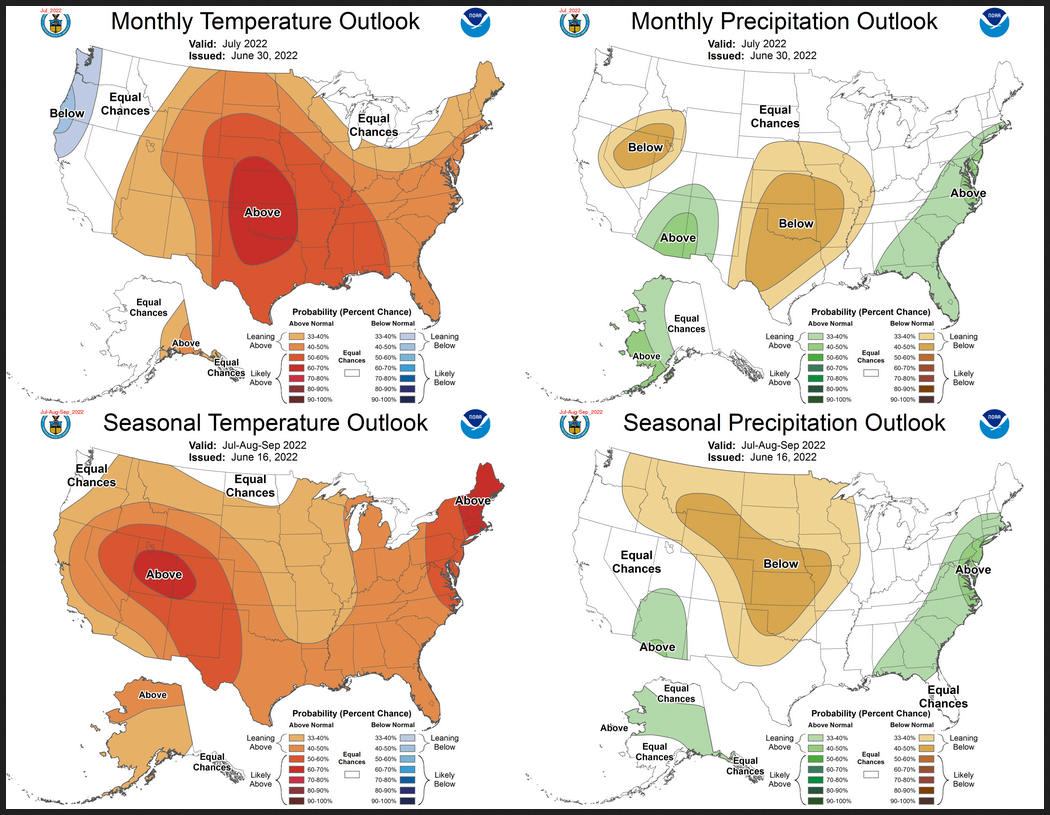
Notice that for both temperature and precipitation, the July Outlook and three-month Outlook are not similar. This suggests that the August/September Outlook if shown would be different than either the July Outlook or the Three-Month Outlook. For temperature, the July single-month Outlook shows a smaller area of above-normal temperatures with part of the Northwest being cooler than Normal. For precipitation, the July single-month Outlook shows a dry area in the Nevada/Idaho area that is not in the three-month Outlook Plus the location and size of the large dry anomaly is different.
There are very few reversals in the new forecast for July relative to the three-month forecast. By a reversal we mean a change from wet to dry or warm to cool. Most of the changes are from Wet/dry/warm/cool to neutral or the reverse.
| For both temperature and precipitation, if you assume the colors in the maps are assigned correctly, it is a simple algebra equation to solve the month two/three anomaly probability for a given location = (3XThree-Month Probability – Month One Probability)/2*. So you can derive the month two/three outlook this way. You can do that calculation easily for where you live or for the entire map. |
It is important to remember that the July Outlook was updated on June 30 and the three-month Outlook was issued on June 16. So we always wonder if a change in the one-month outlook suggests that the three-month outlook would need to also be adjusted. I think that in this case, the answer is “no”.
Here are larger versions of the Temperature and Precipitation Outlook maps
NOAA Discussion (I have shown certain important points in bold type)
30-DAY OUTLOOK DISCUSSION FOR JULY 2022
The updated temperature and precipitation outlooks for July 2022 reflect recent dynamical model guidance from the GEFS, ECMWF and CFSv2, as well as current WPC week 1 outlooks and the CPC week 2 and week 3-4 outlooks. Tropical convective activity in recent months has been related to a series of fast moving Kelvin waves. Current tropical circulation and convection project onto an active Madden-Julian Oscillation (MJO) over the Maritime Continent based on the Real-time Multivariate MJO (RMM) index. The GEFS and ECMWF predict continued eastward propagation of the MJO into the Western Pacific, potentially impacting the climate over North America during July. La Niña conditions continue across the equatorial Pacific, with negative sea surface temperature (SST) anomalies over much of the east-central and eastern Pacific Ocean. However, sea surface temperatures have warmed across most of this region in recent weeks, and the Niño 3.4 SST anomaly has decreased in magnitude to -0.6 degrees C. Positive subsurface ocean temperature anomalies continue to expand eastward across most of the equatorial Pacific Ocean, while negative subsurface temperature anomalies persist near the surface over the central Pacific Ocean and at depth over the Eastern Pacific. La Niña conditions are expected to persist through July and may impact the climate of North America. An active MJO over the Maritime Continent could reinforce La Niña impacts. Land surface soil moisture conditions were also consulted for the updated July outlook.
The temperature outlook for July indicates enhanced probabilities for above normal temperatures for southeastern Alaska including the northern Alaska Panhandle, consistent with the CPC temperatures outlooks for the 6-10 day, week 2, and week 3-4 periods, as well as forecast guidance from the CFSv2 for July and the consolidation of GEFS and CFSv2 temperature forecasts for weeks 1 through 4. Uncertainty has increased among the forecast tools for other areas of Alaska, such that equal chances of above, near and below normal temperatures are predicted for all other areas of the state. The temperature outlook for July indicates enhanced probabilities of below normal temperatures for coastal areas of the Pacific Northwest, reflecting WPC temperature outlooks for the first week of the month, CPC temperature outlooks for the 6-10 day period from earlier in the week, as well as a consolidation of GEFS and CFSv2 temperature forecasts for weeks 1 through 4. Troughing and below normal temperatures over the west coast of the CONUS are consistent with La Niña impacts at this time of year. Above normal temperatures are favored for much of the central and eastern CONUS for July, excluding most of the Great Lakes region, under predicted positive 500-hPa height anomalies in dynamical model guidance and consistent with the CPC 6-10 day, week 2, and week 3-4 outlooks. Above normal temperatures are slightly favored for the Southwest Monsoon region, consistent with the week 2 outlook, where enhanced monsoon precipitation may moderate temperatures. Significant heat and probabilities for above normal temperatures exceeding 60 percent are forecast over the central CONUS, including parts of the Central and Southern Plains.
The precipitation outlook for July indicates a slightly enhanced probability of above normal precipitation over western Mainland Alaska, east of a predicted trough during much of July, and consistent with CPC precipitation outlooks for the 6-10 day, week 2, and week 3-4 periods. Below normal precipitation is favored from the California Sierras across the Great Basin to the Rockies, consistent with the precipitation outlooks for the 6-10 day, week 2, and week 3-4 periods and CFSv2 precipitation forecasts for July. An enhanced monsoon is predicted early in the month as well as in recent 6-10 day, week 2, and week 3-4 outlooks, leading to predicted above normal precipitation across much of the region in the July outlook. Below normal precipitation continues to be favored for parts of the Central Plains, Southern Plains, and Central Mississippi Valley and has been extended southward into much of Texas in the updated July outlook, consistent with current model guidance, particularly for early in the month. Above normal precipitation continues to be favored for much of the Eastern Seaboard from Florida to southern New England, including a greater area of the Florida Peninsula and Southeast, consistent with current dynamical model forecasts for July.
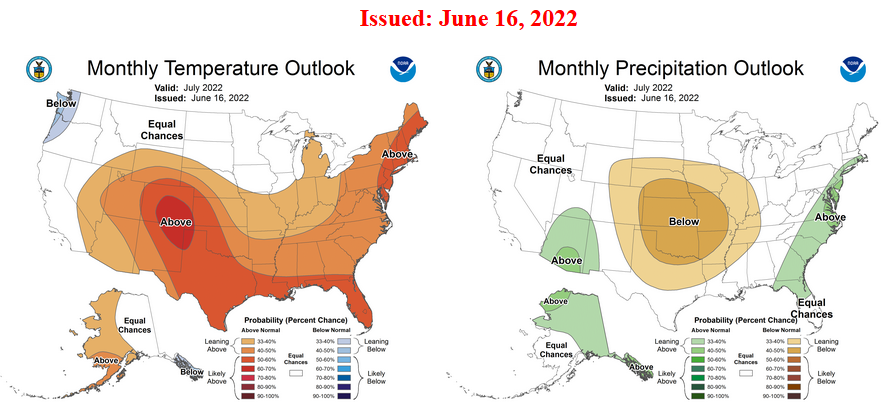
One way to get a handle on what has changed is to compare the updated July Outlook with the Mid-Month Outlook for July issued on June 16, 2022. They may now be calling that the Mid-Month Outlook.
|
|
 |
|
There has not been that much change. The shape of the warm anomaly has changed a bit and the area of the most intense heat has changed a bit. There is an additional dry anomaly. The coverage of the Monsoon has shifted a bit to include more of New Mexico. The overall changes are surprisingly minor.
|
Visual Consistency Testing.
What I am going to try to do is show the 5-day Outlook, 6 – 10 day Outlook, 8 – 14 day Outlook, and Week 3-4 Outlook. Since this is a Thursday this will give us 22 days of Outlooks out of 31 days in July. So it should be pretty good. We may update this analysis after the next Week 3 -4 Update tomorrow.
Let’s see what we have: Very short-term forecasts (expressed as absolute values) and intermediate-term outlooks (deviations from Normal and associated probabilities.
First Temperature
| Showing the forecasted Day 3 Max Temp and Day’s 6 – 10, Day’s 8 – 16 and Weeks 3 – 4 Outlooks |
Considering the updated week 3 – 4 Temperature Outlook
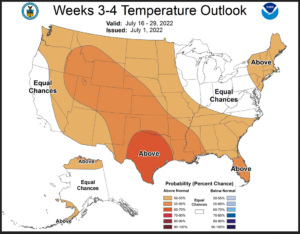
| At this point in time, we have 22 days of short-term temperature Outlooks for July which has 31 days. The full-month Outlook seems to be consistent with the partial-month Outlooks. We will have more confidence in this when we have the updated Week 3 -4 Outlook tomorrow. |
Then precipitation
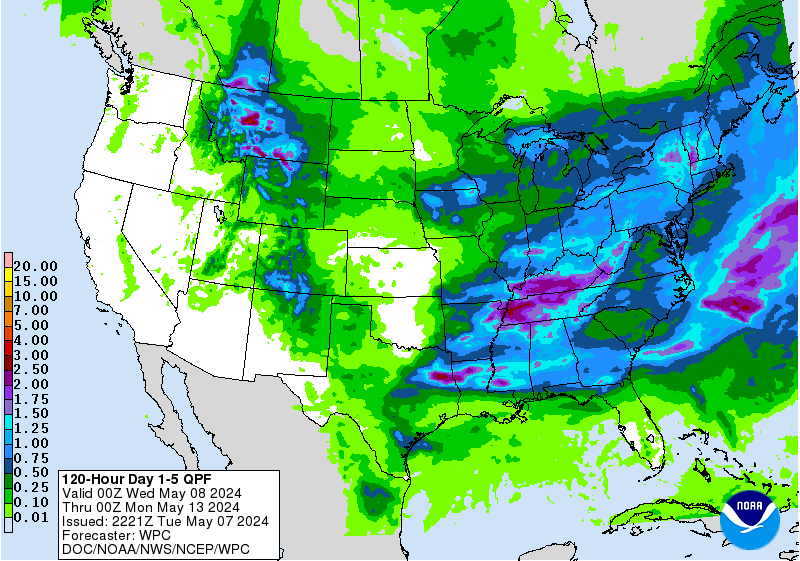
| Showing the forecasted Days 1 – 5 Cumulative precipitation and Day’s 6 – 10, Day’s 8 – 16 and Weeks 3 – 4 Outlooks |
Comparing the prior Week 3-4 Precipitation Outlooks
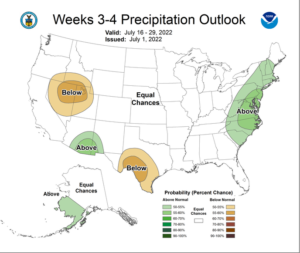
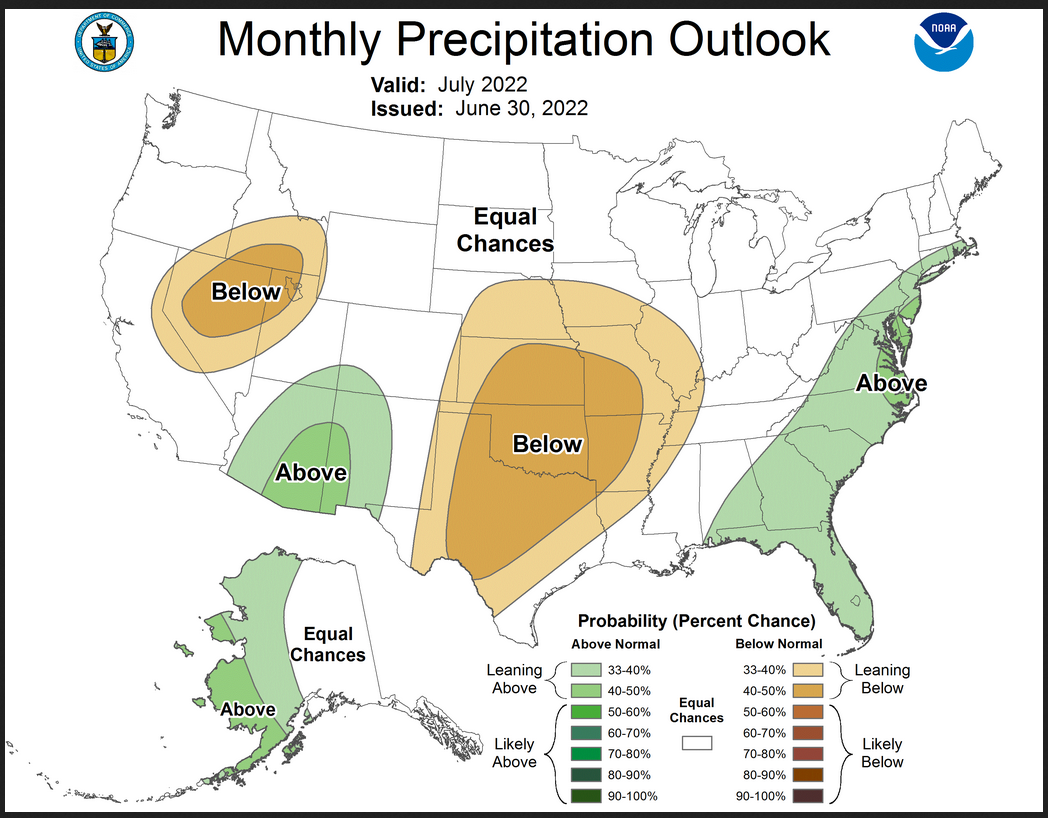
| At this point in time, we have 22 days of short-term precipitation Outlooks for July which has 31 days. The full-month Outlook seems to be consistent with the partial-month Outlooks. We will have more confidence in this when we have the updated Week 3 -4 Outlook tomorrow. |
Drought Outlook
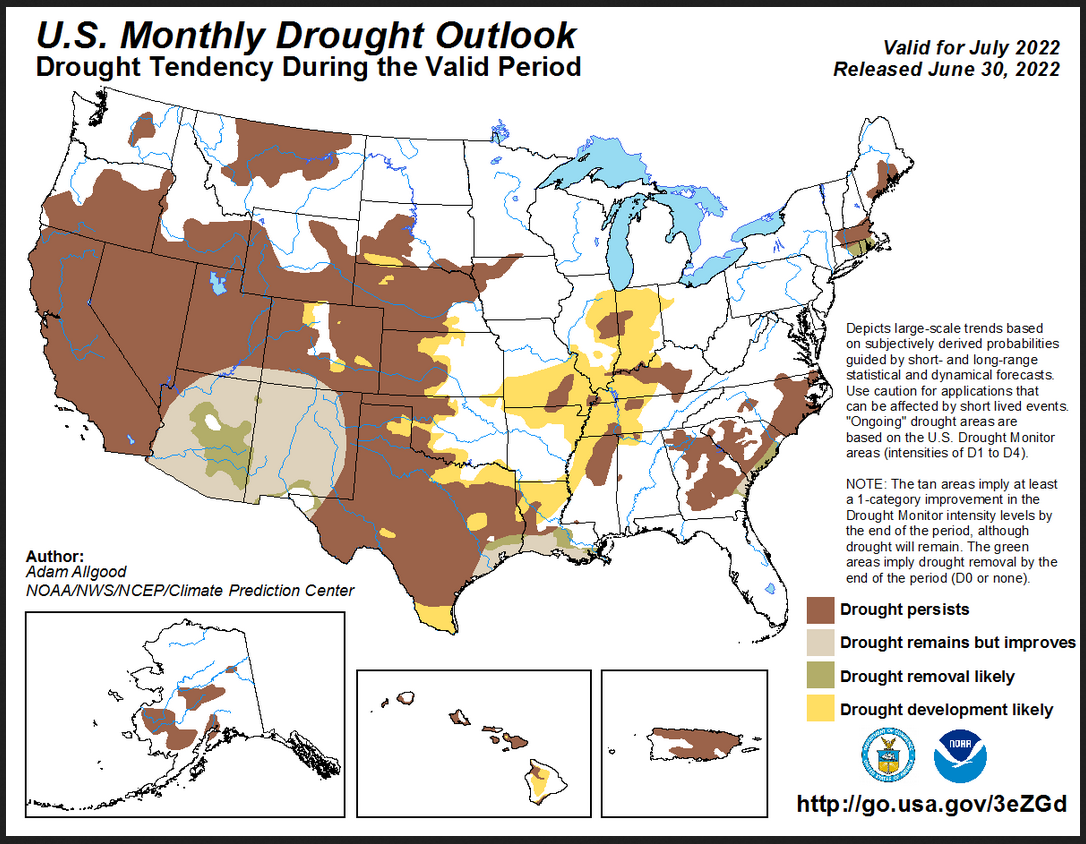
Here is the newly issued Drought Outlook for July 2022
–
| You can see where the Monsoon and potential tropical activity along the Gulf Coast will improve the drought situation and where drought development is likely. The summary and detailed discussions that accompany this graphic can be accessed here https://www.cpc.ncep.noaa.gov/products/expert_assessment/mdo_summary.php |
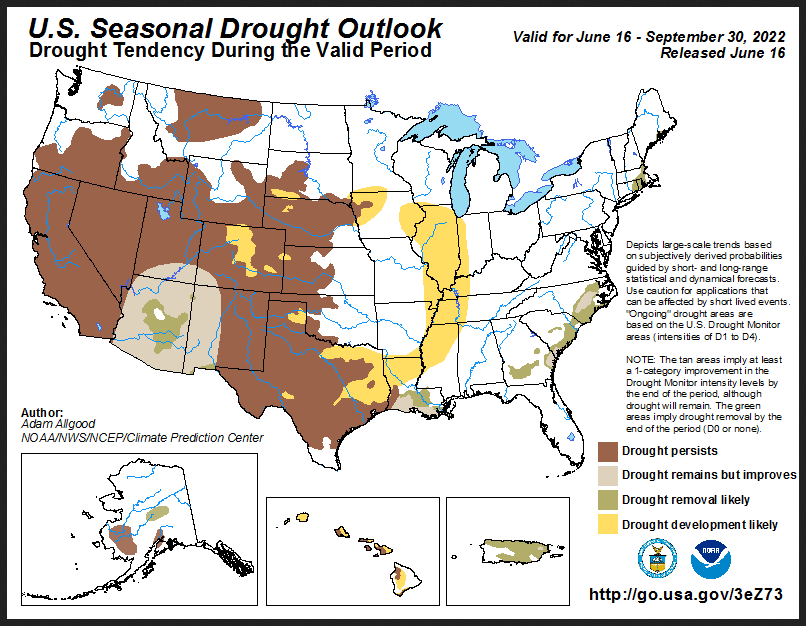
This is something new. They now provide an updated Seasonal Drought Outlook
–
| It is quite similar to the one-month drought Outlook. And here is the link for the discussion https://www.cpc.ncep.noaa.gov/products/expert_assessment/sdohomeweb.png |
Has There Been a Change in the ENSO Outlook?
We actually discussed the assumptions used by NOAA to prepare the Mid-Month Outlook for July when I reported on the NOAA Seasonal Outlook which you can read by clicking here https://econcurrents.com/2022/05/13/noaa-updates-the-enso-forecast-on-may-12-2022-chances-of-a-la-nina-three-peat-are-61/
The question then is has the situation changed.
The key information used by NOAA follows.
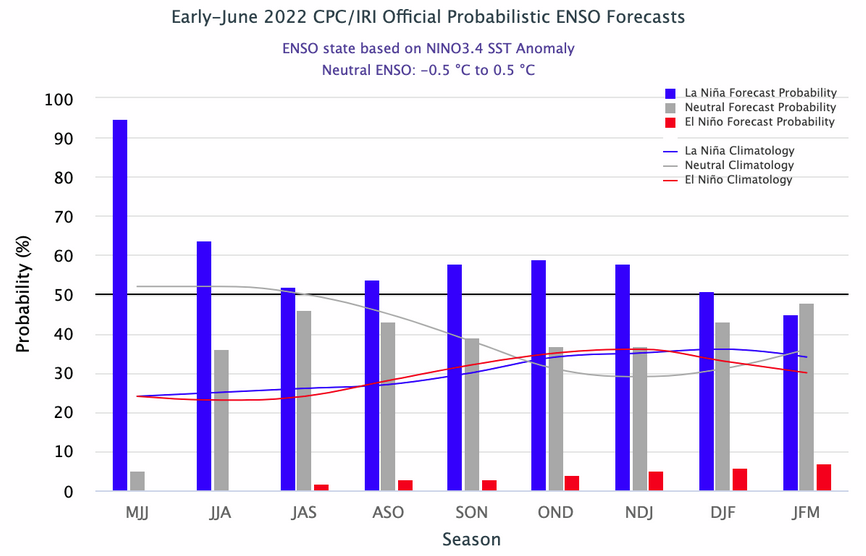
So has there been any change? Here is the new IRI Forecast released on June 20, 2022
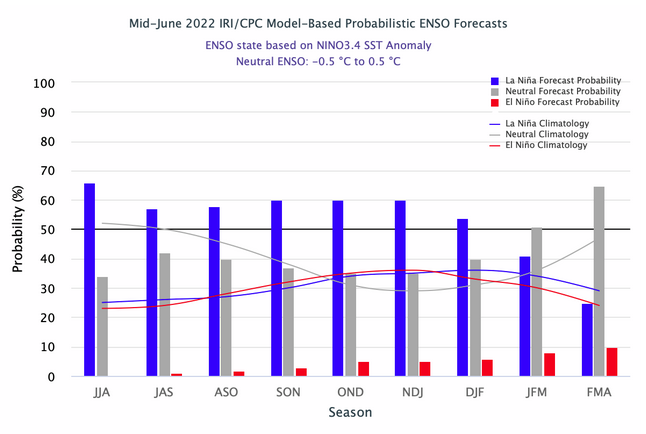 Here we look at them side by side.
| For purposes of looking at the July Outlook, we are interested in the JAS forecasts and they have not significantly changed.
It is not the topic of this article but look to the right and the FMA 2023 forecast. It is for ENSO Neutral. |
Here is another more thing to look at
–
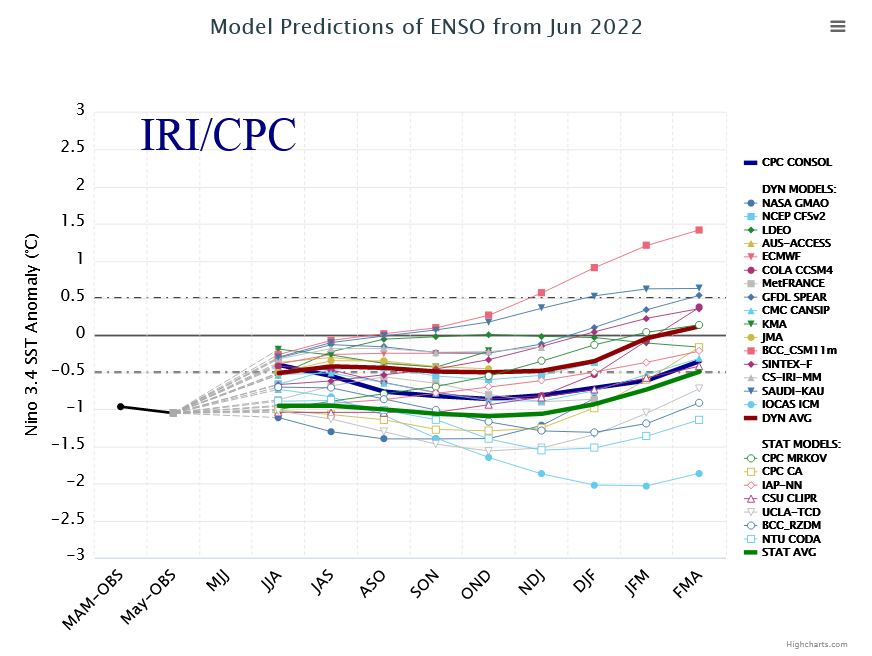
| This is a little hard to read. There is a bunch of models but three heavy lines one of which is the average of the dynamic models, another is the average of the statistical models and the third is the Composite of both sets of models.
Some think the dynamic models are the best and they show La Nina ending in the DJF 2022- 2023 time frame. |
What Does the NOAA Proprietary ENSO Model Forecast?
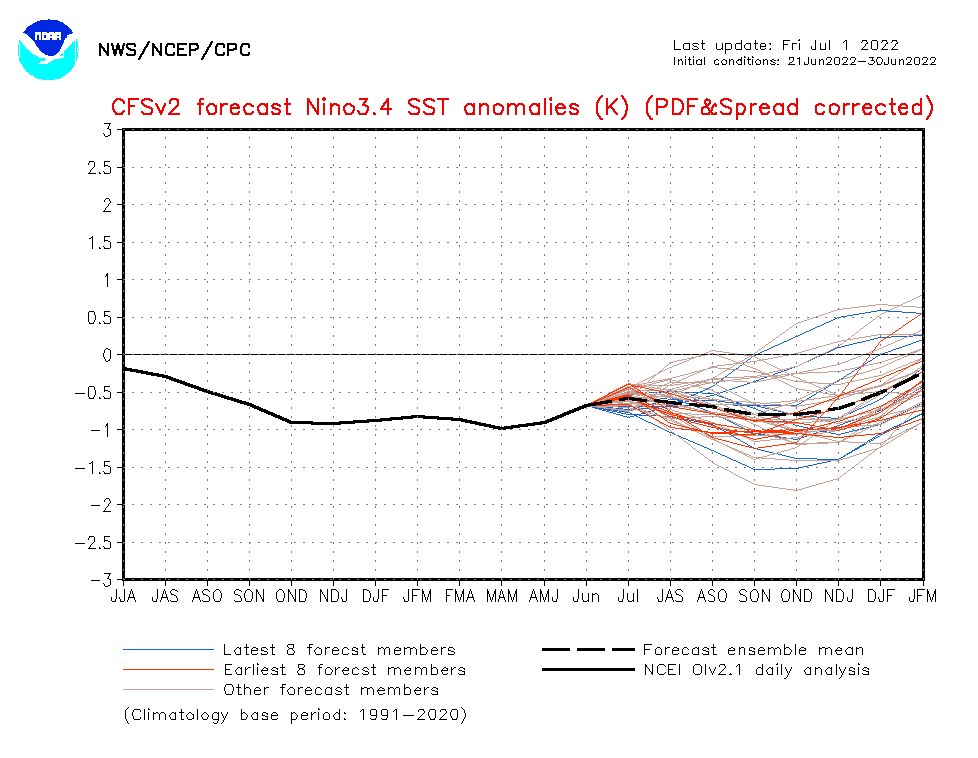
| These model results do not tend to change rapidly but you can update the model results by clicking here https://www.cpc.ncep.noaa.gov/products/people/wwang/cfsv2fcst/images3/nino34SeaadjPDFSPRDC.gif This model no longer shows La Nina continuing indefinitely. It had been showing that for some time but NOAA relies more on the IRI Forecast. But perhaps this model is now showing that we are becoming ENSO Neutral with a strong La Nina bias. So this is not a major change but it may be enough of a change to have things be less extreme. It actually forecasts ENSO Neutral or borderline La Nina for July: -0.5C is the cutoff point for La Nina. The NOAA discussion mentions -0.6 but that refers to the actual for June. July looks borderline and then La Nina strengthens for a while and then moves towards neutral in this model. I have presented some other graphics that suggest we are not in La Nina right now. But I have not checked the atmospheric conditions. Remember that ENSO is a combination of Sea-Surface conditions and the reaction of the atmosphere to those conditions. It is not the purpose of this article to review the Seasonal Outlook but I have noticed some characteristics of the oceans that make me wonder if we may progress out of this La Nina faster than some think. I also have some questions about the Phase of the PDO and that is very important. |
Let’s look at Sea Surface Temperatures.
This shows the current actual situation looking at the Sea Surface Temperature. I am not addressing the response of the atmosphere which is what confirms the state of ENSO. To impact CONUS weather or weather anywhere in the world, the Walker Circulation (I am not going to explain that tonight) has to respond to the Sea Surface Temperature. It has been responding so we do not need to discuss it with respect to the July Outlook. But to move out of La Nina to ENSO Neutral, the Walker circulation will have to respond.
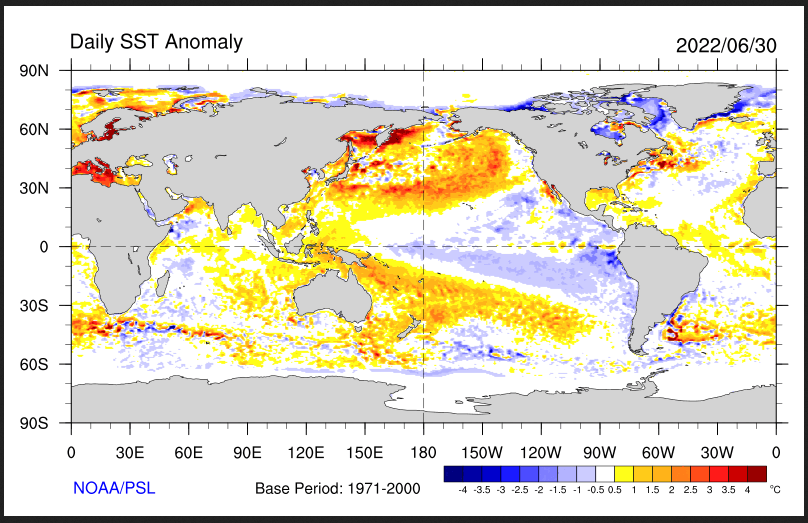
To update this image click on https://psl.noaa.gov/map/images/sst/sst.daily.anom.gif
| Notice that most of the blue (cool) area is south of the Equator and the blue area extends to the west and north of the Equator there are very large gaps in the blue. One can also see that we sort of remain in PDO-(Neg). The water is cool (compared to normal) along the west coast of North America* with the warm anomaly out to sea. That is characteristic of PDO-(Neg)
* I do not see the cool water along the West Coast…very interesting! But the warm water anomaly remains offshore. Things may look different during the summer. Additional maps can be found by clicking here https://psl.noaa.gov/map/clim/sst.shtml |
Where is ENSO Measured?

You can mentally superimpose the Nino 3.4 area shown encompassing part of the yellow and part of the red areas in the above map and you can see that it is cool in the Nino 3.4 area especially South of the Equator. That is an oddity of this La Nina that is both westerly displaced and focused mostly south of the Equator. There is not much discussion of that and how that might impact our weather.
How About the Future?
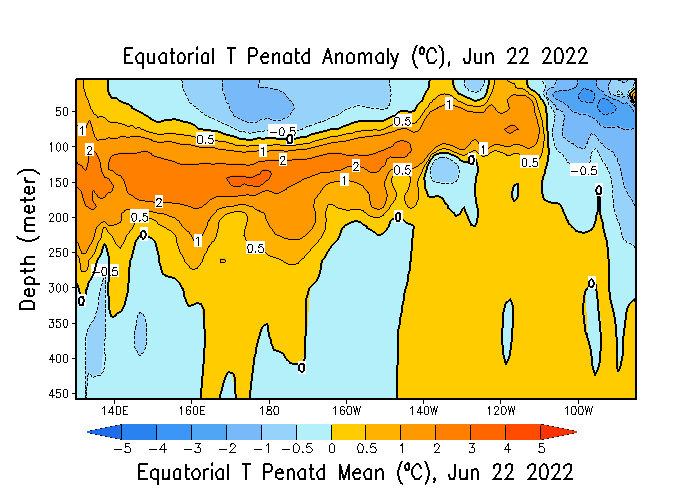
ENSO is measured at the surface of the ocean because it is the surface that interacts with the atmosphere. But the surface changes over time so we pay a lot of attention to the subsurface. Here is what it looks like now. Does it look like it will soon be other than cool? It is complicated because we are looking at anomalies not absolute temperatures and we are only looking at a cross-section at the Equator when the Nino 3.4 Area extends five degrees north and south of the Equator but there is only so much information that can be presented in one graphic. Sea Surface Temperature Anomalies are only one component of ENSO but probably the most important component and La Nina is relative to SSTA is defined as -0.5C or colder.
I am showing six snapshots of the situation each of which is centered on a five-day period of time. The most recent one is at the top of the stack. Here we are just looking at the Equator but from the surface down to 450 meters. And we are looking at the temperature anomalies. The Nino 3.4 Index is measured at the surface but the subsurface may become the future surface. There no longer is anomalously cool water almost everywhere on the surface. Off to the west, the warm Indo-Pacific Warm Pool has moved back and forth from west to east from prior months but it is quite intense with maximum anomalies in a small area of 3 degrees Celsius. And we must remember that these anomalies are calculated based on the seasonal norms for water at that depth. So three degrees warmer than usual does not mean it is warmer than the water at the surface. So it will not automatically rise.
Analysis Updates
I realize that is complicated. But it is important to understand. The analysis updates every five days but the graphics in this article are frozen. However, an updated version of this graphic can be found at https://www.cpc.ncep.noaa.gov/products/analysis_monitoring/ocean/weeklyenso_clim_81-10/wkteq_xz.gif. It comes with an upper graphic like the images shown below which is the temperature anomalies. It also has a lower graphic which is the actual water temperatures. Both are useful.
 |
 |
 |
 |
 |
 |
| There has been a large change since last month. It looks like that for the time being we are no longer
in La Nina |
How Does it All Net Out?
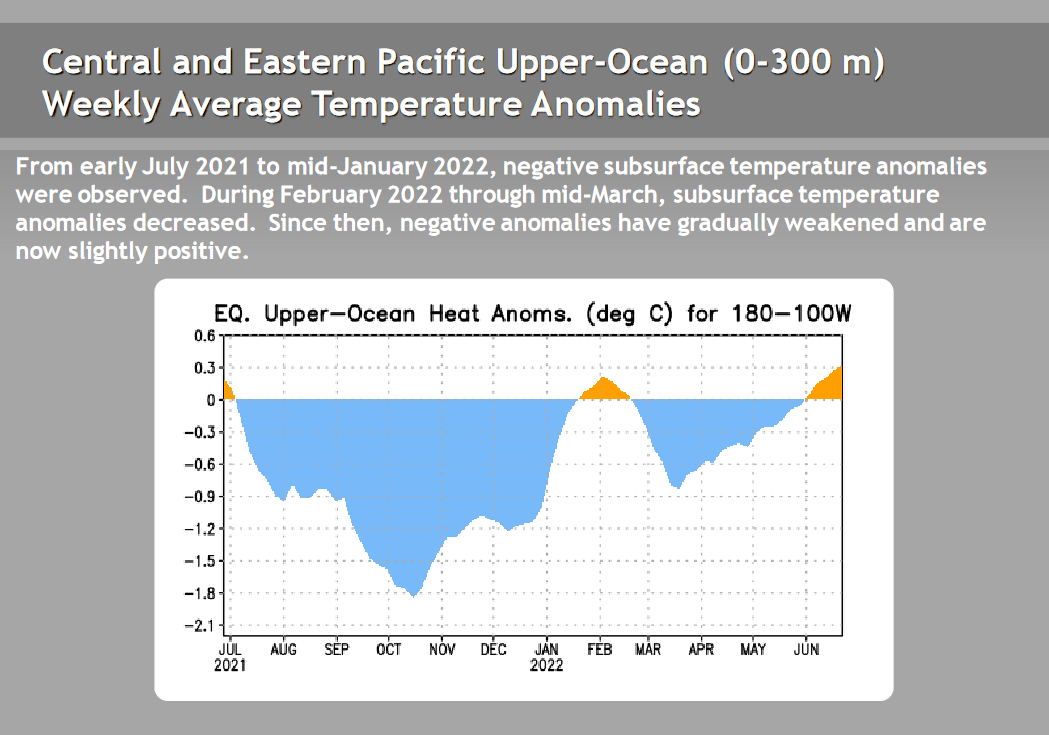

| Basically in the above, the anomalies from all depths are averaged out so it seems that the overall cool anomaly is slowly weakening and now reads net positive. But you can not take that for granted since there are cool currents that enter the area.
But the image on top which is the latest suggests we are no longer in La Nina. |
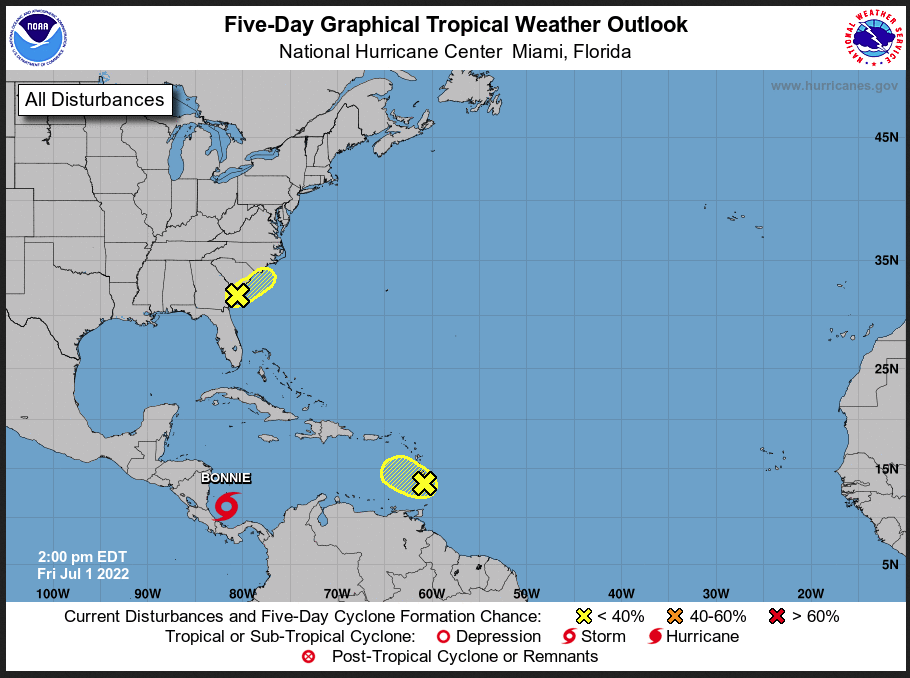
Possible Tropical Events
Worldwide Tropical Forecast (This graphic updates on Tuesdays)

–
| Notice the Tropical Event in the Western Gulf of Mexico. It could stimulate the North American Monsoon. But the forecasts are not showing this. |
To update this forecast (which updates on Tuesdays) click here https://i0.wp.com/www.cpc.ncep.noaa.gov/products/precip/CWlink/ghazards/images/gth_small.png?resize=1100%2C850&ssl=1
Now More Detail for the Western Atlantic and the Pacific Oceans
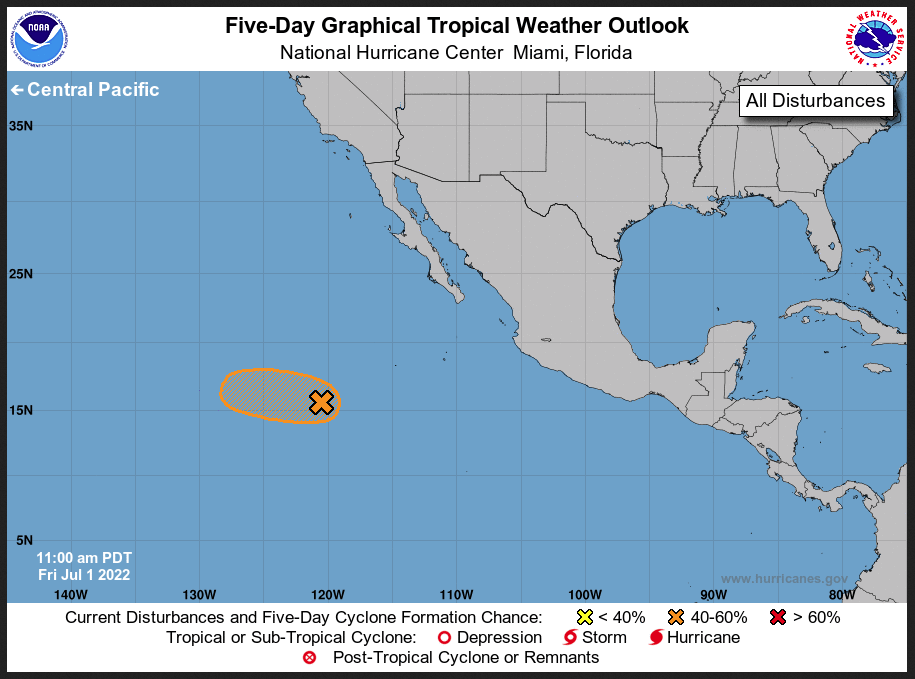
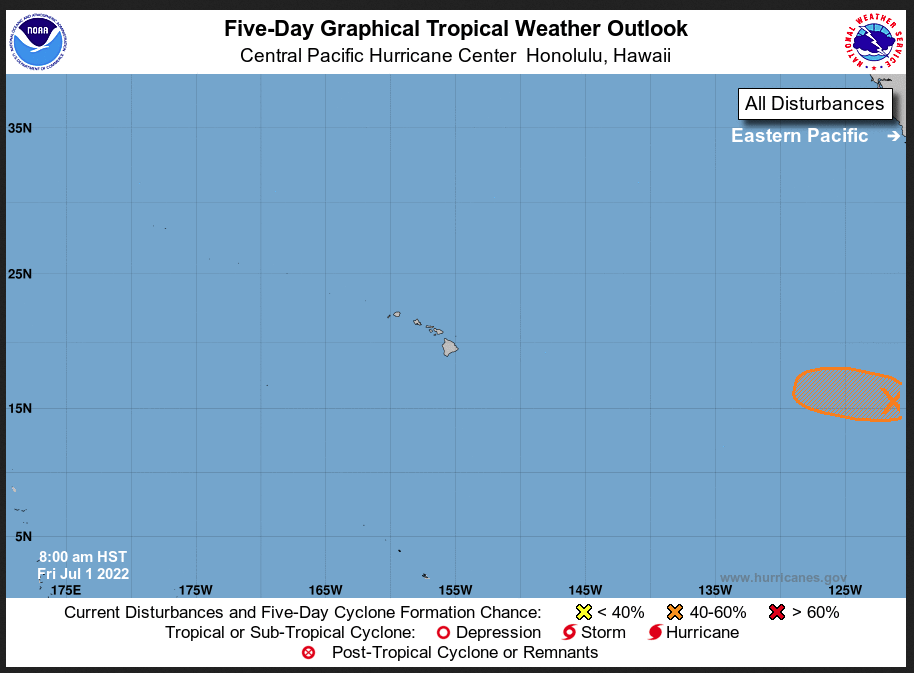
The below are three maps that summarize the situation for the Atlantic, Eastern and Central Pacific as of the time this article was published. Updated and additional information can be accessed by clicking HERE
Atlantic and Gulf of Mexico
The Eastern Pacific
The Central Pacific
Repeating that updates on individual storms with much additional information in the Atlantic and Eastern and Central Pacific can be obtained by clicking HERE
Sometimes it is useful to take a look at Persistence. Is the June Outlook similar to the May reported weather?
Looking back on June 2022 to relate the forecast for July to the actual for June.
Here is the actual for June minus two days on the left and the updated Outlook for July on the right. One row is for temperature and the bottom row is for precipitation.
| JuneActual (28 0f 30 Days) | July Updated Outlook | |
| Temperature | 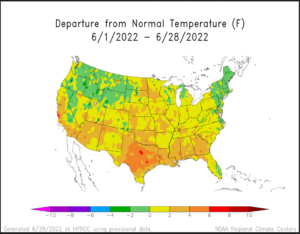 |
|
| Precipitation | 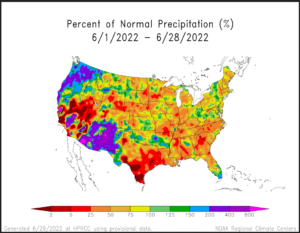 |
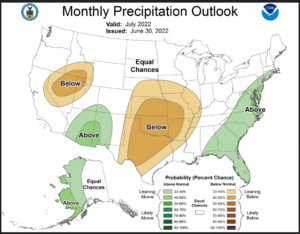 |
There seems to be some persistence meaning that July is expected to be somewhat similar to June in terms of variation from Normal with respect to both temperature and precipitation. Of course, Normal for July is different than Normal for June
The images above are frozen. But if you want to find month-to-date temperature or precipitation there are the links.
Month to date Temperature can be found at https://hprcc.unl.edu/products/maps/acis/MonthTDeptUS.png
Month to date Precipitation can be found at https://hprcc.unl.edu/products/maps/acis/MonthPNormUS.png
AO and NAO forecasts (Not significant right now)
To find the latest forecasts click here https://www.cpc.ncep.noaa.gov/products/precip/CWlink/daily_ao_index/teleconnections.shtml
Southwest Monsoon Update.
I am providing the links as the situation changes from day to day. Plus there are a lot of maps and graphics to look at so this would slow down your computer and not everyone is interested.
Arizona
Just click on this link https://cals.arizona.edu/climate/misc/monsoon/az_monsoon.html
New Mexico
Just click on this link https://cals.arizona.edu/climate/misc/monsoon/nm_monsoon.html
Overall Southwest
Just click on this link https://cals.arizona.edu/climate/misc/SWMonsoonMaps/current/swus_monsoon.html
Some might find this interesting. Click to hear the podcast. You will have to click twice. Once to get to the dashboard and then to start the podcast
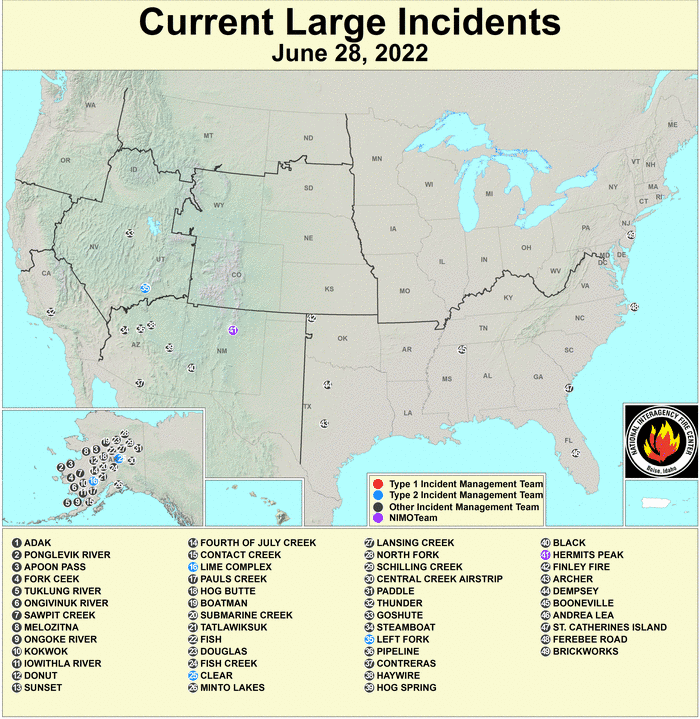
Fire Outlook. (the forecast maps will update on July 1 so we will add them then
Updates to the major fire situation can be found by clicking here https://fsapps.nwcg.gov/afm/index.php
Wildfire risks by month can be found here https://www.predictiveservices.nifc.gov/outlooks/outlooks.htm (We add them on July 1 since that is when there were updated.)

Water-Year to Date Precipitation
Water year-to-date precipitation can be found by clicking here https://www.nrcs.usda.gov/wps/portal/wcc/home/
–
| I hope you found this article interesting and useful |
