How does CPI inflation vary when the Fed Funds Rate changes, using year-over-year data? That is the current question in our investigation of possible cause-and-effect relationships for changes in inflation.
Marriner S. Eccles Federal Reserve Board Building, Wikipedia,
Creative Commons Attribution-Share Alike 3.0 Unported license.
Introduction
A previous study examined the correlation between monthly changes in the Fed Funds Rate (FFR) and the Consumer Price Index (CPI).1 Further consideration of that study2 found situations where noise rather than meaningful changes in a variable produced significant correlation. The study of noise led to the finding that year-over-year changes in the two variables appear to offer less interference from noise in the data.3
We continue to examine the linear association of CPI with various variables associated with money.
I = mS + b
In all our previous studies, the dependent variable I has been CPI. This includes the monthly changes study with FFR as S.
In this post, S (independent variable) is CPI, and FFR is treated as the dependent variable. This is entirely equivalent mathematically to the treatment with dependent and independent variables reversed.4
Data
Long-term monthly data for both CPI5 and Fed Funds rates6 are available. In this study, the year-over-year rates of change are calculated monthly. Each month’s data will be a three-month moving average to reduce noise.
Table 1. Fed Data, 3-Mo MA, and Monthly Changes for the Fed Funds Rate and CPI
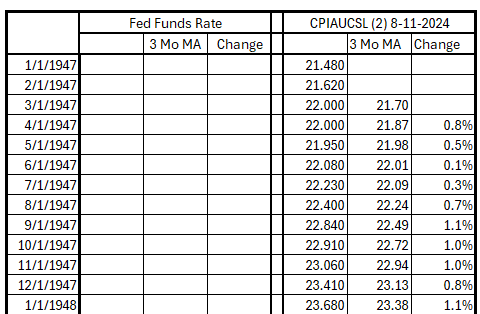
Click on the image for the full table in a .xsls Excel spreadsheet.
A spreadsheet with the year-over-year data is available upon request.
Analysis
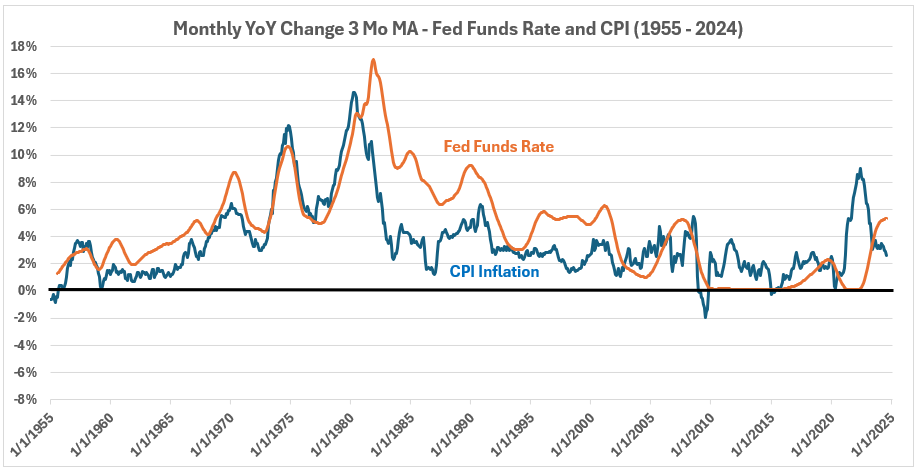
Figure 1 shows the year-over-year changes calculated monthly (using three-month moving averages) for the Fed Funds rate and CPI inflation. Although some coincident changes exist, less correlation is evident by inspection much of the time.
Figure 1. Fed Funds and CPI Monthly YoY Changes (3-Mo MA) – 1955 – 2024
The scatter plot in Figure 2 shows a tendency for the Fed Funds rate to increase when CPI increases from 1955 to 2024. The correlation is moderate: R = 66% and R2 = 44%.
Figure 2. Scatter Diagram for Monthly Changes (3-Mo MA) for Fed Funds vs. CPI (1955 – 2024)
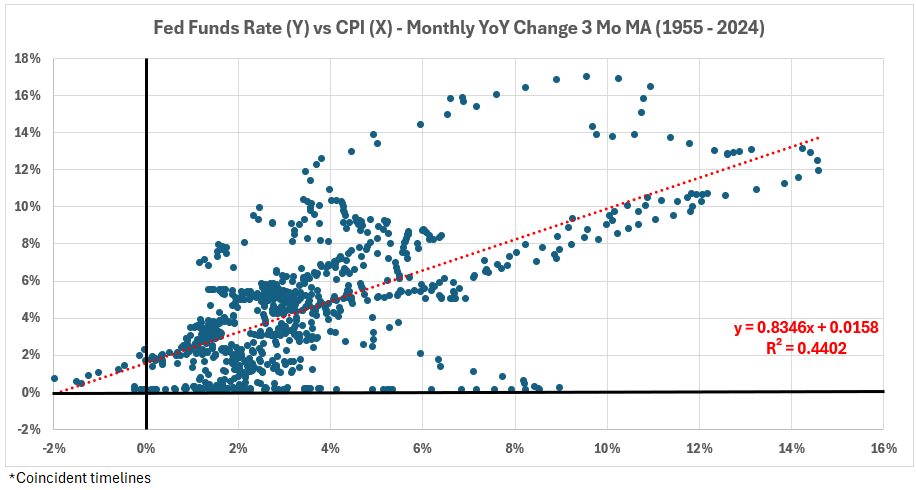
The scatter in Figure 2 is far from the shape expected for a normal data distribution. There are two deviations of note:
- There is an “arc” of data at the top of the graph for very high FFR values. These are associated with Fed Chairman Paul Volcker’s “shock treatment” from 1979 into the early 1980s.
- There are data points at or near 0% for the FFR as CPI rose above 4%, resulting from times when the Fed was “behind the curve” in reacting to inflation.
Inflation
Figure 3 shows twelve-month inflation every month from 1951 to 2024. The results are similar to the previous twelve-month inflation results for quarterly data,6 shown in Figure 4. The inflation time series has periods of inflationary surges and deflationary surges and times when inflation/disinflation/deflation have trends with ≥4% change uninterrupted by countertrend moves >1.5%.
Figure 3. Twelve-Month CPI Inflation Every Month, 1951 – 2024, Three-Month Moving Average Smoothing
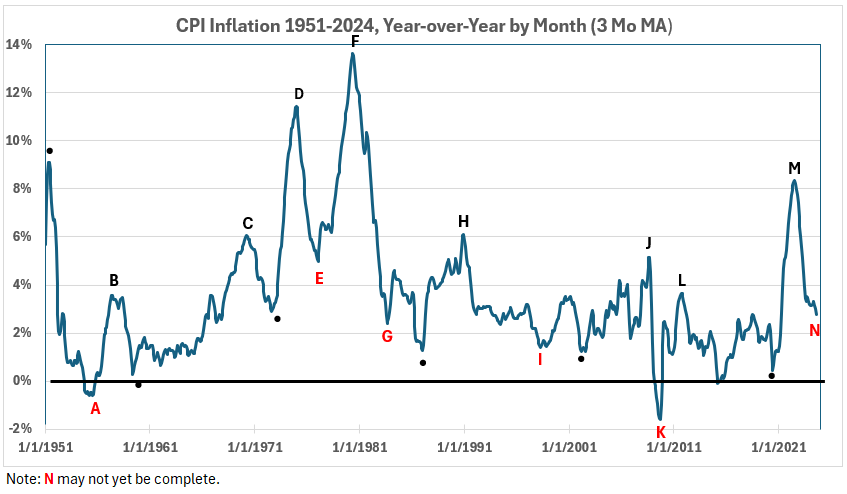
Figure 4 shows the previous quarterly data.
Figure 4. CPI Rolling Four Quarter Inflation 1952-2022 with Significant Changes in Inflation Noted
(Each letter identifies the end of a significant move. An * identifies the end of an insignificant period.)

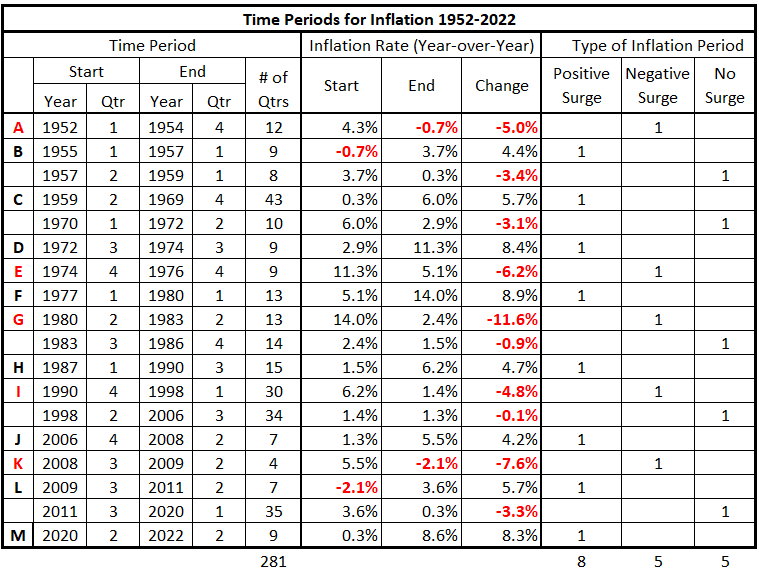
A summary of the data in Figure 4 is in Table 2.
Table 2. Timeline of Quarterly Inflation Data 1952-2022
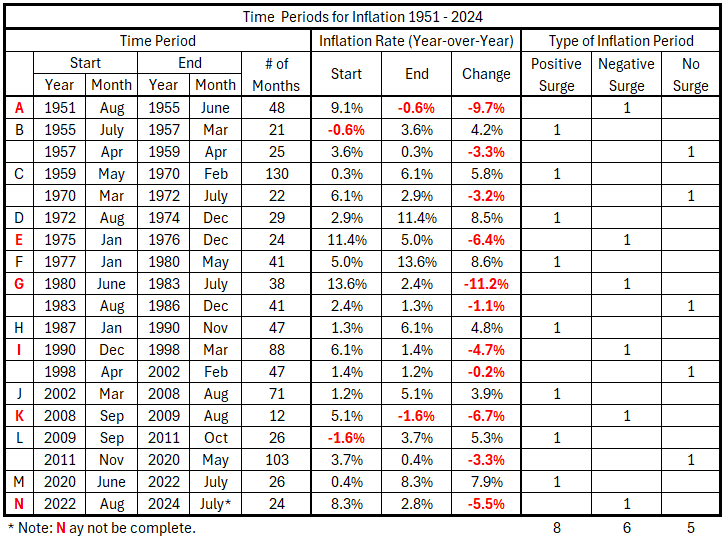
The current monthly data create nearly the same inflation and disinflation surges as the previous quarterly data. The durations are now in months, and there are slight differences in the magnitudes of the changes.
Table 3. Timeline of Monthly Inflation Data 1951-2024
Conclusion
The next step is to set up the monthly data’s timeline offset tables for the Fed Funds rate and CPI. These will differ from the tables used in our other studies in that CPI will be the dependent variable. Previously, we always had CPI as the independent variable.
Footnotes
1. Lounsbury, John, “Federal Funds Rate and Inflation. Part 6.” EconCurrents, November 24, 2024. https://econcurrents.com/2024/11/24/fed-funds-rate-and-inflation-part-6/.
2. Lounsbury, John, Federal Funds Rate and Inflation. Noise.” EconCurrents, December 1, 2024. https://econcurrents.com/2024/12/01/fed-funds-rate-and-inflation-noise/.
3. Lounsbury, John, Federal Funds Rate and Inflation. More About Noise.” EconCurrents, December 8, 2024. https://econcurrents.com/2024/12/08/fed-funds-rate-and-inflation-more-about-noise/
4. Lounsbury, John, “Government Spending and Inflation. Reprise and Summary,” EconCurrents, August 20, 2023. https://econcurrents.com/2023/08/20/government-spending-and-inflation-reprise-and-summary/.
5. Federal Reserve Economic Data, Consumer Price Index for All Urban Consumers: All Items in U.S. City Average, Index 1982-1984=100, Monthly, Not Seasonally Adjusted. Data updated as of August 11, 2024. https://fred.stlouisfed.org/graph/?id=CPIAUCNS.
6. Federal Reserve Economic Data, Federal Funds Effective Rate, Percent, Monthly, Not Seasonally Adjusted. Data downloaded September 18, 2024. https://fred.stlouisfed.org/series/FEDFUNDS.