Here, we examine more closely possible noise in the Fed Funds Rate (FFR) and CPI Inflation data from 1951 to 2024. This examination was started previously.1

Image by Gerd Altmann from Pixabay
Introduction
The 73 years from 1951 to 2024 are divided into three types of inflationary behavior:2
- Significant inflation increases;
- Significant inflation decreases;
- No significant inflation changes.
An inflation change is significant if it is ≥4.0% with no intervening countertrend change >1.5%. Previously, we defined the partitioning of inflation into the pattern in Table 1.
Table 1. Timeline of Inflation Data 1951-2024 (Previously Table 2.2)
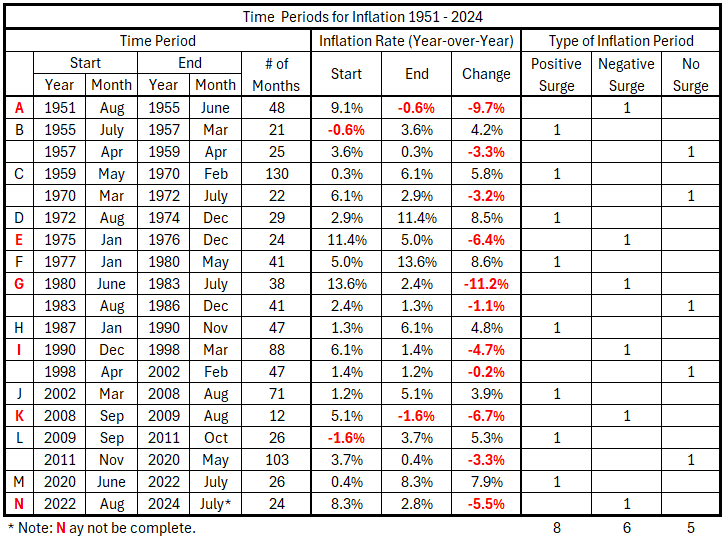
Previously,1 the question was raised but not answered: Is the 3-month moving average (3-Mo MA) the appropriate smoothing of the monthly data for CPI and FFR changes? In this post, we look at how no smoothing, 2-month, 3-month, and 4-month MA reduce apparent noise and how much they might affect meaningful information.
Data
The data is from tables prepared previously and the source references cited.3 There are 49 monthly timeline alignments:
- Fed Funds Rate and CPI Inflation months are coincident.
- Fed Funds Rate leads and lags CPI Inflation by one month (±1 month)
- Fed Funds Rate leads and lags CPI Inflation by two months (±2 months)
- …
- Fed Funds Rate leads and lags CPI Inflation by 24 months (±24 months)
Analysis
We will look at the year-over-year (Y0Y) changes calculated monthly for both CPI and FFR with no smoothing of the monthly data, plus 2-Mo MA, 3-Mo MA, and 4-Mo MA smoothing.
Data Smoothing for CPI Inflation
Figure 1. YoY CPI Inflation Every Month (No Smoothing) 1947 – 2024
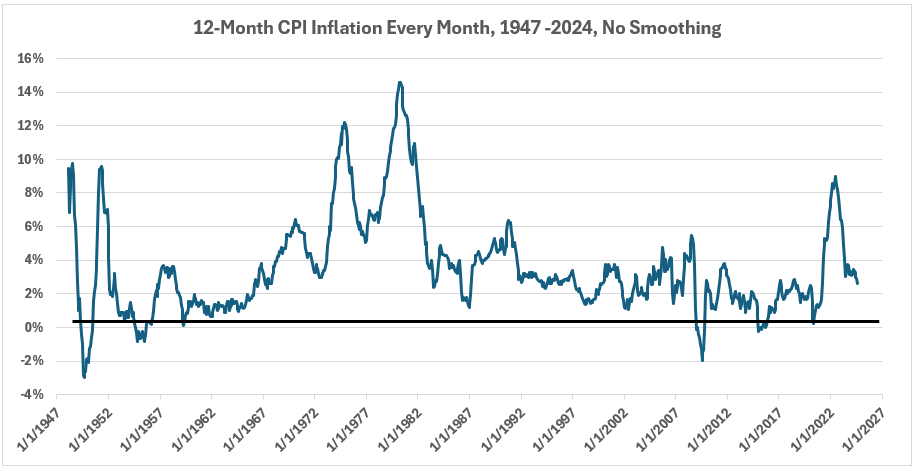
Figure 2. YoY CPI Inflation Every Month (2-Mo MA), 1947 – 2024
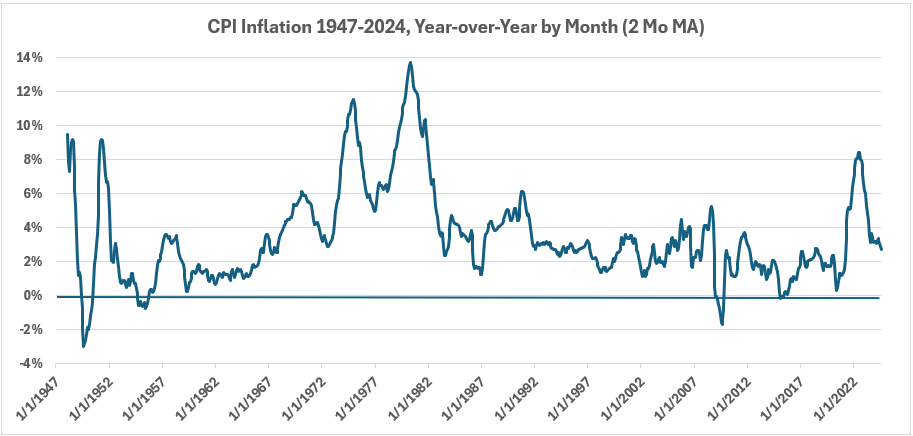
Figure 3. YoY CPI Inflation Every Month (3-Mo MA), 1947 – 2024
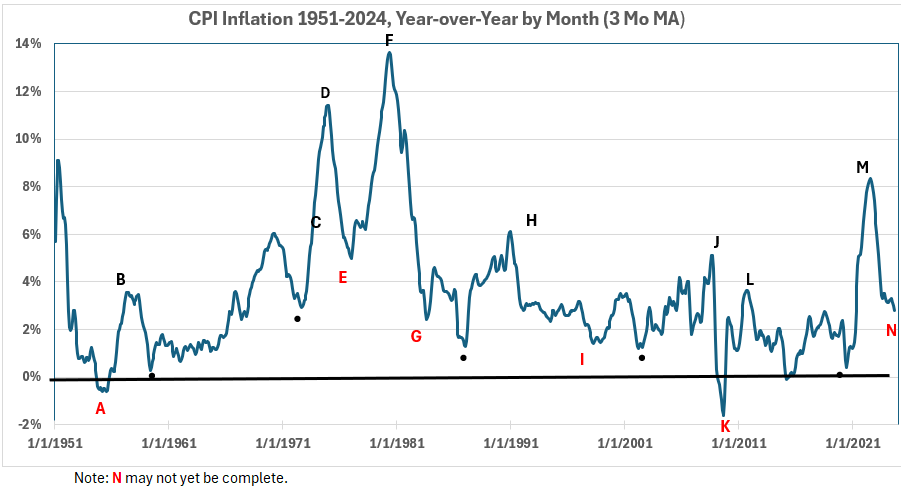
Figure 4. YoY CPI Inflation Every Month (4-Mo MA), 1947 – 2024
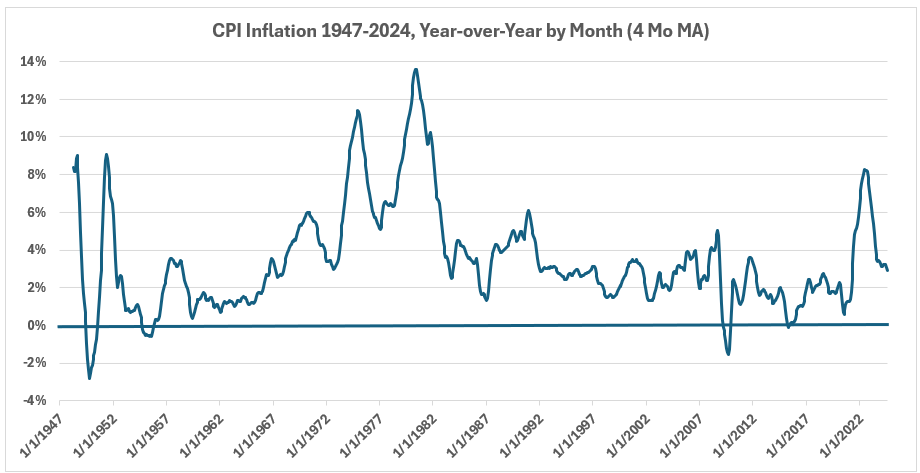
Comparing Figures 1-4, the CPI curve noticeably smooths with each successive monthly data smoothing, without major changes in the peak values after the changes from Figure 1 to Figure 2. Based on these observations, we might consider using a 4-month data smoothing for further analysis.
Data Smoothing for Federal Funds Rate Changes
Figure 5. YoY FFR Changes Every Month (No Smoothing), 1954 – 2024
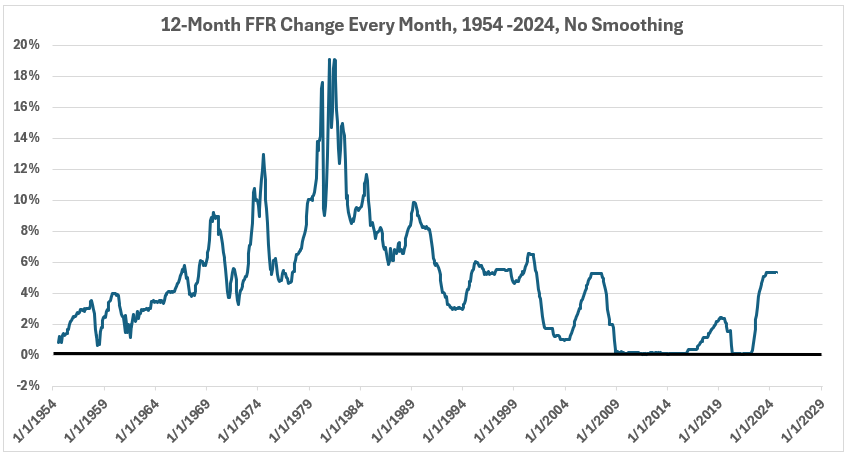
Figure 6. YoY FFR Changes Every Month (2-Mo MA), 1954 – 2024
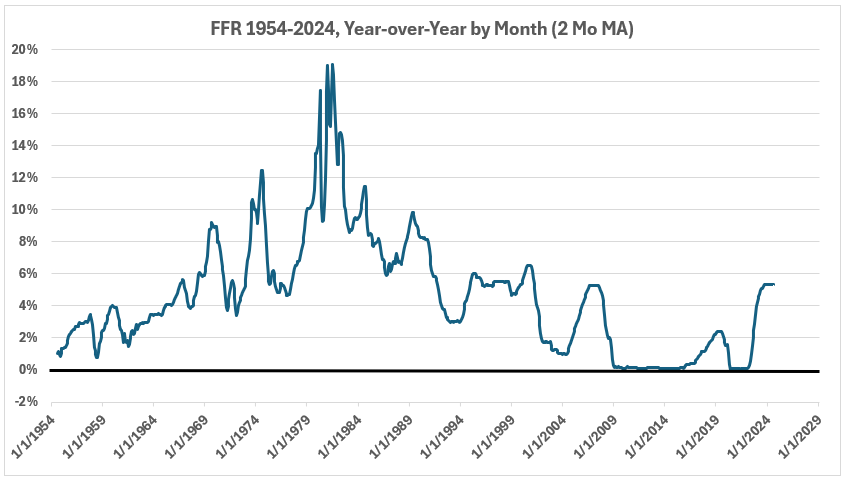
Figure 7. YoY FFR Changes Every Month (3-Mo MA), 1954 – 2024
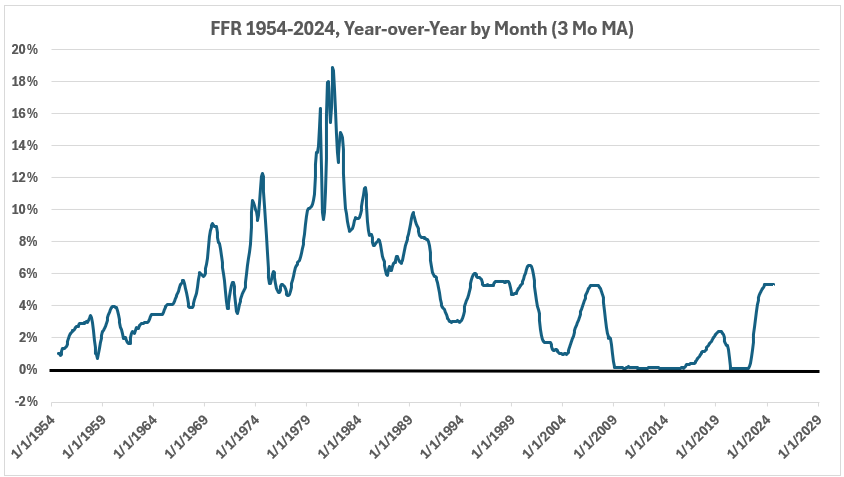
Figure 8. YoY FFR Changes Every Month (4-Mo MA), 1954 – 2024
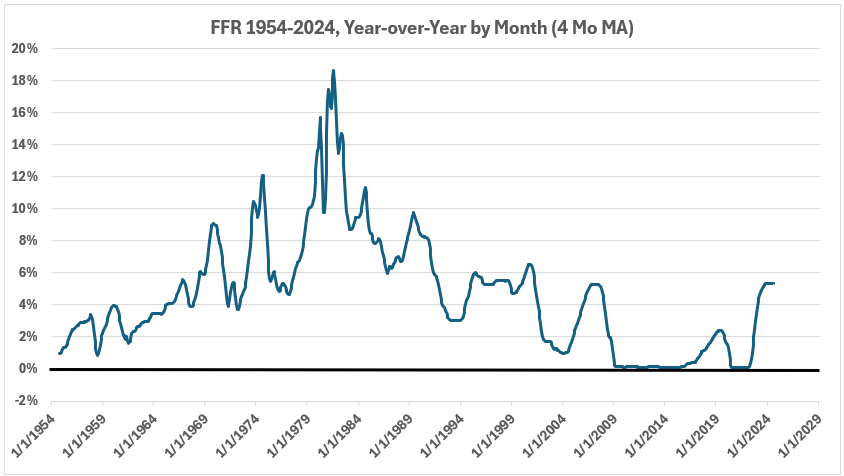
Comparing Figures 5-8, the FFR curve appears to smooth with each successive monthly data smoothing, with no significant changes in the peak values between Figure 5 and Figure 6. However, there are changes between Figure 6 and Figure 7 and again between Figure 7 and Figure 8.
Conclusion
Next week, we will look more closely at the process of using monthly year-over-year changes to evaluate associations between changes in the Fed Funds Rate and CPI inflation.
Footnotes
1. Lounsbury, John, “Fed Funds Rate and Inflation. Noise,” EconCurrents, December 1, 2024. https://econcurrents.com/2024/12/01/fed-funds-rate-and-inflation-noise/.
2. Lounsbury, John, “Fed Funds Rate and Inflation. Part 1 – Corrected,” EconCurrents, October 13, 2024. https://econcurrents.com/2024/10/13/fed-funds-rate-and-inflation-part-1-corrected/.
3. Lounsbury, John, “Fed Funds Rate and Inflation. Part 2 – Corrected,” EconCurrents, October 20, 2024. https://econcurrents.com/2024/10/20/fed-funds-rate-and-inflation-part-2-corrected/.