This post continues the analysis of the Fed Funds Rate’s behavior during the positive inflation surges between 1951 and 2024.2 Specifically, we look at the inflation of the 21st century.
Marriner S. Eccles Federal Reserve Board Building, Wikipedia,
Creative Commons Attribution-Share Alike 3.0 Unported license.
Introduction
The 73 years from 1951 to 2024 are divided into three types of inflationary behavior:1
- Significant inflation increases;
- Significant inflation decreases;
- No significant inflation changes.
An inflation change is significant if it is ≥4.0% with no intervening countertrend change >1.5%.
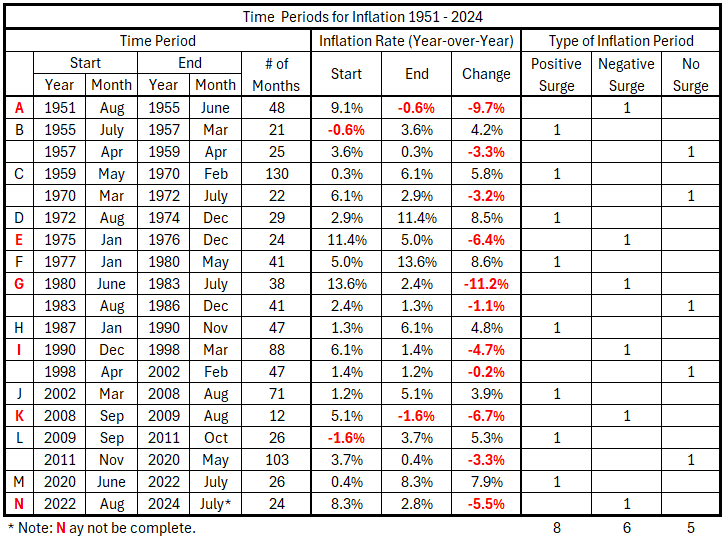
Previously, we defined the partitioning of inflation into the pattern in Table 1.
Table 1. Timeline of Inflation Data 1951-2024 (Previously Table 2.1)
Data
The data is from tables prepared previously.1
There are 49 monthly timeline alignments:
- Fed Funds Rate and CPI Inflation months are coincident.
- Fed Funds Rate leads and lags CPI Inflation by one month (±1 month)
- Fed Funds Rate leads and lags CPI Inflation by two months (±2 months)
- …
- Fed Funds Rate leads and lags CPI Inflation by 24 months (±24 months)
Analysis
Mar 2002 – Aug 2008
There are two things to note about this period of rising inflation:
- The total increase in CPI was 3.9%, which is below the threshold for a surge (4.0%).
- When quarterly data were used to define 12-month inflation changes, there was a much shorter period of surging inflation.3
The shorter period with quarterly data was 4Q 2006 to 2Q 2008, which is contained within the monthly data defined inflation increase (Mar 2002 to Aug 2008). The surge with the quarterly data was 4.3%. For this reason, the 3.9% increase with monthly data is included as an inflation surge.
Figure 1. Fed Funds Rate and Inflation Mar 2002 – Aug 2008
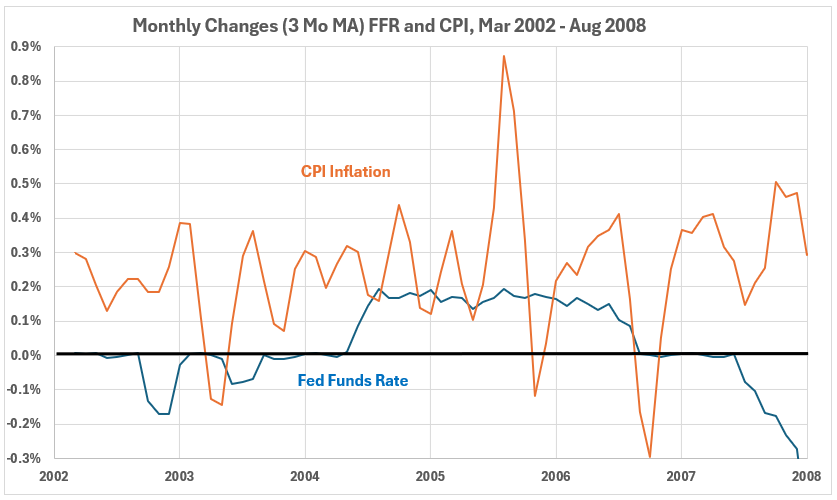
Because quarterly data provide a shorter time window for surging inflation, it seems reasonable to divide the Mar 2002 – Aug 2008 period into two parts. This will be done here using Apr 2005 as the dividing date based on the volatility differences for CPI before and after that date.
Figure 2. Monthly Changes in Fed Funds Rate (x) vs. CPI Inflation (y) Mar 2002 – Aug 2008
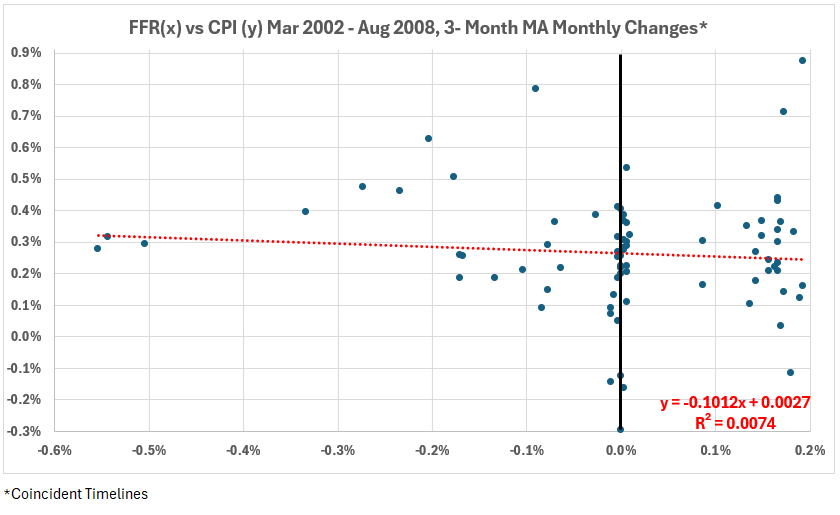
Figure 2 is an ugly distribution, supporting the decision to split the data.
Mar 2002 – Apr 2005
Figure 3. Fed Funds Rate and Inflation Mar 2002 – Apr 2005
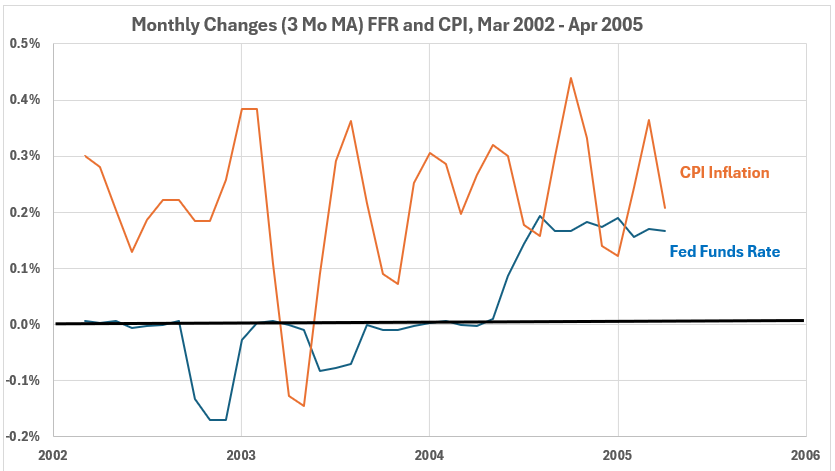
In Figure 3, we see more volatility in CPI for 2003 than for the rest of the period. The FFR changes were essentially zero, with a few negative months until they became positive in the middle of 2004.
Figure 4. Monthly Changes in Fed Funds Rate (x) vs. CPI Inflation (y) Mar 2002 – Apr 2005
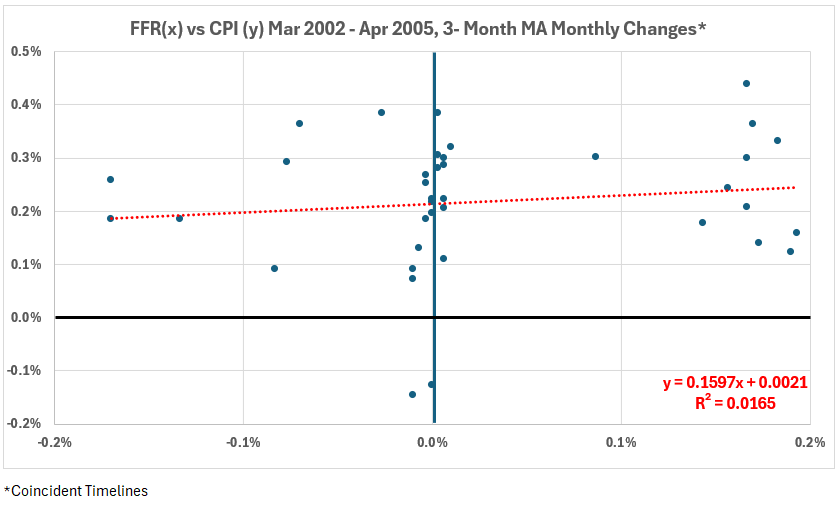
The scatter plot data in Figure 4 is not pretty, with a blob of points on the right side. R = 13% and R2 = 1.7%.
Figure 5. Correlation Between Fed Funds Rate and CPI Inflation Mar 2002 – Apr 2005
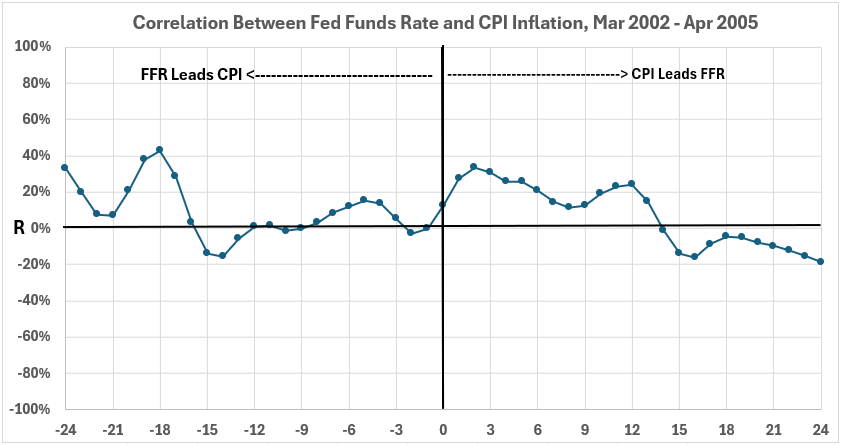
All data points in Figure 5 have R2 < 18%, and most have R2 < 7%. There is a limited association between FFR and CPI here. In this period, there is little indication that changing FFR affected CPI.
Apr 2005 – Aug 2008
Figure 6. Fed Funds Rate and Inflation Apr 2005 – Aug 2008
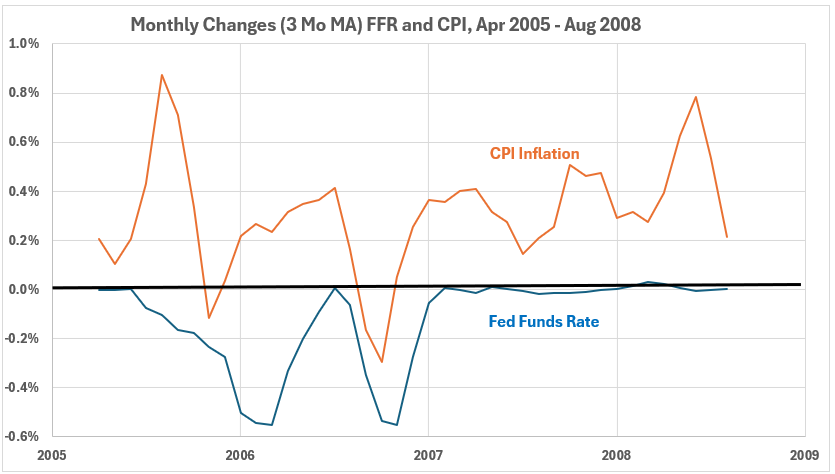
After the middle of 2005, CPI changes were small, positive, and negative. The Fed was cutting rates during this period.
Figure 7. Monthly Changes in Fed Funds Rate (x) vs. CPI Inflation (y) Apr 2005 – Aug 2008
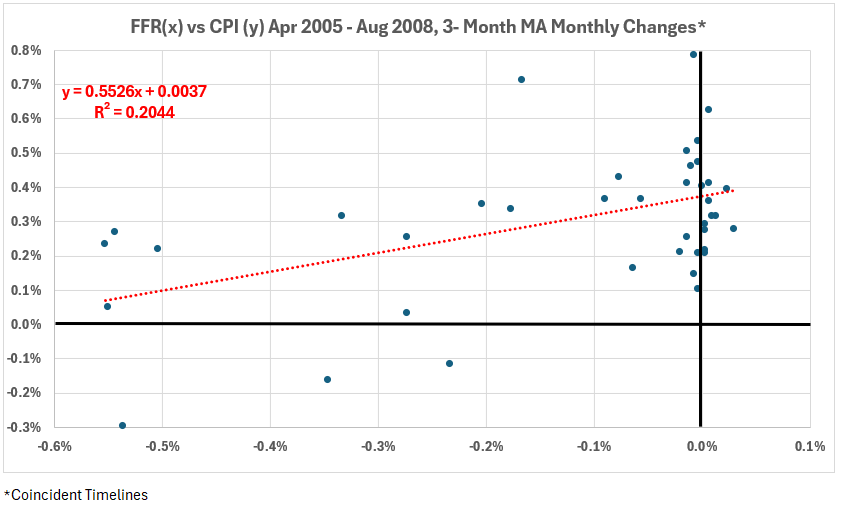
The scatter plot in Figure 7 has an ugly distribution, shaped more like a hammer than the desired football. The coincident timeline data has a weak (but near the boundary with moderate) correlation. R = 45% and R2 = 20%.
Figure 8. Correlation Between Fed Funds Rate and CPI Inflation Apr 2005 – Aug 2008
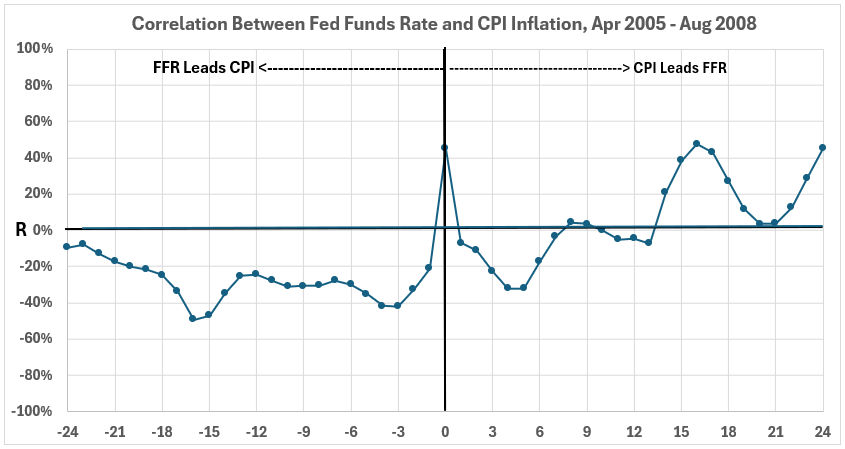
The right side of Figure 8 shows a negative association between FFR and subsequent CPI results. This is what would be expected if increasing FFR caused CPI changes to moderate and decline. However, all R values are weak, with the average R2 around 10%. This means 90% or more of the change in CPI would have come from some other effect than increasing FFR.
Conclusion
The conclusion for inflation from 2002 to 2008 is that Federal Reserve interest rate actions had, at best, a limited effect on changing CPI inflation. We will continue analyzing the most recent inflationary surges next week.
Footnotes
1. Lounsbury, John, “Fed Funds Rate and Inflation. Part 2 – Corrected,” EconCurrents, October 20, 2024. https://econcurrents.com/2024/10/20/fed-funds-rate-and-inflation-part-2-corrected/.
2. Lounsbury, John, “Fed Funds Rate and Inflation. Part 1 – Corrected,” EconCurrents, October 13, 2024. https://econcurrents.com/2024/10/13/fed-funds-rate-and-inflation-part-1-corrected/.
3. Lounsbury, John, “Quantity of Money and Inflation. Part 1. General Considerations,” EconCurrents, July 7, 2024. https://econcurrents.com/2024/07/07/quantity-of-money-and-inflation-part-1-general-considerations/.
