On the third Thursday of the month right on schedule NOAA issued their updated Seasonal Outlook which I describe as their Four-Season Outlook because it extends a bit more than one year into the future. The information released also included the Mid-Month Outlook for the following month plus the weather and drought outlook for the next three months. I present the information issued by NOAA and try to add context to it. It is quite a challenge for NOAA to address the subsequent month, the subsequent three-month period as well as the twelve successive three-month periods for a year or a bit more.
With respect to the long-term part of the Outlook which I call the Four-Season Outlook, there is a fairly rapid transition from El Nino to ENSO Neutral to LaNina. So getting the timing right is very challenging.
First, Let’s Take a Look at the (mid-month) Outlook for March.
It will be updated on the last day of February
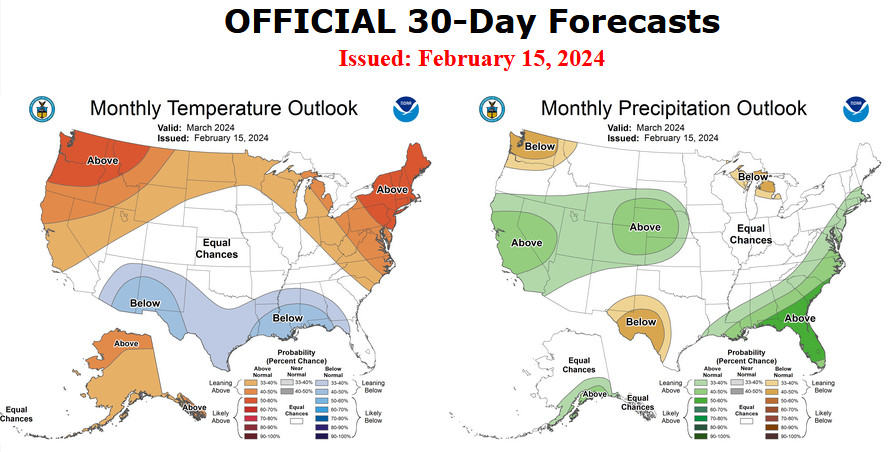
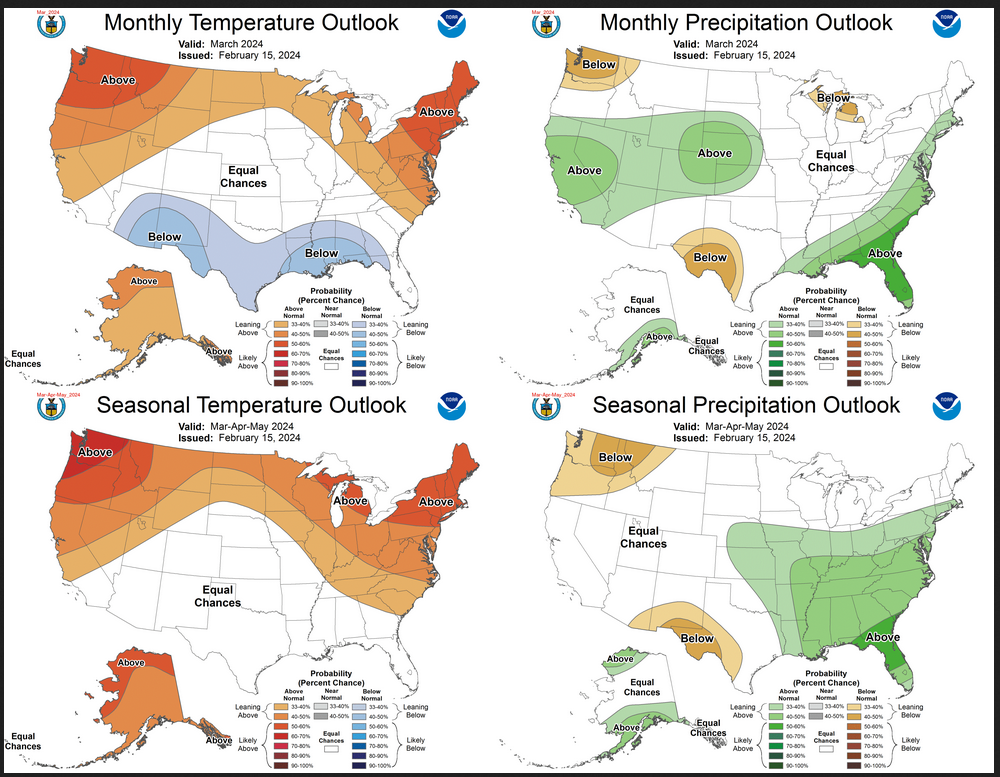
The top row is what is now called the Mid-Month Outlook for next month which will be updated at the end of this month. There is a temperature map and a precipitation map. The second row is a three-month outlook that includes next month. I think the outlook maps are self-explanatory. What is important to remember is that they show deviations from the current definition of normal which is the period 1991 through 2020. So this is not a forecast of the absolute value of temperature or precipitation but the change from what is defined as normal or to use the technical term “climatology”.
| Notice that the Outlook for next month and the three-month Outlook are somewhat different. This tells us that April and May will be different than March to some extent. |

The full NOAA Seasonal Outlook extends through March/April/May of 2025. All of these maps are in the body of the article. Large maps are provided for March and the three-month period Mar/Apr/May. Small maps are provided beyond that through May of 2025 with a link to get larger versions of these maps.
NOAA provides an excellent discussion to support the maps. It is included in the body of this article. In some cases, one will need to click on “read more” to read the full article. For those on my email list where I have sent the url of the article, that will not be necessary.
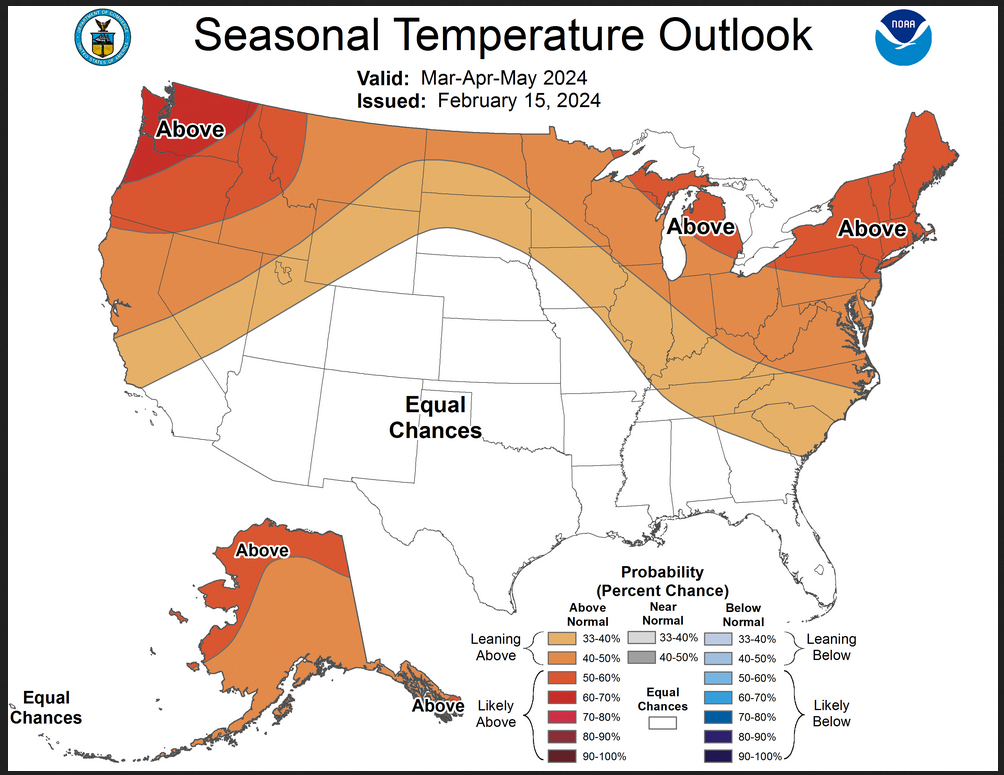
Here are larger versions of the Temperature and Precipitation Outlook maps for next month.
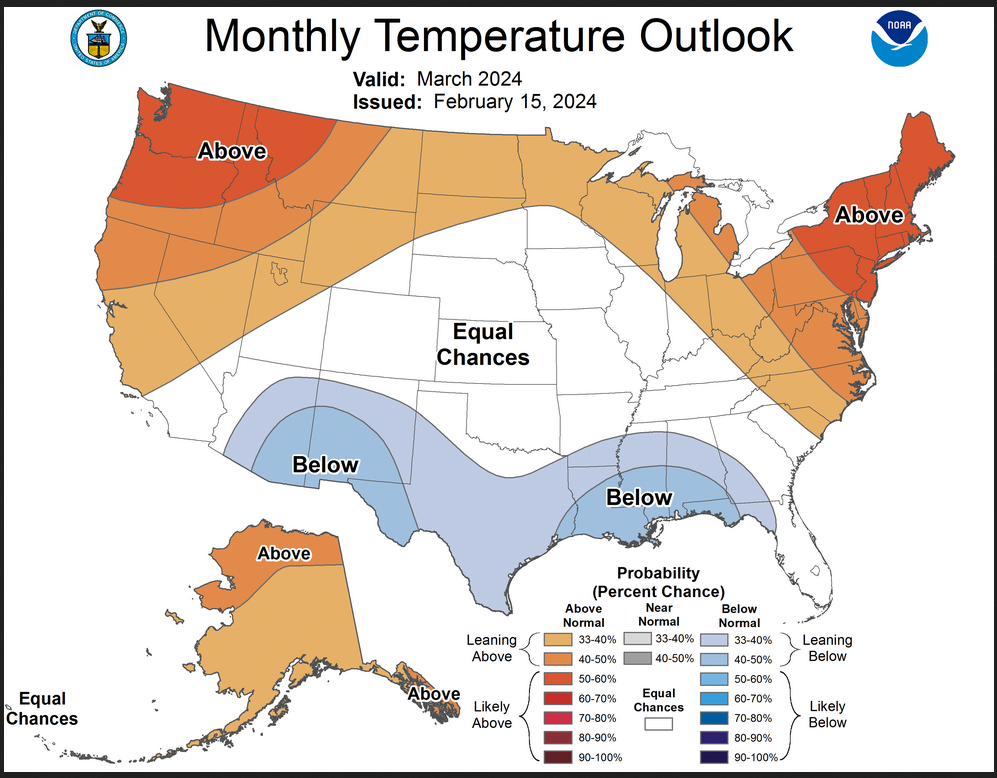
The maps are pretty clear in terms of the outlook.
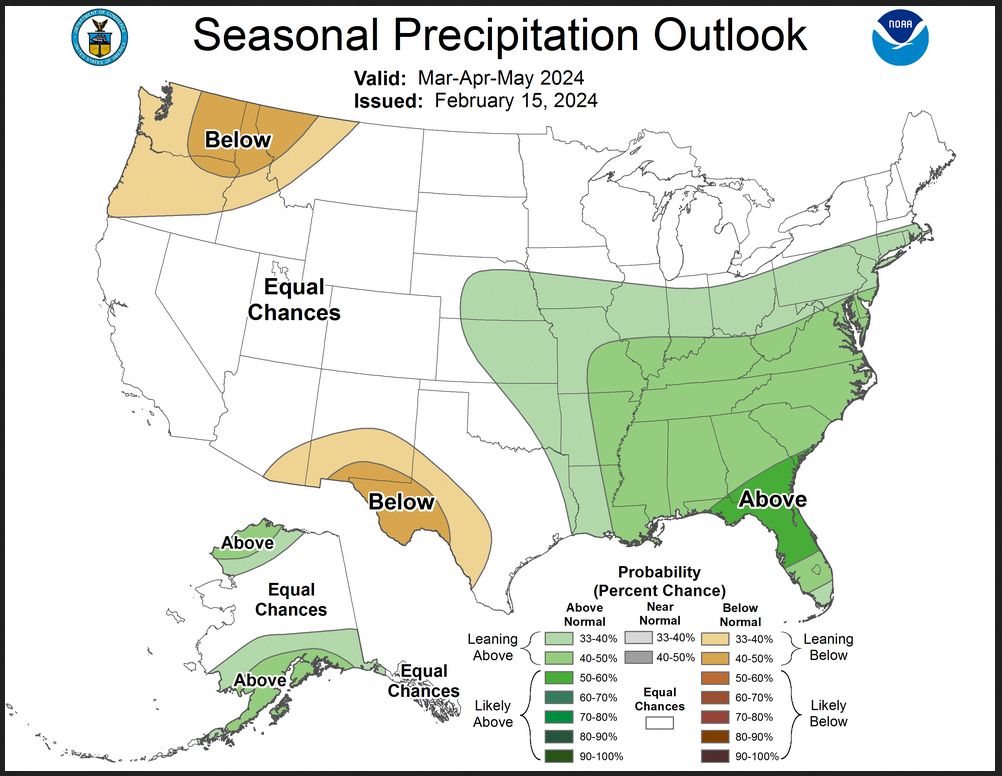
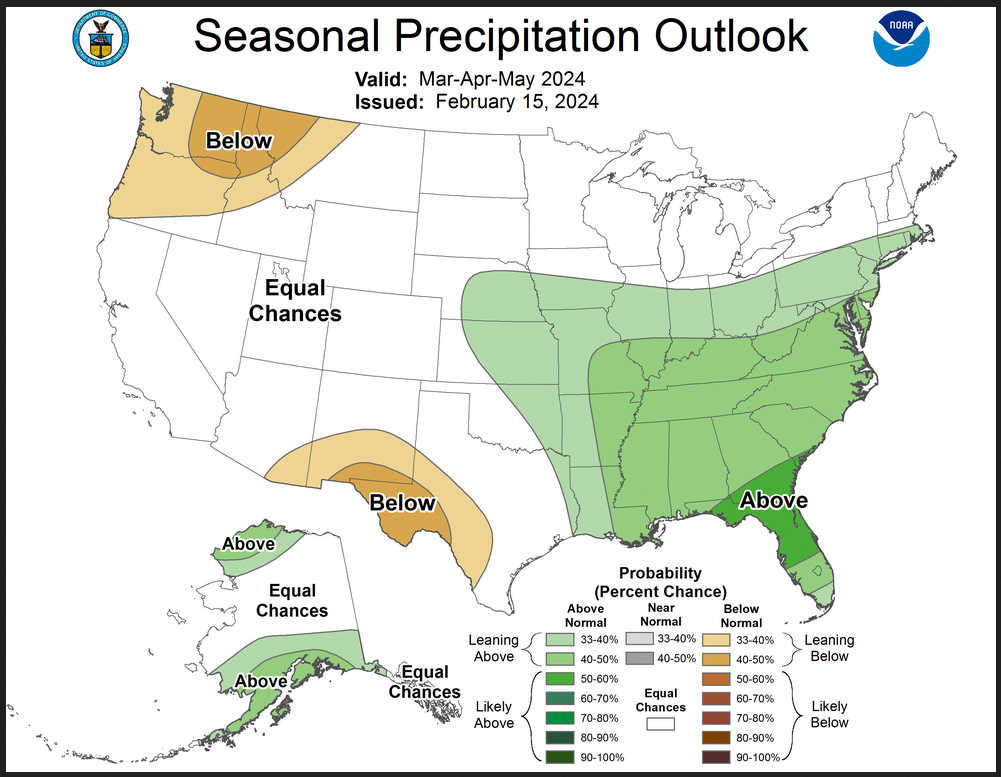
And here are large versions of the three-month MAM 2024 Outlook
First temperature followed by precipitation.
| These maps are larger versions of what was shown earlier. |
Drought Outlook
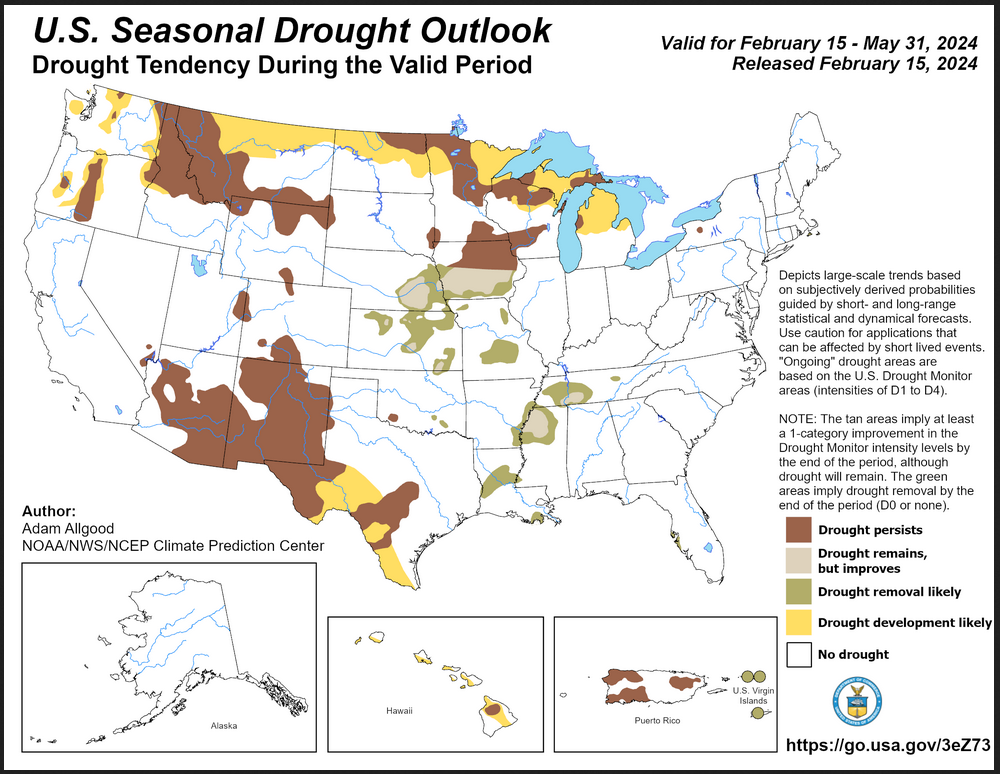
| The yellow is the bad news and there is a substantial amount of that. There is also a fairly large area where drought removal or lessening is likely to happen plus there is a large area where drought is expected to persist. Overall the level of drought is expected to remain about the same. But those living in Arizona and Mexico might have expected more drought relief from a very strong El Nino. Puerto Rico is not happy with this outlook. |
Short CPC Drought Discussion
Latest Seasonal Assessment – During the past month, an active southern stream pattern promoted widespread storminess, which brought significant drought relief to the eastern half of the contiguous U.S. (CONUS). In contrast, a warm pattern along the northern tier attributed in part to the ongoing El Niño largely prevented the development of typical snowpack conditions across the northern Cascades, Rockies, northern Plains, the upper Midwest, and New England. Drought conditions expanded across Wyoming and Montana, despite some periods of precipitation. While atmospheric river events and enhanced Pacific flow brought copious rainfall and flooding to coastal California, snowfall to the Cascades, and some drought relief across the Pacific Northwest, drier and warm conditions promoted some expansion of drought and abnormal dryness to south-central Oregon, northeastern California, and northwestern Nevada.
The Spring months present unique forecast considerations. El Niño conditions are favored to begin waning towards the end of the period, though above-normal temperatures are favored to persist along the northern tier. Moisture from the Gulf of Mexico increasingly penetrates northward over the Midwest and Great Plains, creating opportunities for substantial precipitation events, and the West Coast wet season winds down. Evapotranspiration rates also begin rising as the sun angle increases and vegetation wakes up from winter dormancy. Much of the northern tier is vulnerable to Spring drought development due to the reduced potential for a typical Spring melt given the currently meager snowpack conditions and a warm seasonal outlook reducing the potential for late-season snowpack building. Therefore, some slow drought development is possible across the Cascades and northern Rockies, where snow water equivalent levels are below average. Drought development is also favored for the northern Plains, upper Midwest, and Great Lakes regions along the Canadian border. A similar situation exists across northern New England; however, development is not indicated in this outlook since incipient groundwater and streamflow conditions remain adequate, though any periods of abnormal warmth or dryness during the Spring could hasten drought development. Drought development is also favored for western and southern Texas, where antecedent conditions are already dry and the seasonal precipitation outlook favors below-average precipitation. Elsewhere, a wet Spring pattern fueled by the waning El Niño favors continued drought reductions for portions of the Great Plains, western Corn Belt, the Mississippi Delta region, and the Tennessee Valley.
The broader ENSO suppressed precipitation signal across Hawaii was offset by a series of Kona Low events that reduced drought coverage. Below-average precipitation remains favored through the Spring months, which may promote slow drought expansion across portions of the Big Island that are already abnormally dry. No drought is currently in place or expected to develop across Alaska. Drought conditions have slowly expanded across Puerto Rico, though storminess reduced drought coverage across the US Virgin Islands. Given the fairly dry time of year and waning El Niño conditions, drought persistence is the most likely outcome.
Looking out Four Seasons.
Twelve Temperature Maps. These are overlapping three-month maps (larger versions of these and other maps can be accessed HERE)
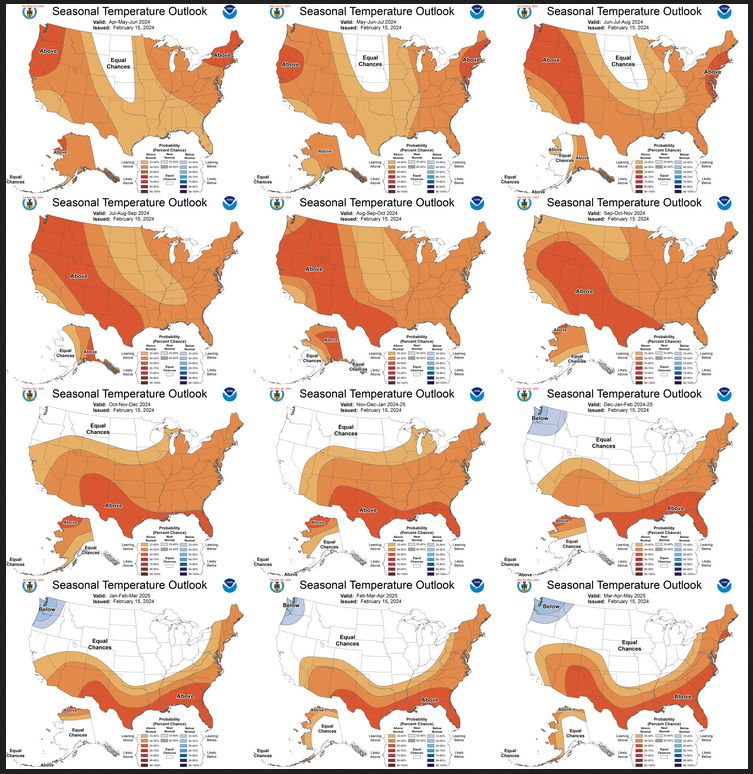
Notice that this presentation starts with March/April/May 2024 (MAM) since JFM is considered the near-term and is covered earlier in the presentation. The changes over time are generally discussed in the discussion but you can see the changes easier in the maps.
Comparing the new outlook with the prior Outlook,
The 12 temperature maps were issued last month.
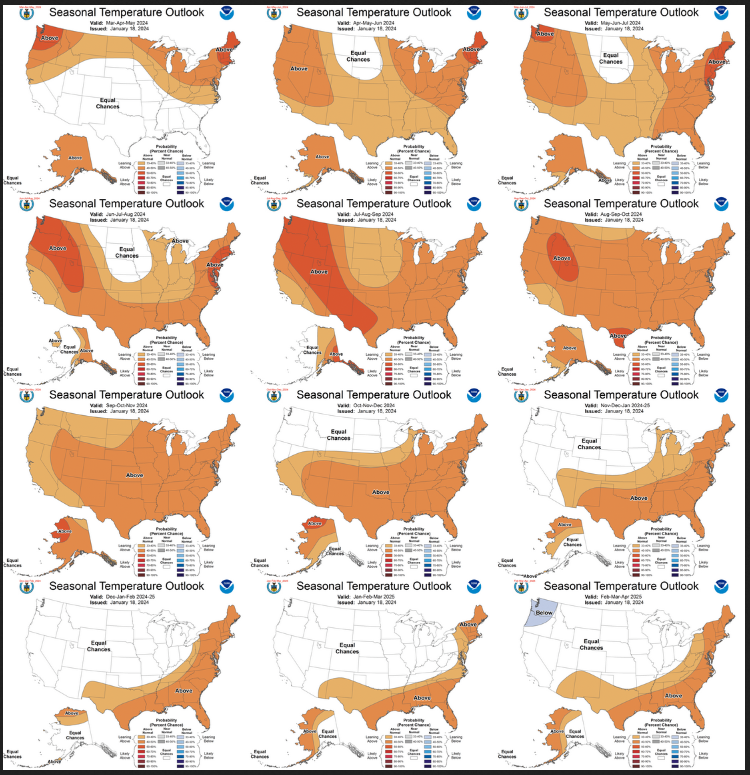
The easiest way to do the comparison is to print out both maps. If you have a color printer that is great but not needed. What I do is number the images from last month 1 – 12 starting with “1” and going left to right and then dropping down one row. Then for the new set of images, I number them 2 – 13. That is because one image from last month in the upper left is now discarded and a new image on the lower right is added. Once you get used to it, it is not difficult. In theory, the changes are discussed in the NOAA discussion but I usually find more changes. It is not necessarily important. I try to identify the changes but believe it would make this article overly long to enumerate them. The information is here for anyone who wishes to examine the changes. I comment below on some of the changes from the prior report by NOAA and important changes over time in the pattern.
| It is difficult to identify the changes in the temperature pattern because most of the changes are changes in the likelihood of it being warmer than climatology but next winter seems to have somewhat more significant changes |
Now the Twelve New Precipitation Maps
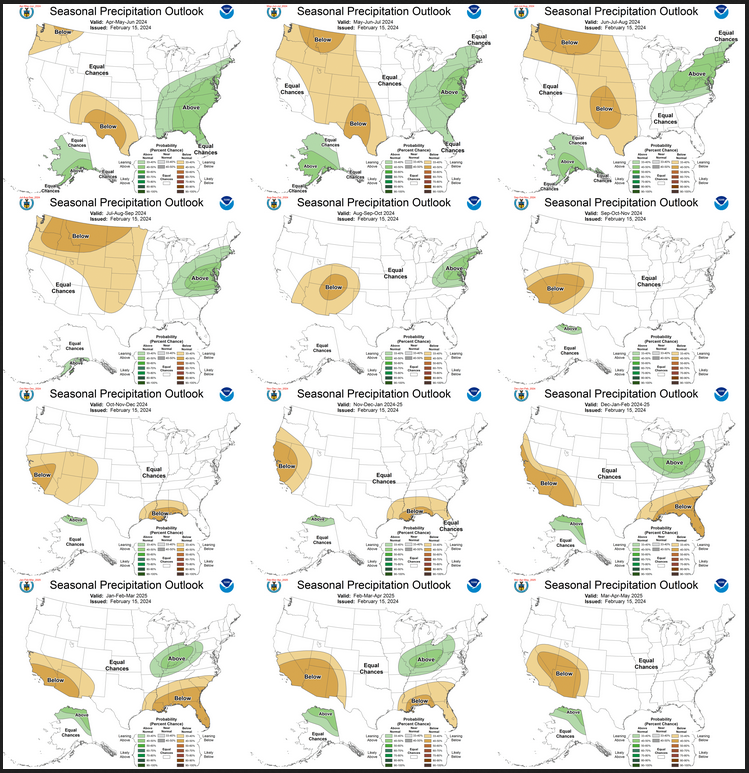
Similar to Temperature in terms of the organization of the twelve overlapping three-month outlooks.
Comparing the new outlook with the prior Outlook,
The maps that were released last month.
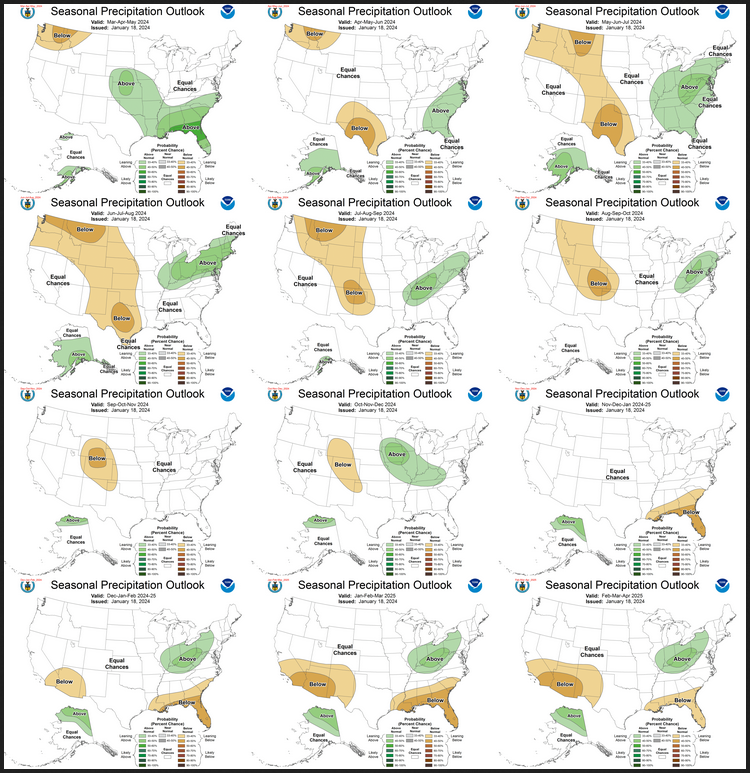
A good approach for doing this comparison is provided with the temperature discussion.
| The most significant changes are for this coming winter. |
NOAA Discussion
Maps tell a story but to really understand what is going you need to read the discussion. I combine the 30-day discussion with the long-term discussion and rearrange it a bit and add a few additional titles (where they are not all caps the titles are my additions). Readers may also wish to take a look at the article we published last week on the NOAA ENSO forecast. That can be accessed here.
I will use bold type to highlight some especially important things. All section headings are in bold type; my comments, if any, are enclosed in brackets [ ].
CURRENT ATMOSPHERIC AND OCEANIC CONDITIONS
Above-average SSTs persist across the equatorial central and eastern Pacific Ocean, with a slight weakening of positive anomalies over the east-central Pacific in recent weeks. The most recent weekly SST anomaly for the Niño 3.4 region is at +1.7 degrees Celsius. Equatorial subsurface temperature anomalies (averaged over 180-100W longitude and 0-300 meters depth) are near zero degrees Celsius after a decrease from a peak of +1.5 degrees Celsius in late November. Negative subsurface temperature anomalies at depths greater than 50 meters have spread from the Western Pacific eastward across the east-central Pacific in recent weeks. In the latest four-week period, outgoing longwave radiation (OLR) anomalies at the top of the atmosphere are negative to the west of the Date Line near the equator and extend over the Eastern Pacific to the north of the equator. Low-level (850-hPa) wind anomalies were near long-term averages over most of the equatorial Pacific in recent weeks. Upper-level (200-hPa) wind anomalies were easterly over the eastern equatorial Pacific. These atmospheric and oceanic conditions reflect a continuation of El Niño into the current month. The Madden-Julian Oscillation (MJO) continues to propagate with active convection across the Western Pacific ocean, constructively interfering with El Niño. However, dynamical model forecasts indicate large uncertainties in the Realtime Multivariate MJO (RMM) index and a likely decrease in the amplitude of the MJO in the coming weeks.
PROGNOSTIC DISCUSSION OF SST FORECASTS
The CPC SST consolidation forecast for the Niño 3.4 region predicts rapidly decreasing positive anomalies in spring with a near zero median anomaly by the April-May-June (AMJ) season. Dynamical and statistical models are in good agreement that a transition to ENSO-neutral conditions is likely to occur either in spring or by early summer. The CPC ENSO Outlook indicates that the probability of ENSO-neutral during AMJ is nearly 80 percent. The probability of a La Niña increases to greater than 50 percent beginning in the June-July-August (JJA) summer season. By the August-September-October (ASO) three-month period and later into autumn, there is more than a 70 percent chance of La Niña.
30-DAY OUTLOOK DISCUSSION FOR MARCH 2024
A number of climate factors are considered in preparing the March 2024 temperature and precipitation outlooks. In addition to the ongoing, albeit weakening El Nino, an ongoing MJO event continues. To further complicate matters, there are indications of a weakening in the stratospheric polar vortex potentially leading to a Sudden Stratospheric Warming (SSW) sometime during the second half of February. Moreover, El Nino wintertime residual impacts are also considered in developing the outlook.
Even though El Nino oceanic conditions have peaked – SSTs are decreasing and oceanic heat content along the equator with depth in the Pacific basin has decreased considerably, the induced atmospheric response can often linger and so common El Nino impacts are likely to continue at times through March and potentially into April. So the March 2024 temperature and precipitation outlooks continued to consider El Nino as part of the large scale base state and so potential impacts.
The MJO has been quite active the last several weeks, but its current coherency is being impacted by multiple modes of both subseasonal [i.e., atmospheric Kelvin waves and Equatorial Rossby waves (KW/ERW)] and inter-annual forcing (i.e. ENSO). With this the case, some standard realtime metrics of the MJO amplitude and phase are disturbed and at times less clear when monitoring. But given recent Pacific Ocean jet strength and extensions and monitoring the circulation only portion of the signal (e.g., 200-hPa velocity potential) it appears the MJO remains active and has entered and is crossing western Hemisphere. Model predictions of the RMM index, vary highly, but most generally favor continue eastward propagation of a signal across Africa back towards the Indian Ocean over the next couple of weeks. If this becomes the case and enhanced convection redevelops in the eastern Indian Ocean and Maritime Continent, ridging and above-normal temperatures for the eastern half of the CONUS would tend to be favored. Weak signals or troughing would be most likely at modest odds across the western CONUS.
Recent monitoring of the stratosphere and model predictions of the 10-hPa zonal wind indicate a potential for a SSW and potential coupling with the troposphere and a tendency to favor a negative AO for periods during the month of March. However, there remains high uncertainty in the eventual evolution after any SSW event and so follow on -AO potential. Even with a SSW event, there always remains considerable variability in how the vortex is impacted (i.e. displaced vortex vs. a split vortex) and the hemisphere (eastern vs. western) where the odds are the greatest for more frequent Arctic air outbreaks during March.
In mid-February, substantial snow deficits are evident from the northern High Plains eastward to the Great Lakes and Northeast – common after El Nino winters. Increased wetness and snowpack has developed in recent weeks for portions of the western CONUS primarily in California, Nevada, and the central and southern Rockies as a result of active Pacific storminess.
Temperature
Weighing all these factors, the March 2024 temperature outlook favors above-normal temperatures for much of the Far West, Pacific Northwest eastward across the northern Plains, Great Lakes and for much of the eastern CONUS. El Nino and negative snow departures support the forecast for much of this highlighted area. Potential MJO influence supports the extension of favored above-normal warmth for the eastern third of the CONUS. Lower odds for above-normal temperatures in the northern Plains and western Great Lakes, large area of Equal-Chances (EC) in the interior of the CONUS and slightly favored below-normal temperatures for parts of the Southeast and Texas are in deference to potential influence from negative AO periods. Elevated odds for above-normal precipitation also contributes slightly to the below-normal temperature forecast in this region. Potential troughing associated with the MJO and elevated chances for above-normal precipitation in some areas support a slight tilt toward below-normal temperatures for parts of the Southwest. Above-normal temperatures are most likely for the entire state of Alaska.
Precipitation
For precipitation, El Nino background conditions and potential MJO influence at times in March, favor above-normal monthly total precipitation amounts from California eastward across the central Rockies to the north-central Plains. Dynamical model guidance (NMME, C3S) and long term positive precipitation trends also support this forecast. El Nino considerations and dynamical model guidance support elevated odds for above-normal precipitation for the Gulf Coast, the Southeast and much of the eastern seaboard as well as smaller regions of favored below-normal precipitation for parts of the Pacific Northwest and central Great Lakes. The majority of dynamical model guidance favored below-normal monthly precipitation amounts for southern Texas. For Alaska, above-normal precipitation is most likely for most of the southern portion of the state.
SUMMARY OF THE OUTLOOK FOR NON-TECHNICAL USERS
While El Niño conditions continue with equatorial sea surface temperatures (SSTs) above average across the central and eastern equatorial Pacific Ocean, the total subsurface ocean heat content anomaly across the equatorial Pacific has dropped to near zero, signaling an imminent transition to ENSO-neutral conditions. The atmospheric circulation across the global tropics is consistent with the ongoing El Niño though, and El Niño is forecast to impact the circulation for the March-April-May season with a transition to ENSO-neutral conditions later in the spring and early summer. La Niña conditions are forecast to likely develop later in summer or by autumn.
Temperature
The March-April-May (MAM) 2024 temperature outlook favors above-normal temperatures across the northwestern Contiguous United States (CONUS), including the Pacific Northwest, northern to central California, parts of the Great Basin, and the northern Rockies. Above-normal temperatures are favored across the northern CONUS, including the northern Great Plains, Great Lakes region, and Northeast. The highest forecast confidence for above-normal temperatures is for the Pacific Northwest, where the probabilities of above-normal temperatures exceed 60 percent. Above-normal temperatures are favored across Alaska. Equal chances (EC) of above-, near- or below-normal seasonal mean temperatures are indicated across the southern CONUS, where El Niño impacts increase the chances of below- and near-normal temperatures, while decadal time scale trends increase the likelihood of above-normal temperatures.
Precipitation
The MAM 2024 precipitation outlook favors below-normal precipitation for parts of the Pacific Northwest and northern Rockies, while above-normal precipitation is favored from the eastern Central Plains across the middle and lower Mississippi Valley into the mid-Atlantic and Southeast, associated with lingering impacts due to El Niño. Above-normal precipitation is also favored for parts of northwestern and southern Mainland Alaska. Below-normal precipitation is favored for much of the Rio Grande Valley. EC of below-, near-and above-normal total seasonal precipitation are depicted by remaining areas in white.
BASIS AND SUMMARY OF THE CURRENT LONG-LEAD OUTLOOKS
PROGNOSTIC TOOLS USED FOR U.S. TEMPERATURE AND PRECIPITATION OUTLOOKS
The seasonal temperature and precipitation outlooks for MAM 2024 through MAM 2025 were based on dynamical model guidance through the first five leads, including the North American Multi-Model Ensemble (NMME). Statistical models, such as the ENSO-OCN tool that combines the probable temperature and precipitation impacts of the predicted median Nino 3.4 SST anomaly, as forecast by the CPC SST consolidation, with the decadal temperature and precipitation trends, were used at all leads. A skill-weighted consolidation of NMME dynamical models, a consolidation of statistical models, as well as a full consolidation of all available models were primary tools in the seasonal temperature and precipitation outlooks. El Niño impacts were considered explicitly, using regression of the Niño 3.4 index on temperature and precipitation, for only the MAM 2024 outlook. Beginning in ASO 2024 through the final lead outlook for MAM 2025, the impacts of La Niña were considered, using temperature and precipitation signals from regression to negative values of the Niño 3.4 index.
PROGNOSTIC DISCUSSION OF OUTLOOKS – MAM 2024 TO MAM 2025
TEMPERATURE
The MAM 2024 temperature outlook predicts elevated probabilities of above-normal temperatures for Alaska and across the northern tier of the CONUS, supported by NMME forecasts, forecast tool consolidations, and typical impacts due to El Niño. The highest probabilities for above-normal cover northwestern parts of Oregon and much of Washington, where the teleconnection to El Niño has its strongest correlation. Weaker probabilities still favoring above-normal temperatures are forecast over the Northern Plains, due to uncertainty in the Arctic Oscillation (AO) phase. A persistent negative phase of the AO would lead to near- or below-normal temperatures in this region. Above-normal temperatures are likely for much of the Great Lakes region and Northeast with probabilities exceeding 50 percent, where the Great Lake surface temperatures are anomalously warm and decadal trends in the Northeast are strongly positive. As a rapid transition to a neutral ENSO state is predicted, the seasonal temperature outlooks for AMJ through JJA 2024 rely primarily on signals related to decadal trends. The outlooks are supported by the NMME forecasts through July-August-September (JAS) 2024 and by the consolidation of available tools through ASO 2024. Uncertainty for the northern and central Great Plains increases through spring into summer where decadal trends are weaker, while higher probabilities for likely above-normal temperatures expand across the western CONUS. Above-normal temperatures are favored across most of Alaska through MJJ 2024, and primarily eastern Mainland Alaska in the summer seasons. By the autumn and the September-October-November (SON) 2024 outlook, probabilities for above-normal temperatures decrease for the northwestern and north-central CONUS, while elevated probabilities for above-normal temperatures increase for northern Mainland Alaska and decrease for southern Mainland Alaska, related to potential impacts of a developing La Niña. For the CONUS, areas forecast to have EC of below-, near- and above-normal temperatures expand from the Northwest in October-November-December (OND) 2024 down the west coast by December-January-February (DJF) 2024/25. Below-normal temperatures are slightly favored for parts of the Pacific Northwest for the DJF 2024/25 season through MAM 2025, due to the more likely impacts of La Niña. Forecasted areas of EC expand into the Central Plains, Central Mississippi Valley, and Ohio Valley in the winter season and later leads through MAM 2025. These longer lead forecasts are supported largely by the ENSO-OCN forecast tool and the statistical model consolidation.
PRECIPITATION
The MAM 2024 precipitation outlook favors below-normal precipitation for the Pacific Northwest, consistent with possible impacts of El Niño during the first half of the season. Below-normal precipitation is favored for much of the Rio Grande Valley, while above-normal precipitation is favored for much of the eastern CONUS, supported by the consolidation of available forecast tools. Above-normal precipitation is favored for northwestern and southern Mainland Alaska, consistent with the NMME consolidation forecast. Through spring into summer, an area of favored above-normal precipitation expands across most of Mainland Alaska, largely supported by the NMME and the consolidation of precipitation forecast tools. Below-normal precipitation is slightly favored across much of the western half of the CONUS (excluding most of California and western areas of the Great Basin and Southwest) through JJA 2024, supported by the NMME and the consolidation. The areas where above-normal precipitation is favored over the eastern CONUS shift eastward towards the Atlantic coast by MJJ 2024, and then are confined to parts of the northeastern CONUS by summer, largely consistent with signals related to decadal precipitation trends. Below-normal precipitation is favored for parts of the Southwest from ASO 2024 through MAM 2025, and for parts of the Southeast from OND 2024 through MAM 2025. Above-normal precipitation is favored for parts of northern Alaska in the autumn seasons and for northern and eastern interior Alaska in the winter through MAM 2025, consistent with the statistical model consolidation. Above-normal precipitation is favored over parts of the Midwest during the winter seasons. The precipitation outlooks for autumn through winter are largely related to potential impacts due to likely development of La Niña.
The key piece of information used by NOAA follows.
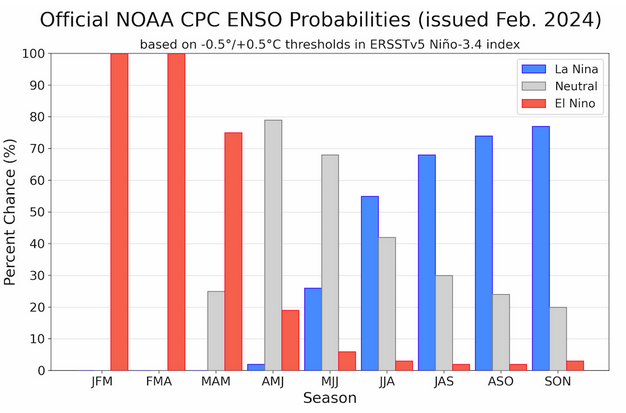
| It looks like El Nino early in the forecast period. It does start to begin to reduce the intensity in MAM2024. There is increasing confidence that this El Nino will weaken in the Spring into the summer which is shown here as the probabilities of El Nino rapidly converge with the probabilities of ENSO Neutral and then La Nina in the later part of the forecast period. The above graphic does not extend into the future as far as the outlooks presented in this article. That can be confusing. |
Resources
–
| I hope you found this article interesting and useful. |
–