On the second Thursday of every month, NOAA (really their Climate Prediction Center CPC) issues its analysis of the status of ENSO. This includes determining the Alert System Status. NOAA again describes their conclusion as “ENSO Alert System Status: El Nino Advisory”
There is not much doubt that we have an El Nino. How long it lasts and its strength remains to be seen. NOAA may be more conservative compared to some other Weather Advisory Organizations. That is concerning as some of the other Weather Advisory Organizations are predicting a higher probability for a “Historically Strong” El Nino.
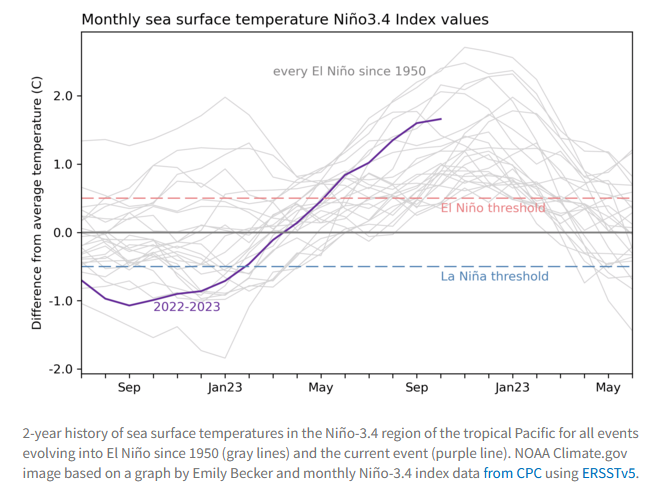
We have included a link to an interesting ENSO Blog article by Emily Becker and a link to a fairly comprehensive article we wrote on El Nino back in September. We have included some of the key graphics from both the Emily Becker Blog Post and the earlier article that I wrote and for those who have a strong interest in this El Nino winter, I recommend that you utilize the links to read both articles.

CLIMATE PREDICTION CENTER ENSO DISCUSSION
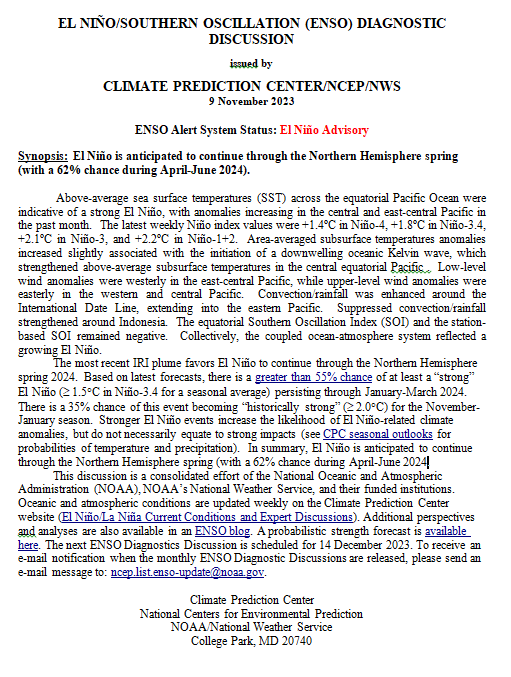
| The second paragraph is what is important:
” The most recent IRI plume favors El Niño to continue through the Northern Hemisphere spring 2024. Based on latest forecasts, there is a greater than 55% chance of at least a “strong” El Niño (³ 1.5°C in Niño-3.4 for a seasonal average) persisting through January-March 2024. There is a 35% chance of this event becoming “historically strong” (³ 2.0°C) for the November-January season. Stronger El Niño events increase the likelihood of El Niño-related climate anomalies, but do not necessarily equate to strong impacts (see CPC seasonal outlooks for probabilities of temperature and precipitation). In summary, El Niño is anticipated to continue through the Northern Hemisphere spring (with a 62% chance during April-June 2024.” Below is the middle paragraph from the discussion last month. We see that this month there is a substantial chance of a “historically strong” event. “The most recent IRI plume favors El Niño to continue through the Northern Hemisphere spring 2024. Also considering recent observations and the NMME, the team favors at least a “strong” event with a 75-85% chance through November-January (≥1.5C for the seasonal average in Niño-3.4). There is a 3 in 10 chance of a “historically strong” event that rivals 2015-16 and 1997-98 (seasonal average ≥ 2.0C). Stronger El Niño events increase the likelihood of El Niño-related climate anomalies, but do not necessarily equate to strong impacts locally. Consider consulting CPC seasonal outlooks for probabilities of temperature and precipitation in the coming seasons. In summary, El Niño is anticipated to continue through the Northern Hemisphere spring (with an 80% chance during March-May 2024).” |
We now provide additional detail but I am keeping this article shorter than usual because nothing much has changed since last month.
CPC Probability Distribution
Here are the new forecast probabilities. The probabilities are for three-month periods e.g. OND stands for October/November/December.
Here is the current release of the probabilities:

| You can clearly see the forecast does not extend beyond MJJ 2024 and one does see a tail-off in the probabilities for El Nino conditions in the Eastern Pacific after the winter season. |
Here is the forecast from late last month.

| The analysis this month and last month are pretty similar. |
What Does the NOAA Proprietary ENSO Model Forecast?
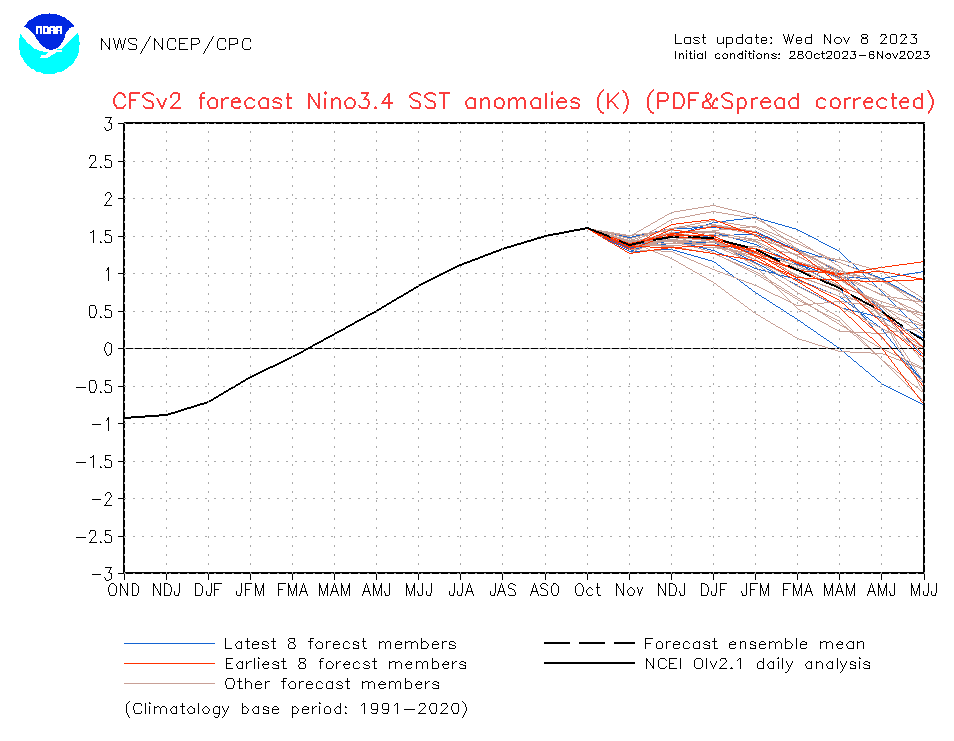
| This model shows the scatter in the forecasts and the El Nino peaking right now and not rising above 1.5C. The dark dashed line is the mean of the ensemble forecasts. If you want to see an updated version you can view an updated version by clicking HERE. So this is different from the official CPC forecast and seems quite odd actually. |
View of other Models.
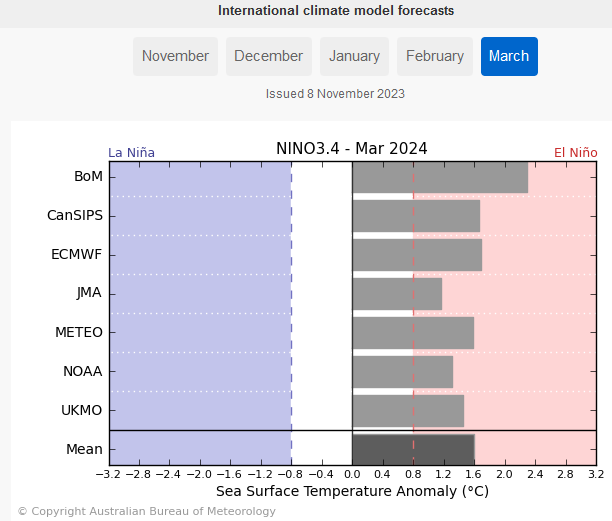
| The forecast for the strength of the NINO 3.4 Index in March of 2024 is one of the lowest for NOAA in this small collection of model results prepared by the Australian Bureau of Meteorology. Thus I would not be surprised if this El Nino is even stronger than the predictions by NOAA. |
Looking at Actual Current Conditions.
NOAA reports some derived data that describes the current situation and a forecast. But what if we want to form our own opinion? After all, meteorologists are looking at the actual current situation and making predictions.
This shows the current actual situation for the surface of oceans. To update this graphic click HERE.
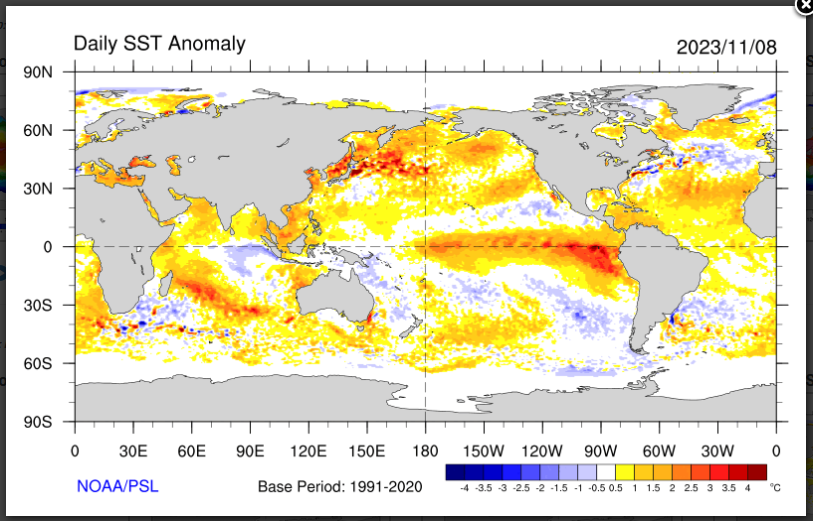
| You can see the warm tongue of water extending from Ecuador and Peru. We are discussing ENSO tonight but you can see a lot of interesting things here. It is only a one-day snapshot so keep that in mind. |
Putting the historical information in motion. Updates can be found HERE. but should not be needed.

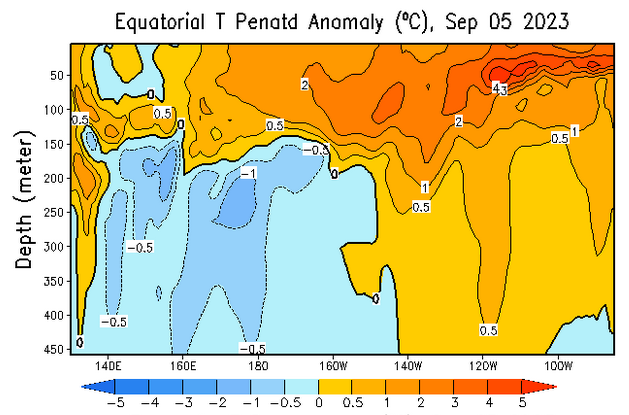
Now we look at the below surface temperature anomalies. Mapping the details. (Cross-Section along the Equator). The data is a five-day average centered on the date shown.
Here is the new map followed by the prior two graphics and this is not much change. There is actually less undercutting of the warm anomaly from the west further suggesting that El Nino will be around for a while. But the intrusion of cool water (the blue) is interesting.

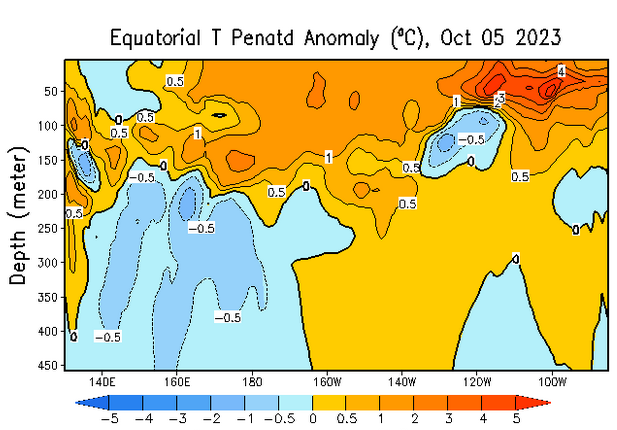
| There is a lot of warm water on the surface and below it. But the Indo-Pacific Warm Pool is pretty much spent. This raises some questions in my mind. |
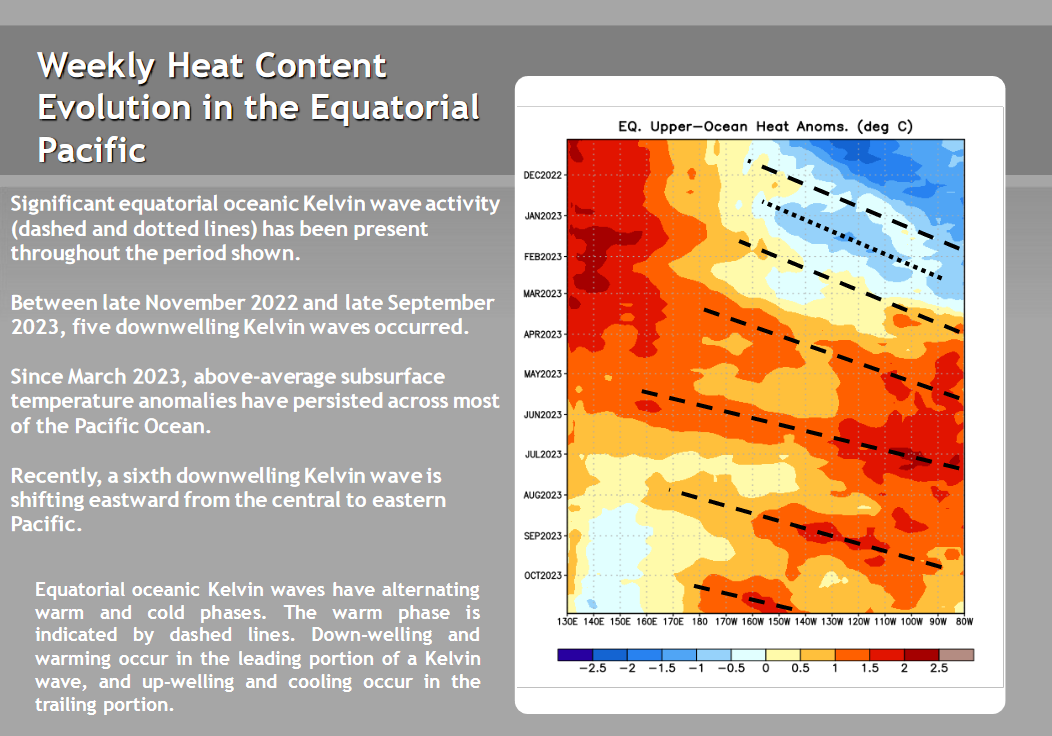
Another Kelvin Wave will maintain or increase the Nino 3.4 Index at least in the short term
Is the response of the atmosphere sufficient to sustain an El Nino?

| The SOI had been falling which is confirming the El Nino but not very strongly. The recent rise in the SOI may mean the atmosphere is not fully responding to the warmer sea surface temperatures. |
We are including the Emily Becker Article this week.
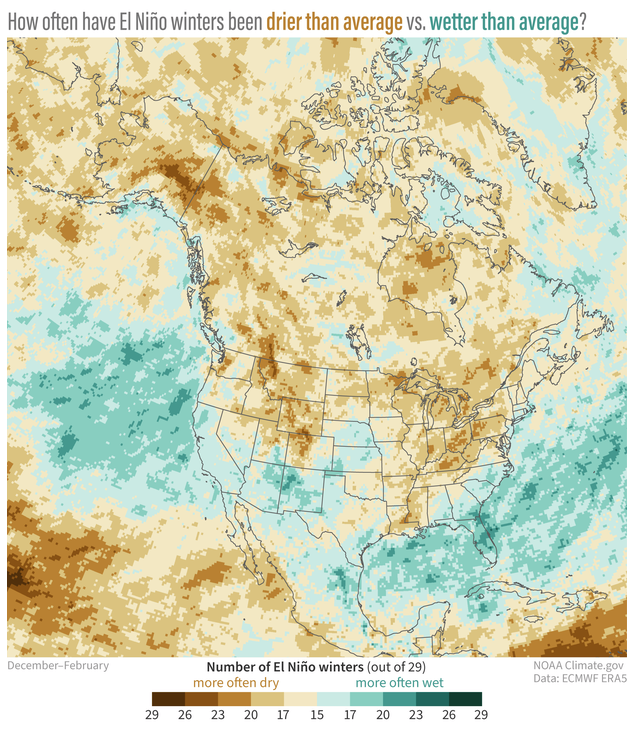
But we also call your attention to the article we previously wrote on El Nino which you can access HERE. One of the above graphics shows the probability of being wetter or dryer and in the article we wrote we show the information for each of the El Ninos individually so between the two sets of information you really get a feel for the variation in El Ninos and how it averages it out. Below is the graphic re the variation in precipitation among El Nino winters that I included in my September article.

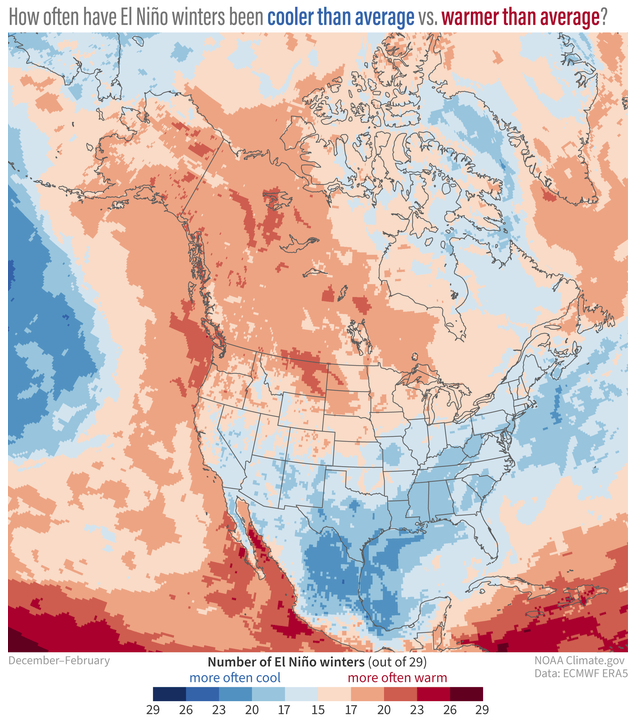
| Wow. Emily Becker really wrote a great blog post and the combination of two of the graphics she had in her article and the one I have included from a previous article that I have written really provides a good picture of the variability among El Nino winters and how with respect to precipitation it averages out. Those with an interest in El Nino would benefit from reading both articles. |
| I hope you found this article interesting and useful. |