Once a month USDA issues two reports on World Agriculture Production. The primary statistical report is issued by the USDA Chief Economist and the USDA Foreign Agricultural Service issues a companion report with is not as extensive but contains maps and other information that is always very interesting. I do not publish this article every month since it is difficult to prepare but this is a time of the year when the information is very relevant and important in terms of:
A. How it might be impacted by Global Warming and
B. The impact on the World GeoPolitical situation.
I am publishing it tonight and I may add some commentary tomorrow.
People like maps and graphs so we will start with those provided by USDA. It does not provide a total picture of World Production but many of what I will provide I think is interesting. There are so many that we will provide them without additional commentary. I am providing all of the maps and graphics but here is the LINK to the report. This will be followed by the summary from the World Agricultural Supply and Demand Estimates Report which is called WASDE. Here is the LINK to that report. It contains a lot more information but in table form with no maps and graphics.

WASDE Summary
WHEAT: The outlook for 2023/24 U.S. wheat this month is for decreased supplies, slightly lower domestic use, reduced exports, and higher stocks. Supplies are reduced as wheat production is forecast at 1,734 million bushels, down 5 million from last month as lower Other Spring and White wheat production is partially offset by increases for Hard Red Winter (HRW), Soft Red Winter, and Durum. The all wheat yield is 45.8 bushels per acre, down 0.3 bushels from last month. Domestic use is lowered 3 million bushels, all on food use, based on the NASS Flour Millings Products report, issued August 1. Wheat exports are reduced 25 million bushels to 700 million, on the weak sales and shipment pace to date for HRW, where all the reduction is made. Projected 2023/24 ending stocks are raised 23 million bushels to 615 million but remain well below the 5-year average of 846 million. The 2023/24 season-average farm price is unchanged at $7.50 per bushel.
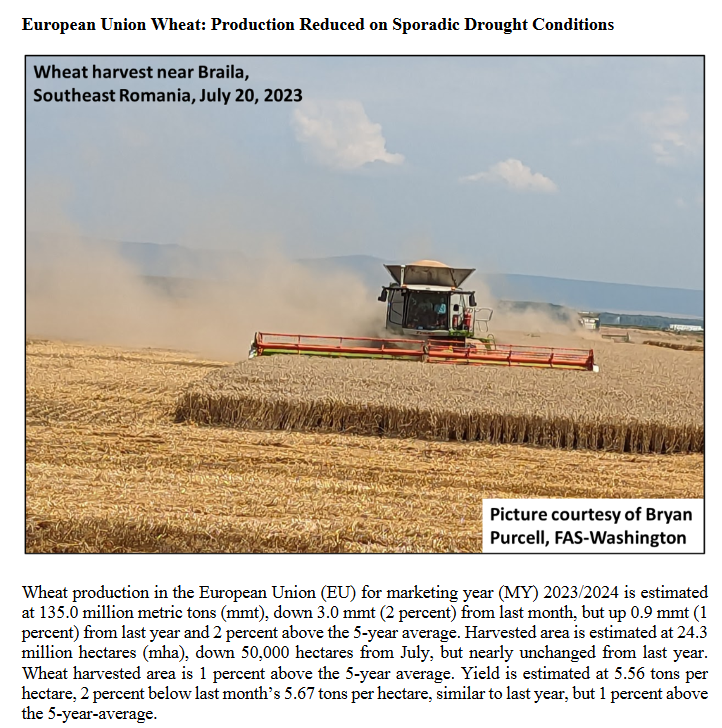
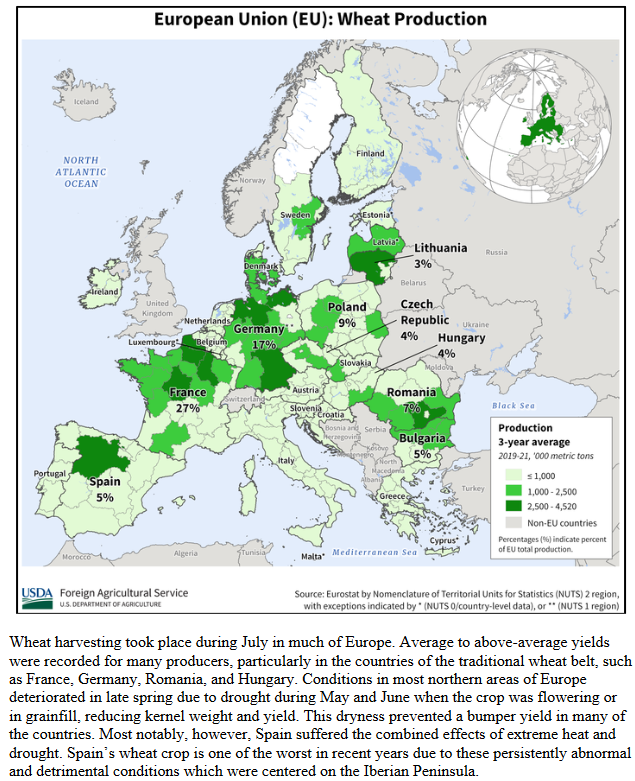
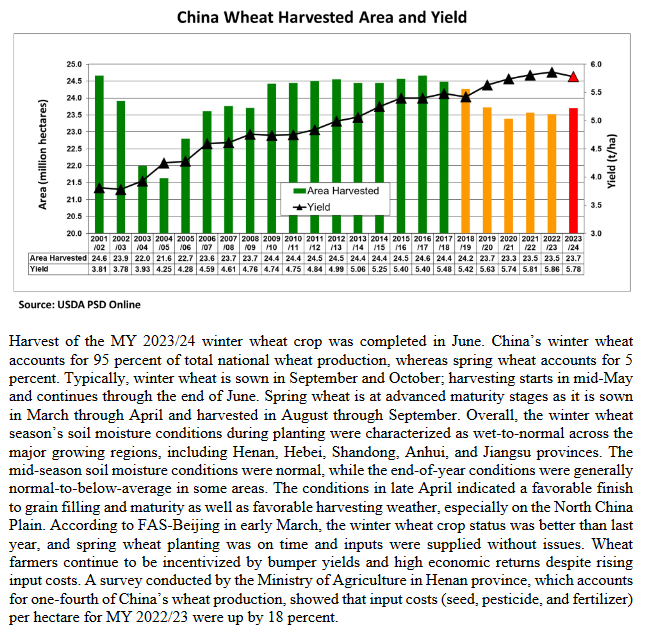
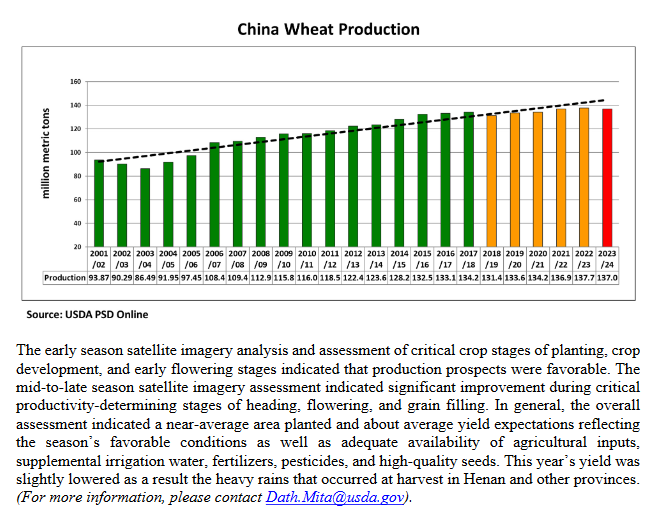
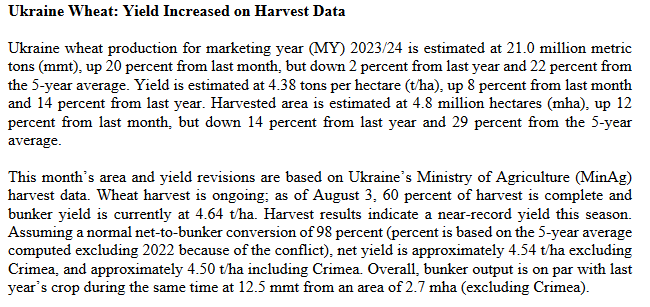
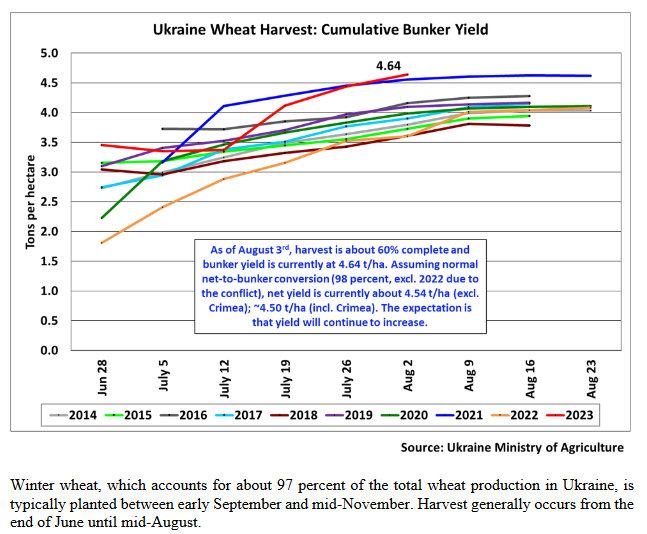
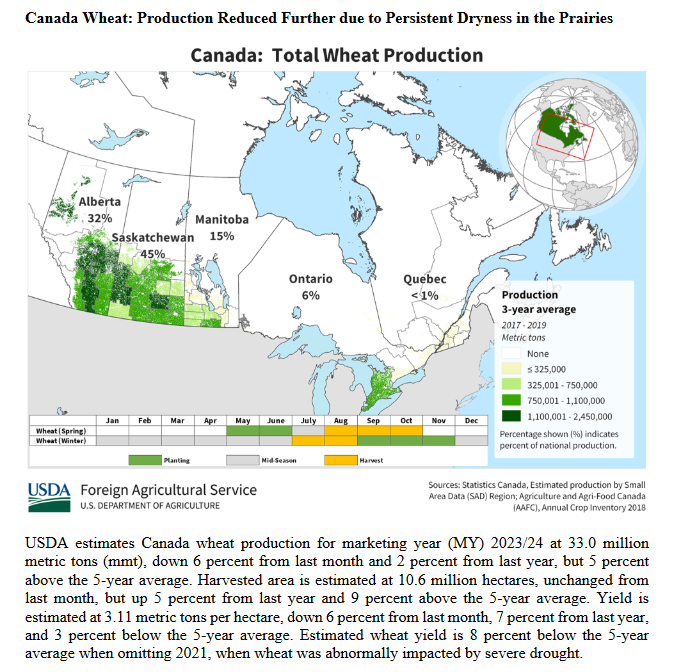
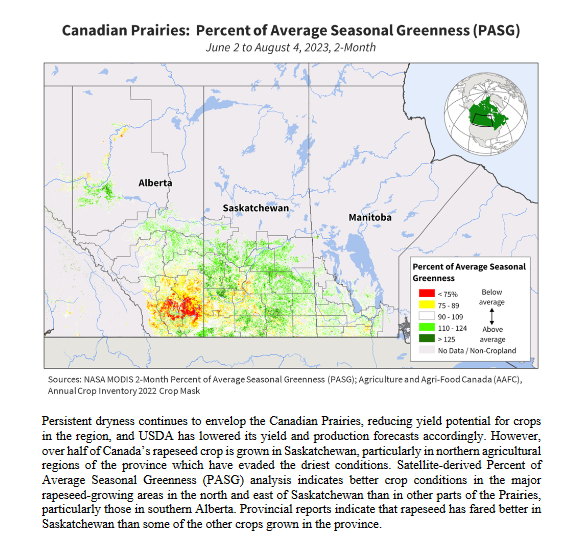
The global wheat outlook for 2023/24 is for reduced supplies, lower consumption, decreased trade, and lower stocks. Supplies are projected to decline 4.3 million tons to 1,061.7 million as reduced production for the EU, China, and Canada is only partially offset by increases for Ukraine and Kazakhstan. The EU is lowered 3.0 million tons to 135.0 million, primarily due to reductions for Spain, Lithuania, and Romania. China is reduced 3.0 million tons to 137.0 million, based on the National Bureau of Statistics summer grain production forecast. Canada is decreased 2.0 million tons to 33.0 million on worsening drought conditions in the Prairie Provinces. Ukraine is increased 3.5 million tons to 21.0 million on higher area harvested and yields with the forecast yield the second highest on record. Kazakhstan is raised 1.0 million tons to 15.0 million on higher area reported by Kazakhstan’s Bureau of National Statistics.
Global consumption is reduced 3.4 million tons to 796.1 million, mainly on lower feed and residual use for the EU and reduced food, seed, and industrial use by China. World trade is decreased 2.2 million tons to 209.4 million on reduced exports by Canada and the United States. Despite higher production, Ukraine’s exports are unchanged at 10.5 million tons with the expiration of the Black Sea Grain Initiative. Projected 2023/24 global ending stocks are lowered 0.9 million tons to 265.6 million, the lowest since 2015/16.
COARSE GRAINS: This month’s 2023/24 U.S. corn outlook is for reduced supplies, lower domestic use, smaller exports, and tighter ending stocks. Projected beginning stocks for 2023/24 are 55 million bushels higher based on a lower use forecast for 2022/23, reflecting reductions in corn used for exports, glucose and dextrose, and starch. Corn production for 2023/24 is forecast at 15.1 billion bushels, down 209 million from the July projection and if realized, would be the second highest on record behind 2016/17. The season’s first survey-based corn yield forecast, at 175.1 bushels per acre, is 2.4 bushels lower than last month’s projection. Today’s Crop Production report indicates that among the major producing States, yields are forecast above a year ago in Indiana, Iowa, Nebraska, Ohio, and South Dakota. Yields in Illinois, Minnesota, and Missouri are forecast below a year ago.
Total U.S. corn use for 2023/24 is cut 95 million bushels to 14.4 billion. Feed and residual use is lowered 25 million bushels based on a smaller crop. Corn used for glucose and dextrose and starch is projected lower based on observed use during 2022/23. Exports for 2023/24 are cut 50 million bushels to 2.1 billion. With supply declining more than use, ending stocks are lowered 60 million WASDE-639-2 bushels to 2.2 billion. The season-average corn price received by producers is raised 10 cents to $4.90 per bushel.
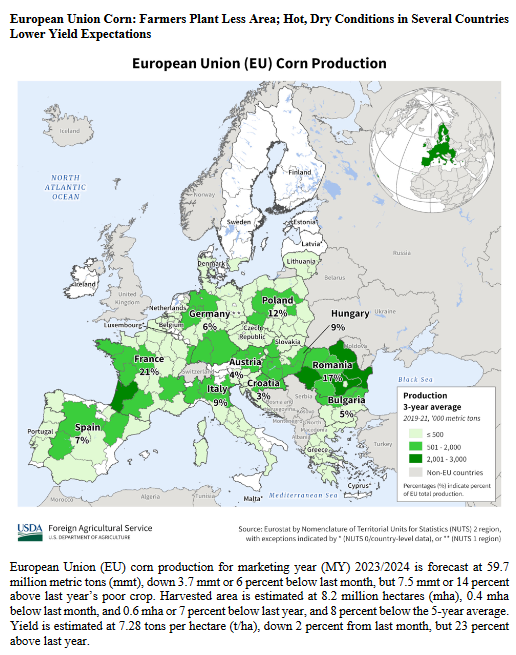
This month’s 2023/24 foreign coarse grain outlook is for lower production, reduced trade, and smaller ending stocks relative to last month. Foreign corn production is down, with cuts to the EU, China, and Russia partially offset by increases for Ukraine and Canada. EU corn production is sharply lower with reductions to both area and yield. The largest declines are for Hungary, Romania, Germany, and Italy. China corn production is reduced as excessive wetness in key producing provinces in Northeast China and on the North China Plain reduces yield prospects. Corn production for Ukraine is higher with increases to both area and yield as timely rainfall and a lack of extreme heat during July boost yield expectations. Russia corn production is reduced based on lower area. Foreign barley production is cut on declines for the EU, Canada, and Russia.
Major global coarse grain trade changes for 2023/24 include lower corn exports for the United States and the EU. Ukraine corn exports are unchanged with the expiration of the Black Sea Grain Initiative. Corn imports are raised for Canada and Zimbabwe but lowered for Egypt, Vietnam, and Algeria. Barley exports are cut for Canada and the EU. Barley imports are raised for the EU but lowered forChina and Iran. Foreign corn ending stocks are down 1.6 million tons to 255.1 million, reflecting declines for China, Zambia, and Russia that are partly offset by increases for Ukraine and South Africa.
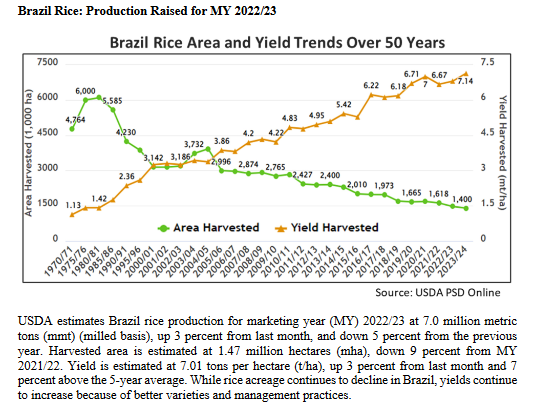
RICE: The outlook for U.S. rice in 2023/24 is for increased supplies and ending stocks compared with last month and no other changes. The initial survey-based production forecast for the 2023/24 crop increases production from the previous forecast by 2.6 million cwt to 203.6 million, all on higher yields. The average all rice yield is forecast at 7,699 pounds per acre, up 100 pounds. Long-grain production is forecast at 146.8 million cwt and combined medium- and short-grain production at 56.8 million cwt. Medium- and short-grain production is up 76 percent from a year earlier and the largest in four years. Projected all rice ending stocks are raised to 31.2 million cwt, up 1.6 million from last month. The 2023/24 long-grain season-average farm price (SAFP) forecast is increased $1.00 per cwt to $15.50 per cwt, which raises the all rice SAFP by $0.70 to $17.70 per cwt. The medium- and short-grain SAFP forecast is unchanged at $24.80 per cwt.
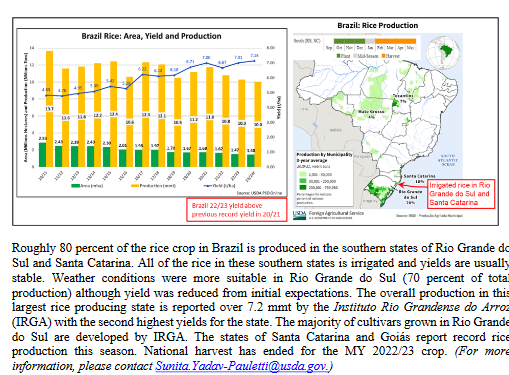
Updates to the 2023/24 global rice outlook result in slightly increased supplies, decreased consumption, lowered exports, and raised stocks compared with last month. Rice supplies are raised 0.4 million tons to 694.7 million, primarily on larger beginning stocks for India that are only partly offset by smaller stocks for Vietnam. World production is forecast up slightly month-to-month and 8.1 million tons larger than in 2022/23. Global exports are decreased 3.4 million tons to 53.0 million following an immediate ban imposed by the Government of India for milled rice exports that are neither basmati nor parboiled. India’s exports are forecast 4.0 million tons lower to 19.0 million and only partly offset by increases for Pakistan, Brazil, and Vietnam. World use is forecast down 1.0 million tons to 523.0 million, as fewer imports by many countries in Asia and Sub-Saharan Africa reduce consumption. Projected 2023/24 world ending stocks are raised 1.3 million tons to 171.8 million. The forecast for India’s ending stocks is 4.0 million tons higher than last month and partly offset by lower ending stocks for several exporters including China, Vietnam, and Pakistan.
OILSEEDS: U.S. soybean supply and use changes for 2023/24 include higher beginning stocks and lower production and exports. Beginning stocks are raised on higher 2022/23 imports. Soybean production for 2023/24 is forecast at 4.2 billion bushels, down 95 million on lower yields. Harvested area is forecast at 82.7 million acres, unchanged from July. The first survey-based soybean yield forecast of 50.9 bushels per acre is reduced 1.1 bushels from last month. Soybean supplies for 2023/24 are projected at 4.5 billion bushels, down 2 percent from last year. With soybean exports down 25 million bushels on lower supplies and crush unchanged, ending stocks are forecast at 245 million bushels, down 55 million from last month. The U.S. season-average soybean price for 2023/24 is forecast at $12.70 per bushel, up $0.30 from last month. The soybean meal price is forecast at $380 per short ton, up 5 dollars. The soybean oil price forecast is 62 cents per pound, up 2 cents.
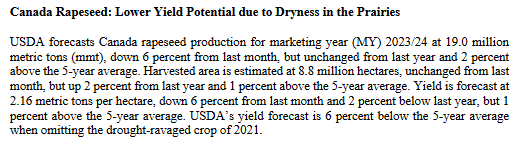
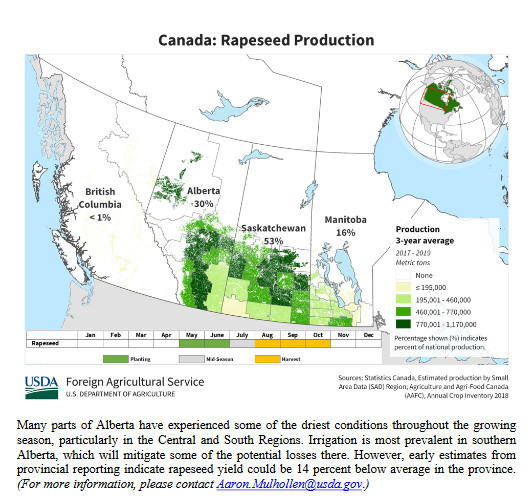
The 2023/24 foreign oilseed supply and demand forecast includes lower exports, reduced crush, and higher ending stocks. Foreign oilseed production is nearly unchanged at 539.7 million tons as higher sunflowerseed and peanut production are mostly offset by lower rapeseed output. Ukraine and Russia sunflowerseed production is forecast higher as timely rain in July improved yield potential. Conversely, Canada’s canola crop is lowered 1.3 million tons to 19.0 million as drought intensified in the southwestern Prairies during July. EU sunflowerseed production is also reduced on lower production for Romania, Spain, and France.
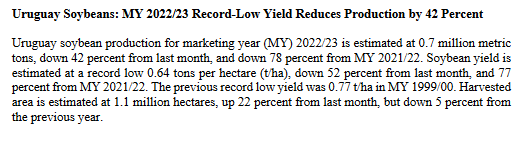
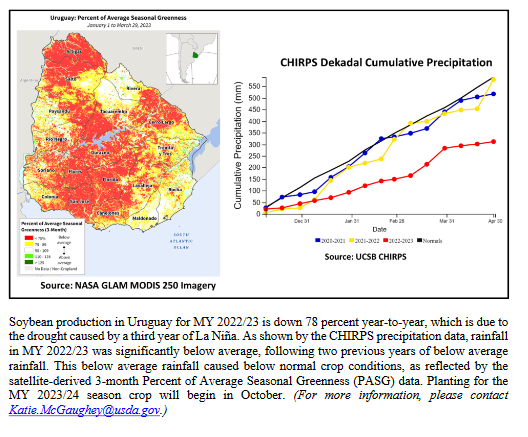
Global soybean exports are reduced 0.5 million tons to 168.8 million on lower U.S. exports. Soybean crush and imports are reduced for Bangladesh, Egypt, and Pakistan, in line with downward revisions in the prior marketing year. Global soybean ending stocks are reduced 1.6 million tons to 119.4 million mainly on lower U.S. stocks.
SUGAR: Mexico sugar supply for 2022/23 is increased by 125,000 metric tons (MT) to 6,388,512 on an increase in imports. Sugar stocks have decreased substantially in both May and June driving domestic prices to historically high levels and incentivizing high-tier tariff imports. Official trade data showing sugar exports to Mexico are currently at 112,531 MT through May with 4 months to go in 2022/23. Relatively low Mexico production of low polarity sugar at 730,207 MT limits total exports under license to 1,043,153 under Suspension Agreement provisions that requiring low polarity exports to be at least 70 percent of the total. Exports apart from those under license are at 21,860 MT. Ending stocks are unchanged providing enough sugar to supply domestic needs for 2.3 months Deliveries into IMMEX are increased by 86,613 MT to 359,113.
U.S. sugar supply for 2022/23 is raised by 148,289 short tons, raw value (STRV) on increased imports only partially offset by lower beet sugar production while use is lowered 25,000. The resulting 173,289-STRV stock increase pushes the total to 2,013,900 for an ending stocks-to-use ratio of 15.84 percent. Re-export imports are increased by 75,000 STRV to 200,000 after a large inflow reported by Customs and Border Protection (CBP) in July. Greater sugar supply availability in Mexico results in an import increase of 43,175 STRV. Calendar year TRQ imports for FTA countries are up 36,381 STRV on imports expected in the fourth quarter (the first quarter of 2023/24) entering earlier than expected. High-tier tariff imports are increased by 40,000 STRV to 390,000 on a large raw sugar entry of about 15,000 MT recorded by CBP in early August and on a further increase in the expected pace of refined sugar imports for the remainder of the fiscal year. Some reliable sources indicate that more raw sugar high-tier tariff imports are possible, but these will only be incorporated into the sugar WASDE after reported by CBP. The raw sugar TRQ shortfall is increased due to analysis made subsequent to USTR’s allocation of the TRQ after last month’s WASDE. U.S. 2022/23 beet sugar production is estimated 10,929-STRV lower (5,135,692) on processors’ revised estimates of their beet sugar from sliced beets in the SMD.
Use for 2022/23 is reduced by 25,000 STRV to 12,715,000 on an observed slowing of the pace of deliveries for human consumption. Deliveries for human consumption from domestic processors/refiners are running about 1-percent lower year over year. Beet deliveries continue to lag the previous year by about 6.5 to 7.0 percent while cane deliveries have been largely compensating, but at a declining rate since May. The extent of the decrease is limited to 25,000 STRV after consideration of two factors. First, some sources indicate that the cane deliveries could regain their momentum for the remainder of the fiscal year. Second, refined high-tier tariff imports that augment direct consumption are forecast higher and may be presenting a lower-price alternative to deliveries of the domestically processed product.
U.S. sugar supply for 2023/24 is increased by 222,848 STRV on increased beginning stocks, production, and imports. Sugar production is projected 4,197 STRV higher. Compared with last month’s WASDE, NASS forecasts an unchanged sugarbeet area harvested but a larger sugarbeet yield of 30.93 tons/acre implying a beet sugar increase of 51,302 STRV to 5,073,061. Recent dryness in Louisiana has resulted in lower processors’ forecasts of cane sugar production. It is now projected at 2,053,899 STRV, a reduction of 38,101. The Texas cane processor has lowered its forecast of sugar production by 9,004 STRV to a remarkably low total of 41,967. Access to water needed for irrigation is restricted and responsible for the poor production prospects. Imports are higher on a 75,000-STRV increase in re-export imports matching the increase in 2022/23 and a 10,000-STRV increase in high-tier tariff refined imports. Reallocation of expected FTA imports to 2022/23 reduces the total import increase to 45,362 STRV. There are no changes to use components this month. Ending stocks are projected at 1,942,108 STRV for stocks-to-use ratio of 15.24 percent.
LIVESTOCK, POULTRY, AND DAIRY: The forecast for 2023 red meat and poultry production is reduced from last month on lowered beef, pork, and broiler forecasts. Beef production is lowered on lower steer and heifer slaughter and lighter dressed weights although cow slaughter is increased. Pork production reflects lighter dressed weights although slaughter is raised slightly. Broiler production is reduced on lower expected eggs set and continued relatively low hatchability. Turkey production is raised on slaughter data and hatchery data. Egg production is lower as hatchery data has indicated lower-than-previously-expected flock productivity and slower additions of pullets to the laying flock.
For 2024, the red meat and poultry production forecast is raised on higher beef and turkey production which more than offsets lower broiler production. Beef production is raised, reflecting higher expected placements in late 2023 and early 2024. These cattle are expected to be slaughtered during 2024. Cow slaughter is also raised for the first part of 2024. Turkey production is raised slightly for early 2024. Pork production is unchanged from last month. Growth in broiler production is slowed with lower prices expected to reduce producer margins. The slower pace of egg production growth in 2023 is expected to carry into early 2024.
Beef imports for 2023 are adjusted to reflect recent trade data but no change is made to the forecasts for second-half 2023 or 2024. The beef export forecast is unchanged for 2023. Exports are raised for2024 from last month on higher expected supplies of beef. Pork imports and exports are adjusted to reflect June data, but no change is made to the forecasts for the remainder of 2023 or 2024. Broiler exports are reduced for 2023 and 2024 on lower expected production. Turkey exports are raised on lower expected prices.
Cattle price forecasts for 2023 and 2024 are raised on continued firm packer demand. The 2023 hog price forecast is raised on current price strength, but no changes are made to 2024. The broiler price forecasts for 2023 and 2024 are lowered. Turkey price forecasts for 2023 and 2024 are lowered on current prices and expectations of continued weak demand. Egg price forecasts are unchanged.
The milk production forecasts for 2023 and 2024 are lowered from last month. The cow inventory is lowered for both years based on the July 1 dairy cow inventory and heifer retention data provided in the recent Cattle report, as well as the average cow inventory data in the latest Milk Production report. Output per cow is reduced for 2023 but unchanged for 2024.
Fat and skim-solids bases imports for 2023 are lowered from last month on weaker expected imports of cheese and butter. For exports, the 2023 fat basis export forecast is lowered due to lower exports of cheese, butter and butterfat products, and whole milk powder. The skim-solids export forecast is lower due primarily to weaker sales of whey products. Exports for 2024 are also reduced on both a fat basis and a skim-solids basis reflecting lower expected sales of butter, cheese, whey, and lactose. Imports for 2024 are reduced slightly on both fat and skim-solids bases, with weaker expected imports of cheese, butter, and casein.
Forecasts for 2023 butter and cheese prices are raised from the previous month based on recent price strength. Whey price forecasts are lowered for 2023, as global demand remains weak. The forecast for nonfat dry milk (NDM) is raised slightly for 2023. The Class III price is raised as the higher cheese price more than offsets lower whey. The 2023 Class IV price forecast is raised due to higher butter and NDM prices. The all milk price for 2023 is raised to $19.95 per cwt. For 2024, butter and cheese price forecasts are raised with the strength in prices carrying over from the previous year. Whey prices are lowered, while the NDM forecast is unchanged. The Class III price is raised as stronger cheese prices more than offset lower whey prices. The Class IV price is raised based on higher butter prices. The all milk price is raised to $19.35 per cwt.
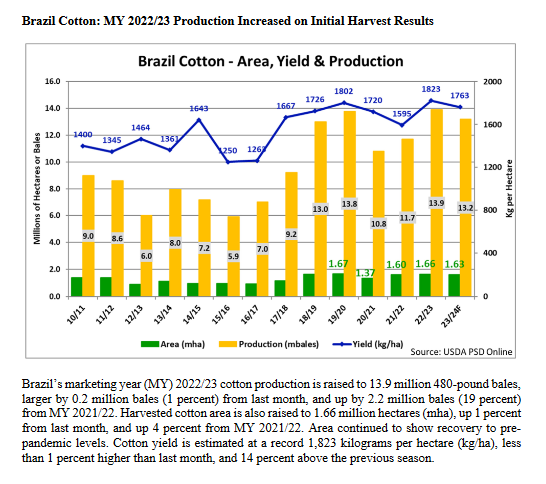
COTTON: In this month’s 2023/24 U.S. cotton projections, beginning stocks are larger, and a 2.5- million-bale decrease in production results in lower exports, domestic use, and ending stocks. Beginning stocks are larger as this month’s 2022/23 ending stocks are increased 450,000 bales reflecting slightly lower exports and July 29 warehouse inventory levels in the AMS Bales Made Available for Shipment report. NASS’s first survey-based estimate of production for 2023/24 is 14.0 million bales, down 2.5 million, with the crop reduced by higher projected abandonment and reduced yield in the Southwest. Exports are projected 1.3-million bales lower than in July due to reduced U.S. supply and increased competition from Brazil and Australia. Ending stocks are 700,000 bales lower, at 3.1 million bales. The U.S. season-average price for upland cotton is forecast 3 cents higher this month at 79 cents per pound.
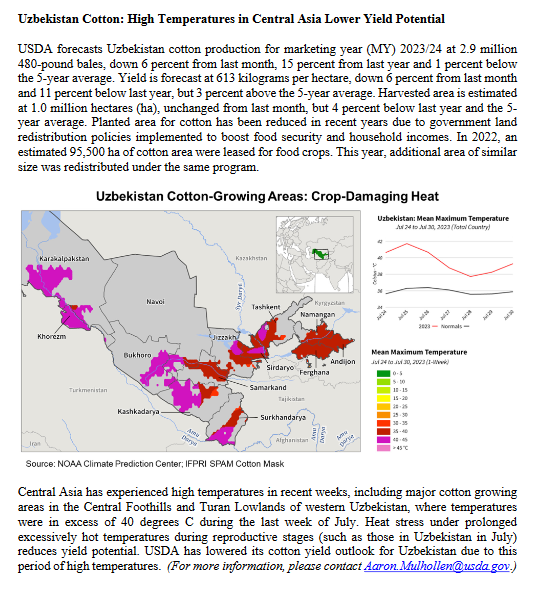
Global 2023/24 production is forecast 2.7 million bales lower this month, and consumption is 500,000 bales higher, resulting in a decrease in projected ending stocks of 2.9 million bales. In addition to the U.S. crop change, world production is reduced an additional 200,000 bales as extreme heat in Uzbekistan reduced yield prospects. World trade is 400,000 bales higher this month, with increases in imports by China and Turkey. Projected exports are also higher this month as increases for Brazil and Australia offset declines for the United States and Benin. Consumption in 2023/24 is projected higher than a month ago in China and Turkey, and lower in Indonesia.
Approved by the Secretary of Agriculture and by the Chairman of the World Agricultural Outlook Board, Mark Jekanowski, (202) 720-6030. This report was prepared by the Interagency Commodity Estimates Committees
–
| I hope you found this article interesting and useful. |
–