This post examines the question: which comes first, US federal government deficit spending or inflation?

Credit: Image by Taken from Pixabay1
Introduction
In the first two parts of this series2,3, we found that there was wide variation in the correlation between federal deficit spending and inflation. We found that rolling averages (moving averages) smoothed short-term variations as expected. But we were concerned they might be averaging out meaningful data. Therefore, we use the short-term rolling average with three data points of correlation in this study.
Do Deficits Lead Inflation?
Which came first, the chicken or the egg? That age-old teaser asks an imponderable question. When it comes to government deficits and inflation, the question becomes malleable. We can examine the correlations between the two variables for concurrent data and data delayed for one variable vs. the other.
Data
Previously3 we posted the following:
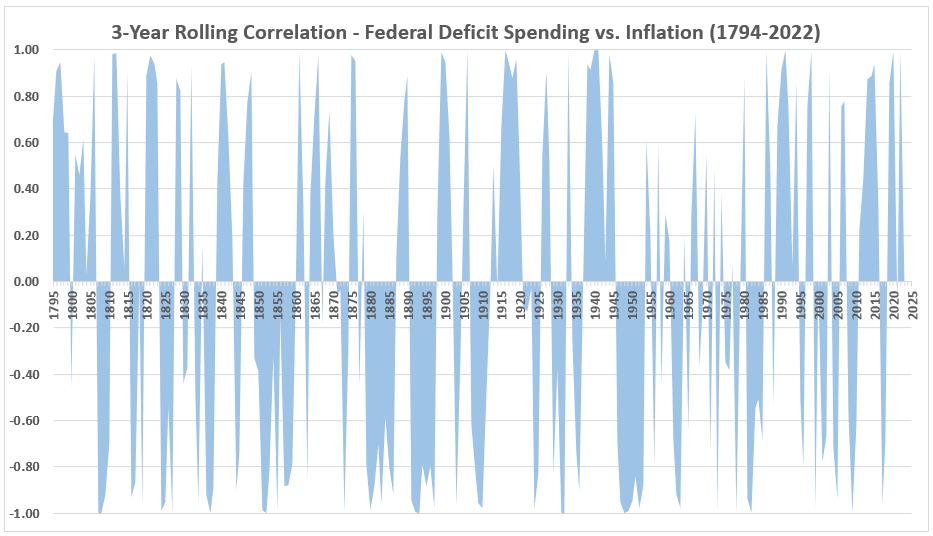
Figure 1. U.S. Federal Deficits and Inflation – 3-year Rolling Correlations
(Figure 8 Previously3)
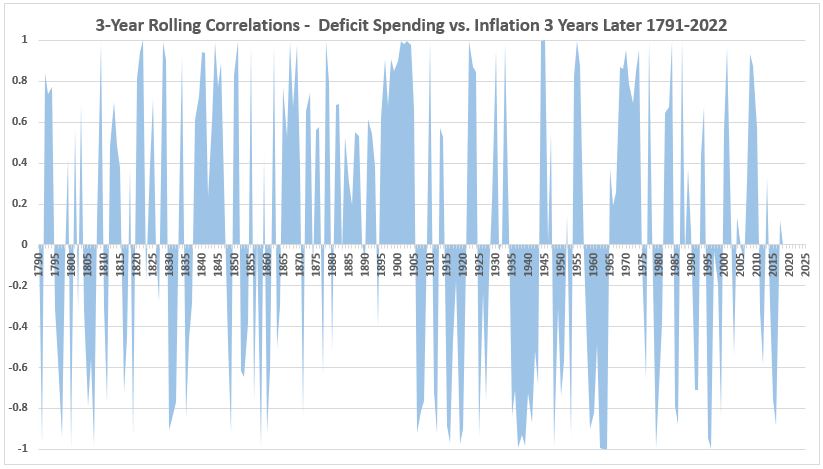
We will now address what effects are seen if the two data streams are moved in time relative to each other. First, the correlations will be determined when inflation is deferred one year such that the deficit for one year is correlated with the inflation in the next year. (Figure 2.) In Figure 3, the correlations are shown when inflation is deferred two years, and in Figure 4 deferred three years.
Figure 2. U.S. Federal Deficits and Inflation – 3-year Rolling Correlations
(Inflation deferred 1 year – Deficit for 1793 Correlated with Inflation 1794, etc.)
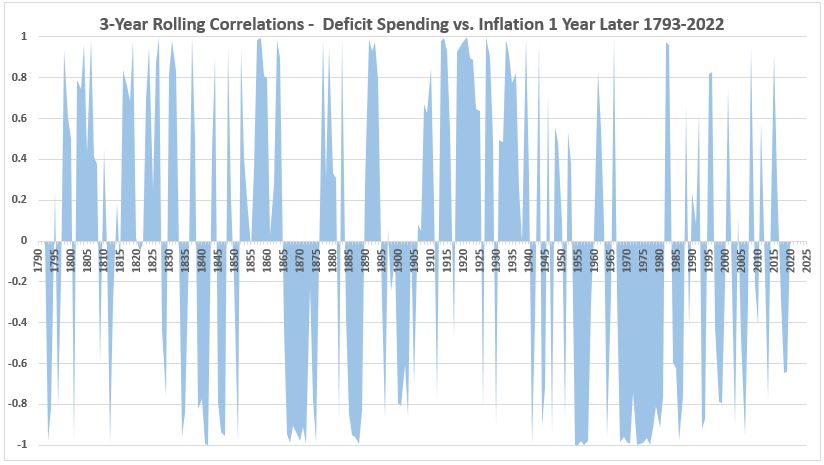
Figure 3. U.S. Federal Deficits and Inflation – 3-year Rolling Correlations
(Inflation deferred 2 years – Deficit for 1792 Correlated with Inflation 1794, etc.)
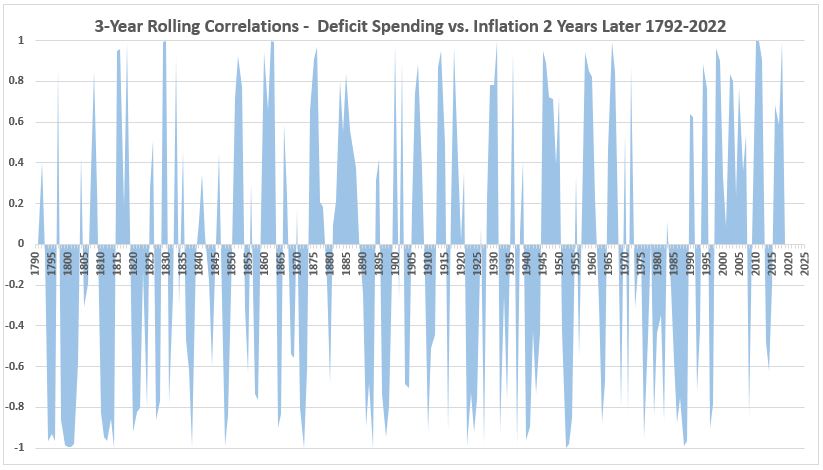
Figure 4. U.S. Federal Deficits and Inflation – 3-year Rolling Correlations
(Inflation deferred 3 years – Deficit for 1791 Correlated with Inflation 1794, etc.)
Discussion
There are several observations:
- Figure 1 and Figure 2 differ significantly in several areas. Examples:
- The mixed correlations following the Civil War (1865-1876) in Figure 1 are decidedly negative in Figure 2.
- The mixed but more negative than positive correlations from 1920-1936 in Figure 1 are strongly positive in Figure 2.
- The mixed correations from 1967-1981 in Figure 1 are strongly negative in Figure 2.
- The more positive correlations (2010-2020) are mixed in Figure 2.
- Figure 3 is different from the first 2 figures. Examples:
- The negative correlations following the Civil War (1865-1876) in Figure 1 are much weaker in Figure 3.
- The positive correlations 1905-1940 in Figure 2 are divided between positive and negative correlations in Figure 3.
- The correlations divided between positive and negative in Figure 2 (1990-2020) are quite positive in Figure 3.
- Figure 4 shows strong positive correlations 1865-1905, different from the first three figures.
So far we are making only qualitative observations. A task in the future is to determine how to determine quantitative results from these correlations. It will be a couple of more weeks before we get to that.
Can Inflation Lead Deficits?
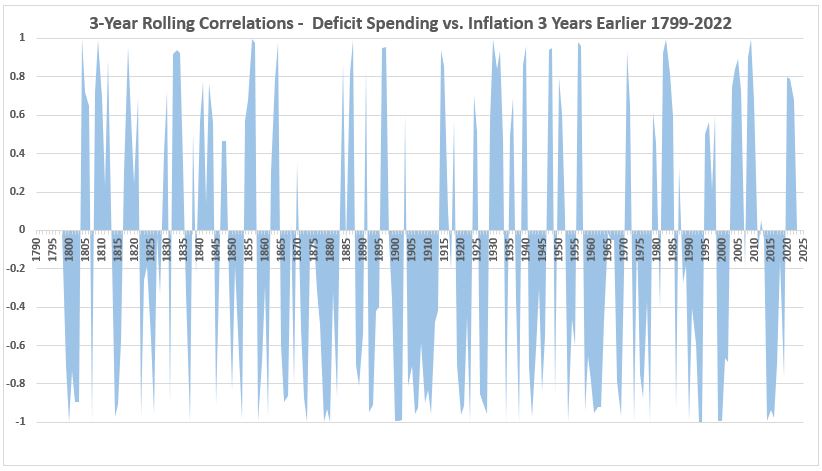
The Milton Friedman hypothesis4 is that government spending causes inflation. If the correlations are more positive when deficits are preceded by inflation than when inflation is concurrent or following, there is a basis for questioning Friedman’s conclusion. In the following, we examine the data when correlations are determined between inflation one year prior and the federal deficit (Figure 5), two years prior (Figure 6) and 3 years prior (Figure 7).
Data
The following graphs are to be compared with Figure 1, the correlations between federal deficits and inflation in the same years.
Figure 5. U.S. Federal Deficits and Inflation – 3-year Rolling Correlations
(Inflation 1 Year Prior – Deficit for 1797 Correlated with Inflation 1796, etc.)
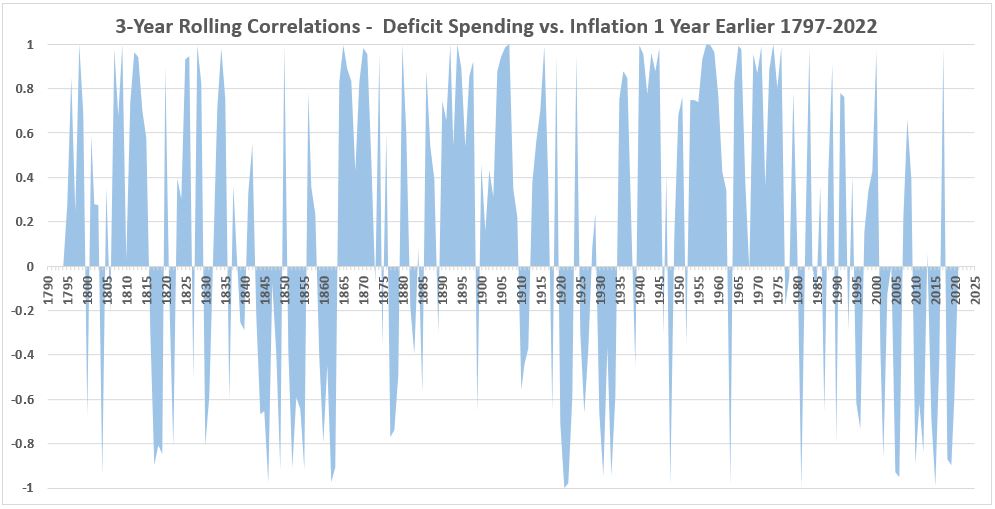
Figure 6. U.S. Federal Deficits and Inflation – 3-year Rolling Correlations
(Inflation 2 Years Prior – Deficit for 1798 Correlated with Inflation 1796, etc.)
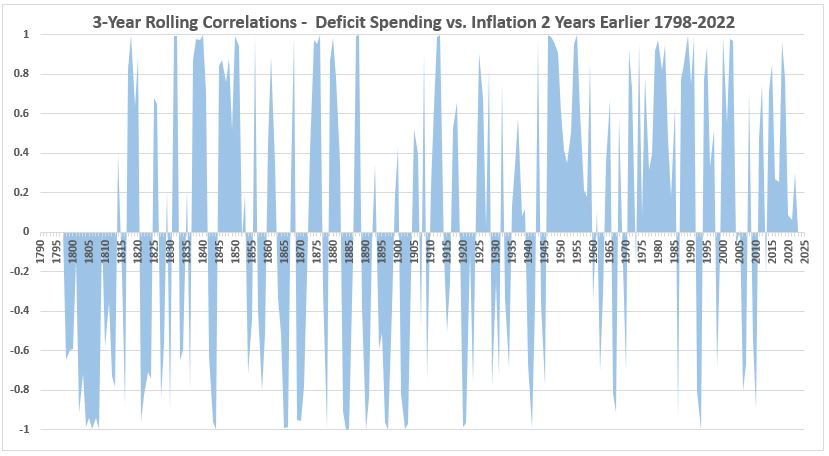
Figure 7. U.S. Federal Deficits and Inflation – 3-year Rolling Correlations
(Inflation 3 Years Prior – Deficit for 1799 Correlated with Inflation 1796, etc.)
Discussion
Similar observations can be made regarding the difference between these three graphs as were made in the previous section for the graphs covering spending leading inflation. It is not worth repeating the process here since the results are only qualitative.
There is one new observation. It appears that Figure 5 has more net positive correlation than do any of the other graphs. That is very tentative and further discussion will wait until we have a way to make quantitative measurements.
Conclusion
The results of lead and lag correlation has been confounded here because of three different fiscal year regimes. Namely:
- From 1790-1841 the fiscal year was the calendar year.
- From 1842-1976 the fiscal year was July 1 to June 30.
- From 1977 to date, the fiscal year was October 1 to September 30.
This means that in each of those three periods, correlations between inflation and deficits that were nominally coincident were only so for the years 1790 to 1841. The deficit timeline led inflation by six months from 1842 to 1976, and by three months since.
For a better determination of leads and lags we can use monthly inflation data which is available starting in 1913. This is what we will work on in the next week.
Footnotes
1. Taken. https://pixabay.com/users/taken-336382/. Caption image via Pixabay. https://pixabay.com/photos/money-dollar-currency-cash-1298029/.
2. Lounsbury, John, “Government Spending and Inflation. Part 1, Expanded”, EconCurrents, February 15, 2023. https://econcurrents.com/2023/02/11/government-spending-and-inflation-part-1-expanded/
3. Lounsbury, John, “Government Spending and Inflation. Part 2”, EconCurrents, February 19, 2023. https://econcurrents.com/2023/02/19/government-spending-and-inflation-part-2/
4. Friedman, Milton, “Only Government Creates Inflation”, YouTube, https://youtu.be/F94jGTWNWsA.
Pingback: Government Spending and Inflation. Part 4 - EconCurrents
Pingback: Government Spending and Inflation. Part 5 - EconCurrents