On the third Thursday of the month right on schedule NOAA issued what I describe as their Four-Season Outlook. The information released also included the MId-Month Outlook for the single month of February plus the weather and drought outlook for the next three months. I present the information issued and try to add context to it. It is quite a challenge for NOAA to address the subsequent month, the subsequent three-month period as well as successive three-month periods for a year or a bit more.
We will begin to see the impacts of the end of La Nina for precipitation in May/June/July of 2023. And the outlook for the Southwest Monsoon has changed from above normal to normal.
We may see the impacts of El Nino Conditions on the temperature in Dec/Jan/Feb 2023-2024 and on precipitation in Sept/Oct/Nov 2023 but the impacts will be small and strangely impacting the Eastern half of CONUS more than the West. The Outlook is not for a wetter-than-normal West but for some relief from the heat.
The maps show a series of changes which I have highlighted in my comments. Next winter will be very different than this winter.
It is very useful to read the excellent discussion that NOAA issues with this Seasonal Outlook.

| The current weather report is available now HERE. To return to this article hit the return arrow in the upper left-hand corner of your screen. |
First, Let’s Take a Look at the Mid-Month Outlook for February.
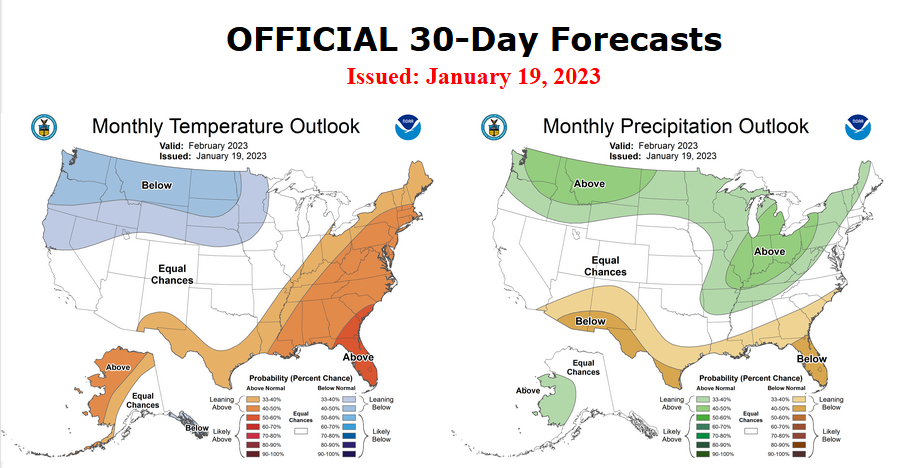
Combination Mid-Month Outlook for February and the Three-Month Outlook
The top row is what is now so-called the Mid-Month Outlook for February which will be updated at the end of January. There is a temperature map and a precipitation map. The second row is a three-month outlook that includes February. I think the outlook maps are self-explanatory. What is important to remember is that they show deviations from the current definition of normal which is the period 1991 through 2020. So this is not a forecast of the absolute value of temperature or precipitation but the change from what is defined as normal or to use the technical term “climatology”.
| Notice that for precipitation, the February and three-month outlooks are quite similar. It is somewhat the same situation for temperature. |
| For both temperature and precipitation, if you assume the colors in the maps are assigned correctly, it is a simple algebra equation to solve the month two/three anomaly probability for a given location = (3XThree-Month Probability – Month One Probability)/2*. So you can derive the month two/three outlook this way. You can do that calculation easily for where you live or for the entire map. |
Here are larger versions of the Temperature and Precipitation outlook maps for the single month of February.
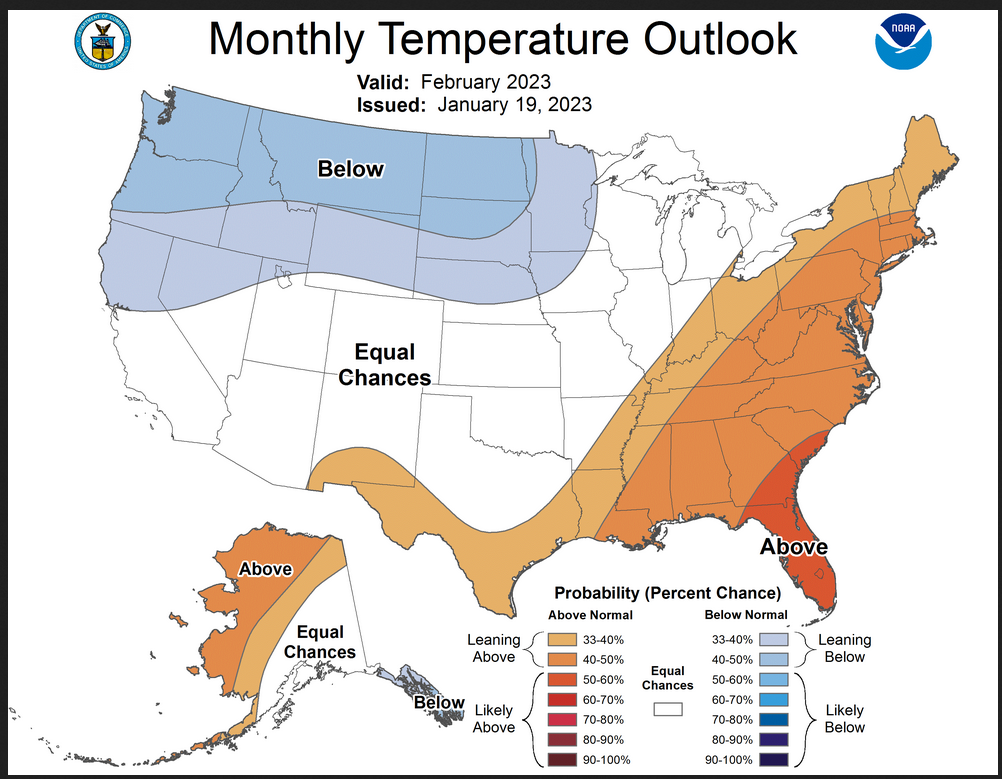
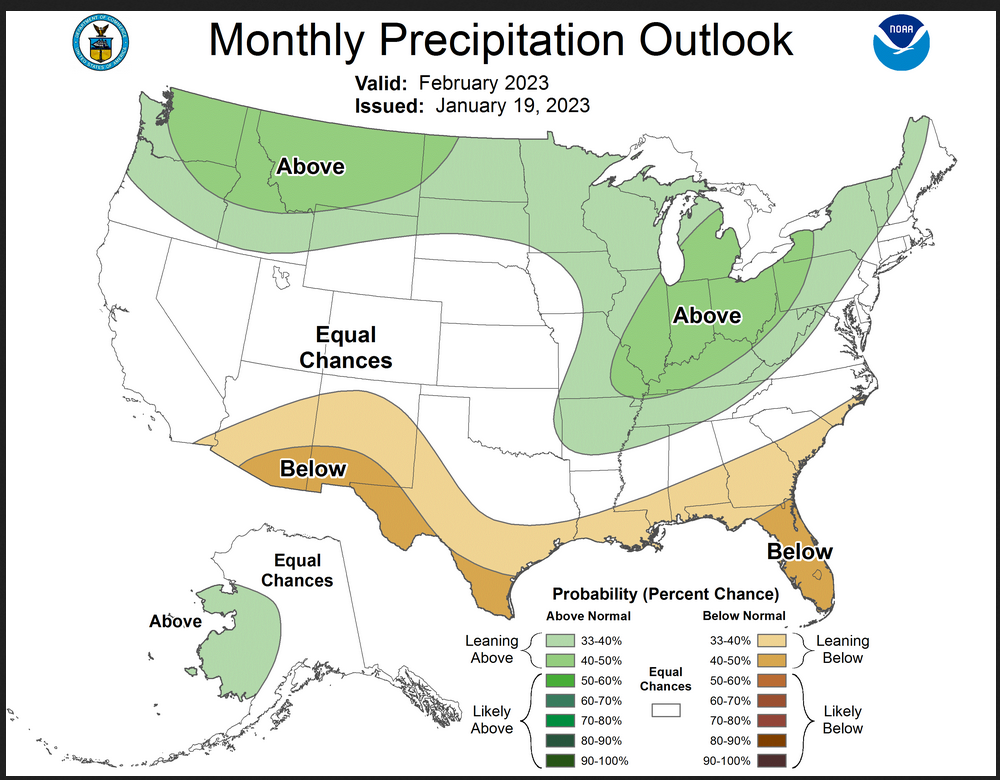
The maps are pretty clear in terms of the outlook.
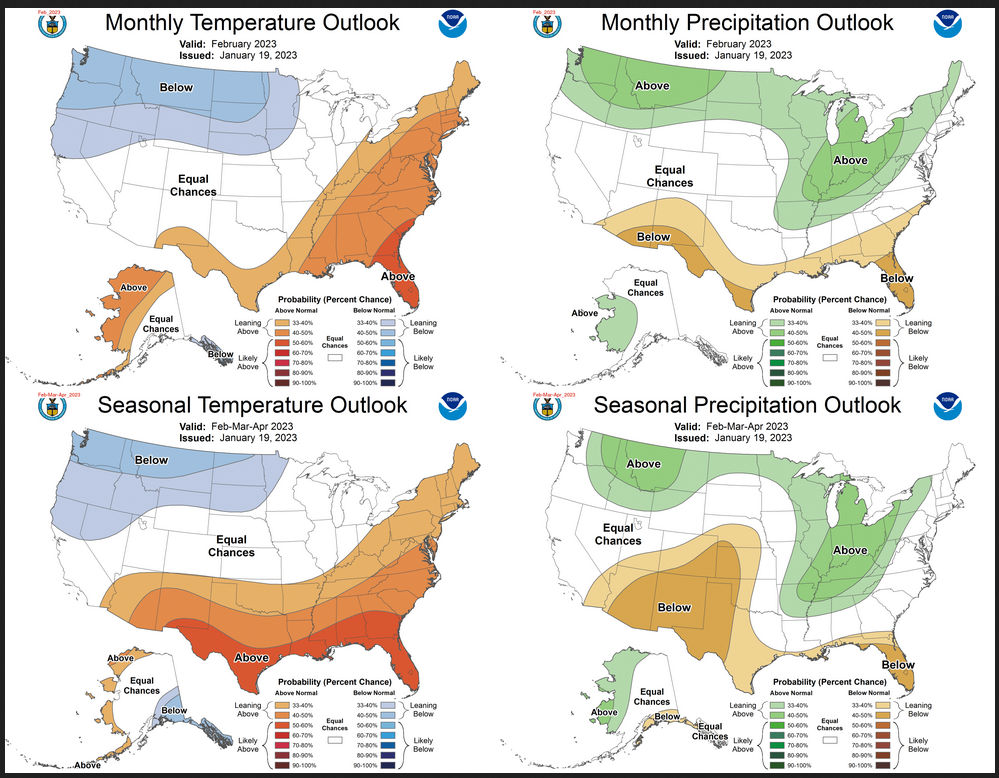
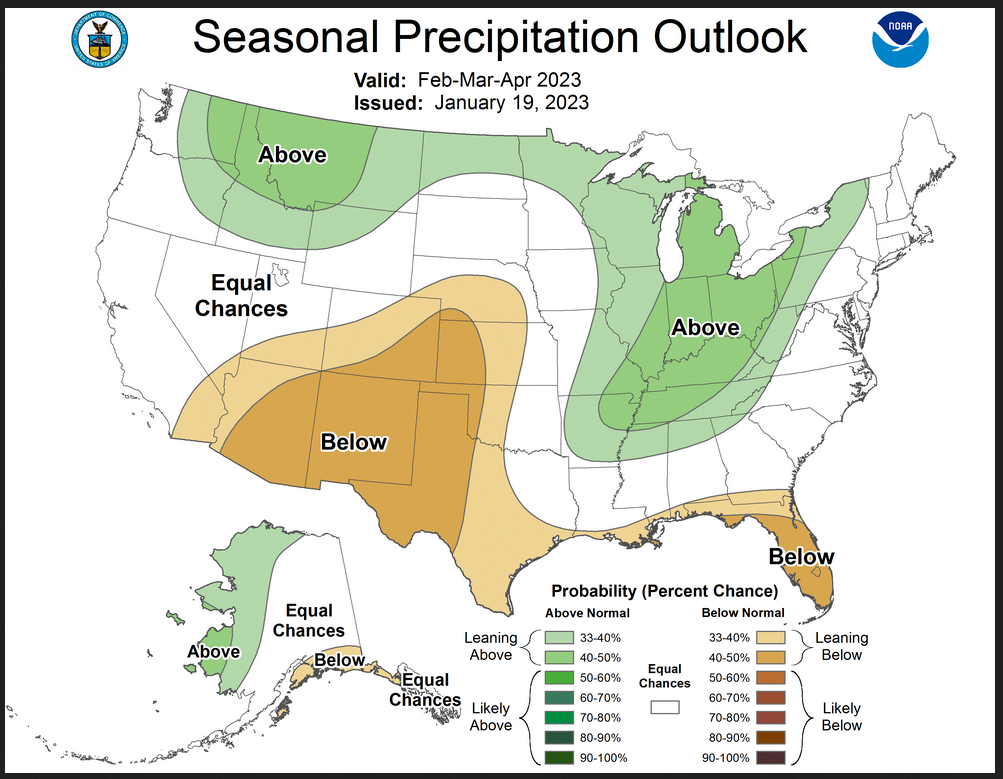
And here are large versions of the three-month FMA 2023 Outlook
First temperature followed by precipitation.
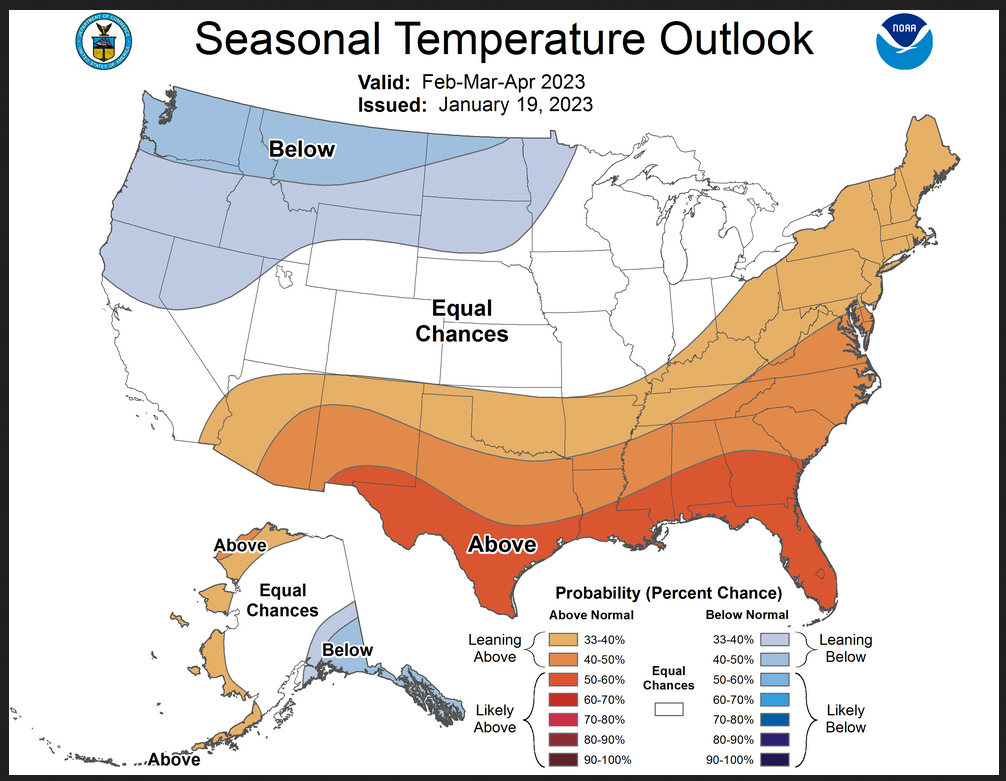
The maps are larger versions of what was shown in the first graphic that had smaller versions of all four of these maps.
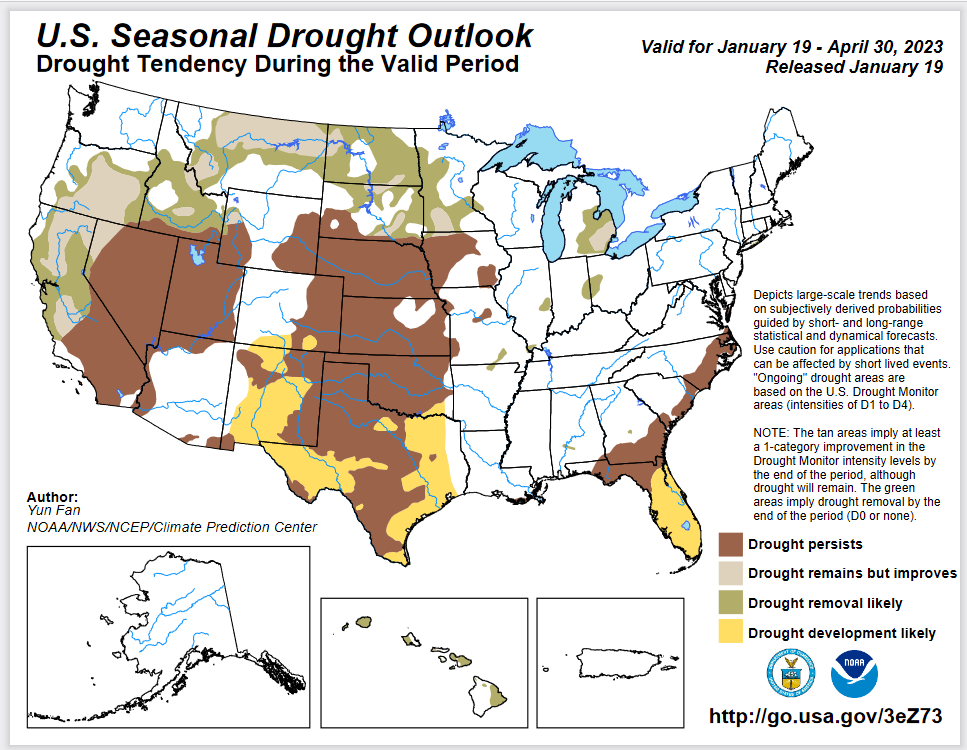
Drought Outlook
–
| The yellow is the bad news. And there is some of that. But the area with drought improvement seems about the same size. |
Short CPC Drought Discussion
Latest Seasonal Assessment – During the last four weeks, widespread drought relief occurred across parts of the western CONUS, High Plains, Mississippi, Tennessee, and Ohio Valleys. In particular, 10 to 20 inches of heavy precipitation from atmospheric river storms was dumped along the West Coast, especially across most of California, bringing widespread 1 to 2 class drought improvement. Extreme and exceptional drought was removed from all of California just in the last two weeks. Emergency flooding evacuation was declared in some storm-lashed areas. The storms also brought a few feet of snow along the Sierra Nevada while blizzard conditions developed over the Northern Plains. Farther east, a few storm systems dropped heavy precipitation across many drought areas from the southern Plains northeastward to New England. As a result, more drought areas saw improvement than deterioration. However, 1 to 4 inches of precipitation deficit was observed over a few areas, resulting in some patches of deterioration in the Southern Plains and Southeast.
The forecast through April 2023 period shows a diminished probability of La Niña conditions with a 71% chance of ENSO neutral. Climate anomalies associated with cold ENSO events will gradually disappear. Over the West, drought conditions are expected to be improved across much of northern and central California, Oregon, eastward to Idaho and Montana due to favored above normal precipitation and below normal temperatures over much of the region. Drought persistence is favored for the existing drought areas over the rest of the West due to near to above normal chances of below normal precipitation and above normal temperatures across the region, with potential drought development over parts of New Mexico. Across the Plains and adjacent areas, February-April is a climatologically drier period than most other times of year. The forecast favors near to above normal probabilities of above normal precipitation and below normal temperatures over the Northern Plains and with above normal snowpack, drought improvement is anticipated over the region. However, near to above normal odds of below normal precipitation and above normal temperatures are forecast over the Central and Southern Plains, so drought conditions are expected to persist over the existing drought areas with potential development over parts of southwestern and southeastern Texas. Over the Midwest, forecasts call for drought improvement over the northern and eastern region and drought persistence over the southwestern region. Drought free conditions are favored for the FMA period in most of the Northeast. Above normal precipitation over next 1-2 weeks favors removing the tiny drought patch over southern Long Island. Persistence is anticipated for most of the existing drought areas over the Southeast with potential drought expansion into the entire Florida Peninsula.
Alaska currently is drought free and is likely to continue as the region during the cold season of the year. Drought free conditions are anticipated across Puerto Rico. Continued drought improvement and removal is forecast for the Hawaiian Islands due to forecast above normal precipitation.
Looking out Four Seasons.
Twelve Temperature Maps. These are overlapping three-month maps (larger versions of these and other maps can be accessed HERE)
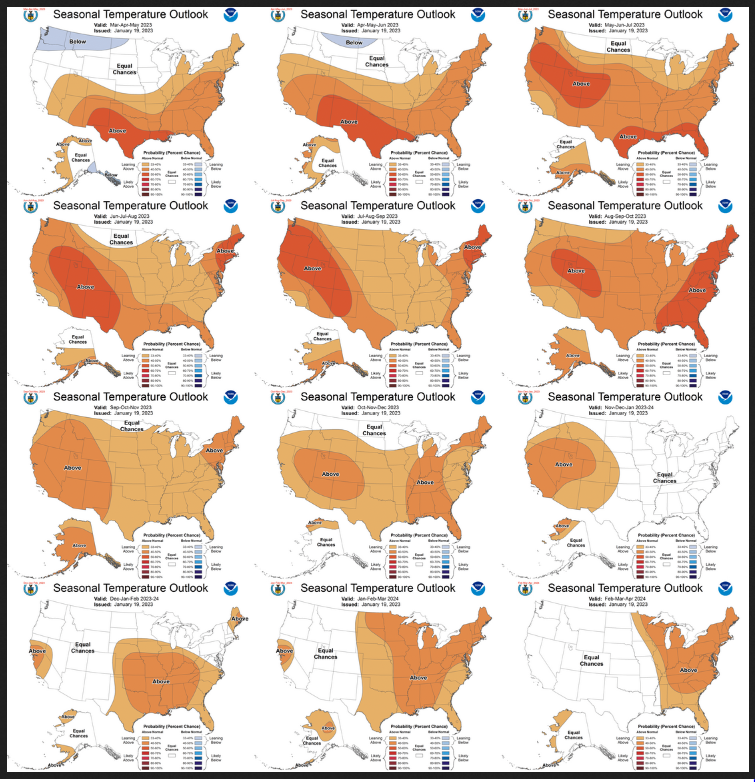
Notice that this presentation starts with March/April/May 2023 (MAM since FMA is considered the near-term and is covered earlier in the presentation. The changes over time are generally discussed in the discussion but you can see the changes easier in the maps.
| I see a number of points in time where the pattern significantly changes and they are MJJ 2023, OND 2023, NDJ 2023-2024 and DJF 2023-2024 |
Comparing the new outlook with the prior Outlook,
The 12 temperature maps released last month.
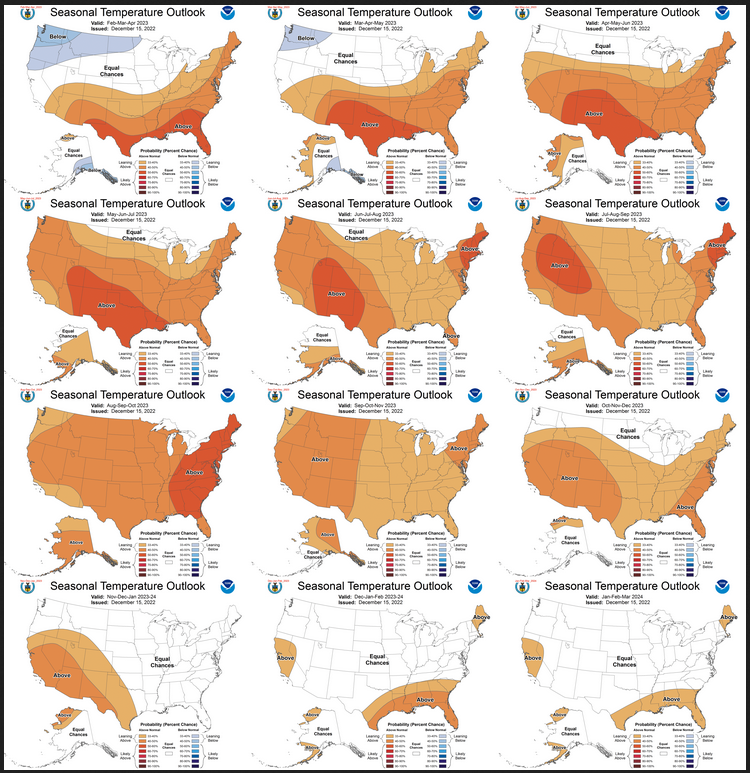
I have been showing the current set of outlooks with the prior set side by side. But I think the images are too small for most to be able to work with. I do the analysis so you do not need to but if you choose to do so the best way is to print out both maps. If you have a color printer that is great but not needed. What I do is number the images from last month 1 – 12 starting with “1” and going left to right and then dropping down one row. Then for the new set of images, I number them 2 – 13. That is because one image from last month in the upper left is now discarded and a new image on the lower right is added. Once you get used to it, it is not difficult. In theory, the changes are discussed in the NOAA discussion but I usually find more changes. It is not necessarily important. I identify the changes but believe it would make this article overly long to enumerate them. The information is here for anyone who wished to examine the changes.
Now the Twelve New Precipitation Maps
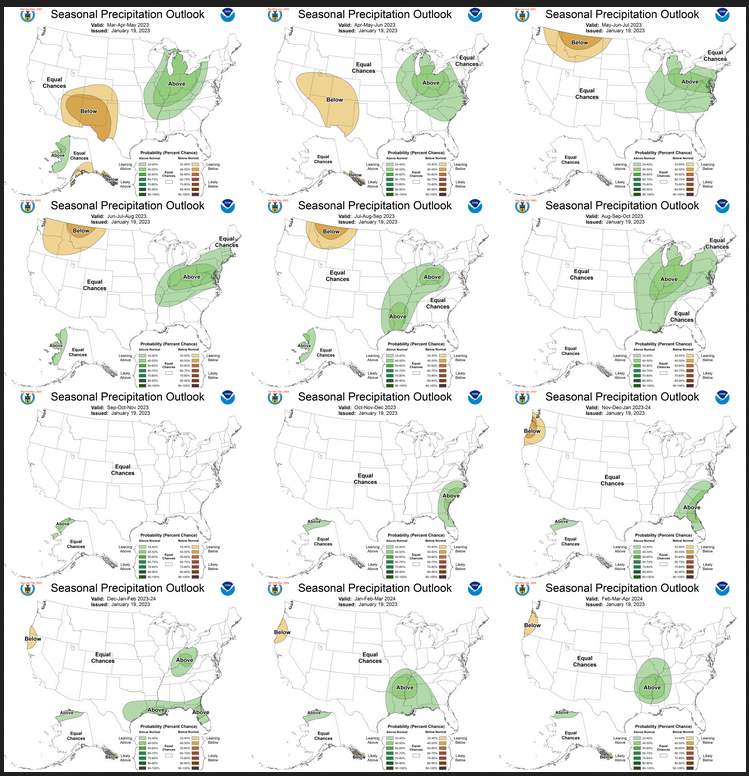
Similar to Temperature in terms of the organization of the twelve overlapping three-month outlooks.
| I see major changes at MJJ 2023, and starting at ASO 2023, the changes are continuous. |
Comparing the new outlook with the prior Outlook,
The maps that were released last month.
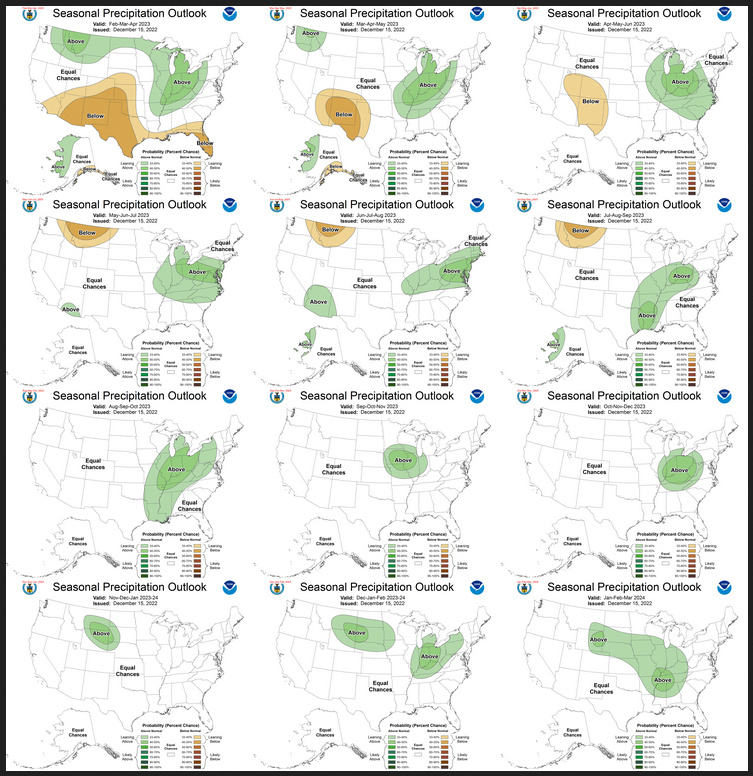
A good approach for doing this comparison is provided early with the temperature discussion. In terms of comparisons, the downgrading of the Southwest Monsoon from stronger than normal to normal is significant.
NOAA Discussion
Maps tell a story but to really understand what is going you need to read the discussion. I combine the 30-day discussion with the long-term discussion and rearrange it a bit and add a few additional titles (where they are not all caps the titles are my additions). Readers may also wish to take a look at the article we published last week on the NOAA ENSO forecast. That can be accessed here.
I will use bold type to highlight some things that are especially important. My comments, if any, are enclosed in brackets [ ].
CURRENT ATMOSPHERIC AND OCEANIC CONDITIONS
Below-average SSTs persisted across the equatorial central and eastern Pacific. Recent observed SST anomalies in the Niño 3.4 region are at -0.7 degrees Celsius (up from -1.0 degrees Celsius one month ago). Subsurface temperature anomalies (averaged from 180-100W and 0-300 meters) remained at near -0.2 degrees Celsius during the last month, continuing to reflect warmer subsurface temperatures than those observed in August to October of 2022. During the last two months, negative subsurface temperature anomalies weakened, but weak anomalies continue to reside near the surface of the central and east-central Pacific Ocean. Positive subsurface temperature anomalies mostly remain at depth in the western and central Pacific Ocean. Some positive anomalies are evident near the surface in the eastern Pacific Ocean. Positive OLR anomalies (suppressed convection and precipitation) continue over the equatorial west-central Pacific with weak negative OLR anomalies (enhanced convection and precipitation) throughout Indonesia and Southeast Asia. The tradewinds have weakened across the central Pacific, with sustained westerly anomalies as far east as 160E during January. Intraseasonal variability may cause a westward shift in the dividing line between westerly and easterly anomalies, but the weakening of La Nina should be accompanied by a slow eastward drift during the outlook period.
SST anomalies are positive over the North Pacific and near the Aleutians. Positive SST anomalies, present earlier in the fall along the West Coast, have moderated to near average. Positive SST anomalies persist over the Gulf of Mexico and along the East Coast with the largest anomalies offshore of the Mid-Atlantic and New England.
PROGNOSTIC DISCUSSION OF SST FORECASTS
The CPC SST consolidation forecast for Niño 3.4 depicts decreasing negative anomalies through the spring 2023 as a transition to ENSO-neutral conditions is predicted to occur. The inputs by the consolidation are tightly clustered through AMJ, after which some inputs suggest El Nino conditions and others remain in the ENSO-neutral phase, though on the positive side. The North American Multi-Model Ensemble (NMME) ensemble mean forecast is similar to the CPC consolidation. Based on the latest observations and model forecasts, the CPC official ENSO outlook indicates a 73 percent chance for ENSO-neutral during FMA and a 82 percent chance during MAM. ENSO-neutral conditions are the most likely outcome through JJA, after which El Niño becomes the most likely category.
30-DAY OUTLOOK DISCUSSION FOR FEBRUARY 2023
The February 2023 outlooks are issued against the backdrop of an ongoing La Niña event and a weakening Madden Julian Oscillation (MJO) signal. The latest Niño 3.4 weekly sea surface temperature (SST) departures stood at -0.7 degrees Celsius. During the last two months, negative subsurface temperature anomalies weakened, but weak anomalies continue to reside near the surface of the central and eastern Pacific Ocean. Meanwhile, the magnitude of the Real-time Multivariate (RMM) based MJO index has weakened and has become quasi-stationary over the Western Hemisphere during the past week. However, there is general agreement on the development of a well organized and potentially robust Indian Ocean MJO event during the next two weeks. Farther to the north, across the extratropics of the Northern Hemisphere, the Arctic Oscillation (AO) has been predominantly negative during early January while the North Atlantic Oscillation (NAO) has generally been positive. Meanwhile, the Pacific North America (PNA) index has exhibited a weakening positive signal and has switched to the negative phase during the past few days. Combined natural analog composites derived from the recent evolution of equatorial Pacific, MJO, and extratropical indices depict a 500-hPa flow pattern for the month of February dominated by below normal heights across the Northern Plains. Anomalous ridging is generally favored over the eastern North Pacific and across the southeastern Contiguous United States (CONUS). Trends during the last 15 years favor above normal heights across most of Alaska and the southeastern CONUS and below normal heights over the Northern Plains during the month of February. Natural analog composites, trends , dynamical guidance from the Copernicus Climate Change Service (C3S), North American Multi-Model Ensemble (NMME), and the Coupled Forecast System Version 2 (CFSv2), as well as input from the Climate Prediction Center (CPC) Weeks 3 and 4 Outlooks form the basis of the February outlooks. Antecedent conditions such as extratropical SSTs, sea ice extent, and snow cover anomalies were also considered where appropriate.
Temperature
Below normal temperatures are favored for the Alaska Panhandle, the Pacific Northwest, and Northern California eastward to the Northern Plains, consistent with dynamical model guidance from the CFSv2 and with anomalous troughing depicted by natural analog composites and trends across the north-central CONUS. Conversely, dynamical model guidance supports enhanced above normal temperature probabilities across the Southeast, extending northward to southern New England and westward to parts of the Southern Plains. The highest probabilities of above normal temperatures (greater than 50 percent chances) are indicated for the Florida Peninsula northward to coastal areas of South Carolina, associated with anticipated anomalous ridging. Above normal temperatures are also favored for northern and western Alaska, consistent with dynamical model guidance and with current below normal sea ice extent, above normal sea surface temperatures in ice-free regions, and recent trends . Equal chances (EC) of above, near, and below normal temperatures are indicated across the southwestern CONUS, Central Plains, much of the Great Lakes, parts of the Northeast, and much of Mainland Alaska due to weak or conflicting dynamical and statistical guidance.
Precipitation
Dynamical and statistical guidance are in good agreement in depicting increased chances of above normal precipitation across the Ohio Valley, Great Lakes, and much of the Middle and Upper Mississippi Valley, associated with an anticipated enhanced baroclinic zone. Below normal precipitation is favored farther to the south, across much of the Southeast, consistent with predicted mean anomalous ridging. Increased chances of below normal precipitation extend westward along much of the southern tier of the CONUS due to good agreement among NMME, CFSv2, and C3S guidance. Conversely, a tilt toward above normal precipitation is indicated along most of the Northern Tier of the CONUS where dynamical model guidance is in general agreement. Above normal precipitation is also favored across parts of western Mainland Alaska, where natural analog composites depict enhanced moist southwesterly mid-level flow. EC of above, near, and below normal precipitation are indicated from California eastward to much of the Central and Southern Plains, parts of the Lower Mississippi Valley and Southeast, coastal areas of the Mid-Atlantic and Northeast, and for much of Alaska due to weak or conflicting dynamical and statistical guidance.
SUMMARY OF THE OUTLOOK FOR NON-TECHNICAL USERS (Focus on February, March, April 2023)
Temperature
The February-March-April (FMA) 2023 temperature outlook favors below-normal temperatures across the Pacific Northwest, northern California, portions of the Great Basin, the northern Rockies, and the northern Great Plains. Below-normal temperatures are also favored for southeastern Alaska. Above-normal temperatures are more likely for the southern and eastern contiguous United States (CONUS) along with parts of northwestern Alaska, southwest mainland Alaska, and the Aleutians.
Precipitation
The FMA 2023 precipitation outlook depicts elevated probabilities for above-normal precipitation for the Pacific Northwest, northern Rockies, parts of the northern Great Plains, and from the Great Lakes southward to the Tennessee Valley. Below-normal precipitation is favored for southern California, the Southwest, the central to southern Great Plains, the Gulf Coast, and parts of the Southeast.
Areas depicted in white and labeled “Equal-Chances” or “EC” are regions where climate signals are weak and so there are equal chances for either above-, near- or below-normal seasonal mean temperatures and total precipitation amounts.
BASIS AND SUMMARY OF THE CURRENT LONG-LEAD OUTLOOKS
PROGNOSTIC TOOLS USED FOR U.S. TEMPERATURE AND PRECIPITATION OUTLOOKS
The temperature and precipitation outlooks for FMA 2023 were based on dynamical model guidance such as the NMME and statistical tools, including the global SST based Constructed Analog (CA), Canonical Correlation Analysis (CCA), experimental Calibration, Bridging, and Merging (CBaM), relationships to ENSO, and trends . The objective, historical skill weighted consolidation was a major tool used in the outlooks, and that includes the ENSO/OCN tool and a complete suite of statistical and dynamical tool combinations. Although a transition to ENSO-neutral is favored during the early forecast lead times, La Niña composites were used during FMA as the atmospheric response to La Niña is expected to linger through the late winter or early spring. Land surface conditions, including an expectation of dry soil moisture heading into the spring for the central to southern Great Plains and anomalous snowpack across the western CONUS and northern Plains, played a role in the temperature outlooks during the 2023 spring and summer seasons. Long-term climate trends were considered for all leads, but were relied upon more heavily from the summer 2023 through FMA 2024.
PROGNOSTIC DISCUSSION OF OUTLOOKS – FMA 2023 TO FMA 2024
TEMPERATURE
Elevated probabilities of above-normal temperatures during FMA 2023 are forecast across the southern and eastern CONUS. This favored area of above-normal temperatures is supported by the calibrated NMME, CBaM, and consolidation tool. Probabilities for above-normal temperatures exceed 50 percent across the Southeast and Rio Grande where the consolidation has the strongest warm signal and ENSO correlations are relatively high. Coverage and probabilities for above-normal temperatures across the southern Great Plains are tempered by concerns of Arctic air outbreaks through February and March.Elevated odds for below-normal temperatures from the Pacific Northwest to Northern Great Plains are based on model output, relationships with Nino3.4, and trends . Trends would favor below-normal temperatures across the Central Plains, but low soil-moisture and model forecasts for above normal temperatures increase uncertainty. Snow depths ranging from 100-228 percent of normal slightly favor a colder start to the FMA period across California and parts of the Great Basin. Dynamical and statistical tools support increased probabilities of below-normal temperatures for southeastern Alaska with above-normal temperatures favored for the Aleutians, southwest mainland Alaska, and parts of northern Mainland Alaska. Coastal areas of Alaska, where SSTs are above normal are most likely to experience above-normal temperatures.
The temperature outlook for FMA 2023 (compared to the previous month release) contains a slight increase in the odds for below-normal temperatures across the northern Great Plains, Northern California, and parts of the Great Basin. Corresponding to the increased odds for below-normal temperatures across the northern Great Plains, odds for above-normal temperatures are slightly reduced across the central and southern Great Plains. That slight shift toward a colder outlook is carried through MJJ. From MJJ to JAS, odds for above-normal temperatures across the central Rockies, Great Basin, and portions of the Pacific Northwest are increased relative to the prior set of outlooks. From SON onward, the outlooks reflect the statistical consolidation that includes trends, SST-CA, and the anticipated impact of the predicted state of ENSO.
EC is forecast for areas of the CONUS where temperatures are expected to be most variable during this three-month period. It should be noted that subseasonal variability related to the MJO and Arctic Oscillation (AO) are expected to influence the circulation pattern and temperatures this winter.
PRECIPITATION
Dynamical model guidance and statistical tools continue to depict a La Niña related precipitation pattern through FMA 2023. Impacts on the primary storm track and precipitation due to La Niña are forecast to linger even if negative SST anomalies across the equatorial central Pacific begin to weaken. Updated outputs from the guidance listed above resulted in decreased odds for below-normal precipitation across eastern Texas and the Gulf Coast, with increased odds for above-normal precipitation across the Tennessee Valley. Calibrated model guidance also increased uncertainty across portions of central California, so some of that area was changed to EC during FMA. The outlook for Alaska during FMA has not changed.
The outlook for MAM was updated to remove the area of enhanced odds for above-normal precipitation across the Northern Rockies as trends and relationships with SSTs no longer favor above-normal precipitation. During AMJ, odds for below-normal precipitation were increased across the Great Basin and the Alaska Panhandle, reflecting the 4 statistical tools and dynamical model guidance (NMME, CBaM). Enhanced odds for above-normal precipitation was also removed from the Southwest during MJJ and JJA, as a shift to El Nino can inhibit the monsoon. From SON 2023 to FMA 2024, the outlooks were adjusted to reflect the latest output of the skill based consolidation, which includes the predicted state of ENSO according to the SST consolidation, trends , CCA, and SST-CA.
Review of the ENSO Assumptions utilized by NOAA (CPC) in Preparing this Four-Season Outlook
It is useful to review the ENSO forecasts used by NOAA to produce this Four-Season Outlook. We reported on that last week and you can read that article by clicking HERE
The key information used by NOAA follows.
IRI CPC ENSO STATE Probability Distribution (IRI stands for the International Research Institute for Climate and Society)
Here are the new forecast probabilities. This information is released twice a month and the first release is based on a survey of Meteorologists, the second is based on model results. The probabilities are for three-month periods e.g. NDJ stands for November/December, January. I am just showing the first release which is what we have and presumably what NOAA (actually their CPC Division) worked from.
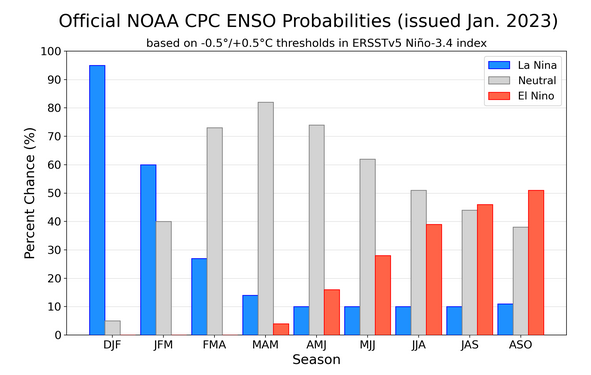
| Notice for JFM 2023 the probability of La Nina and ENSO Neutral are almost equal. But for FMA, the probability for ENSO Neutral greatly exceeds that for La Nina. So maybe March (the midpoint of the FMA three-month period) is when the ocean conditions will be consistent with ENSO Neutral but the impact on our weather may lag a month or so. So we really seem to be looking at La Nina into Spring.
It is early but the probabilities shown for JJA 2023 year are very interesting. Are we headed for El Nino? It would be unusual to transition so quickly. |
Tropical Subsurface Temperature Anomalies
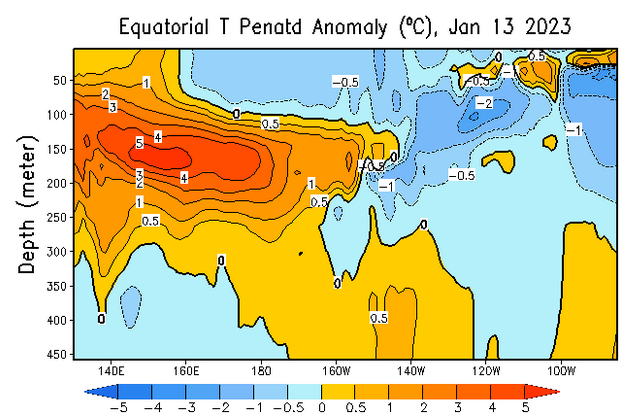
| You can update this graphic by clicking HERE and scrolling down to “Mean and anomalous equatorial temperatures” . You can see the anomalously warm water at depth undercutting the anomalously cool water but I still am not convinced the meteorologists have the timing of the demise of La Nina correct. I hope they have it correct. |
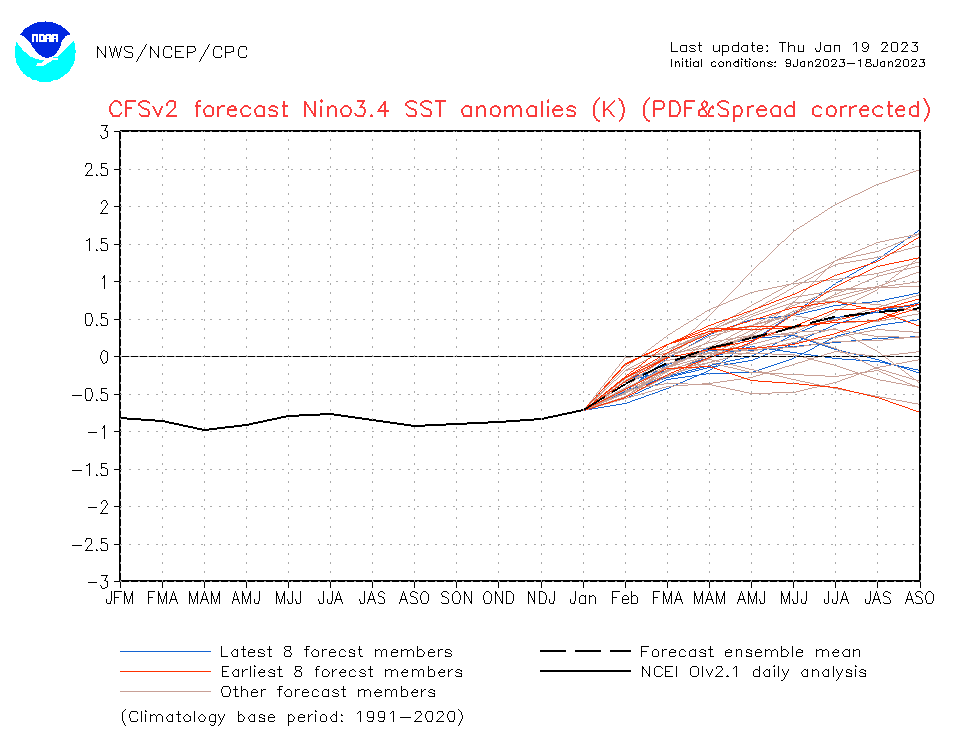
| The image will update if you click HERE. https://www.cpc.ncep.noaa.gov/products/people/wwang/cfsv2fcst/images3/nino34SeaadjPDFSPRDC.gif This model shows La Nina ending a month earlier than the IRI/CPC assessment.
NOAA used to rely more on the IRI Forecast but now that CPC seems to have taken more control over IRI it is not totally clear how they determine their ENSO forecast. But it is pretty much evident in the NOAA Discussion and the set of 12 three-month maps they provide and which are shown in this article. I assume it takes them a couple of days to produce their Seasonal Outlook so it is always difficult to know the exact date of the data they utilized. |
Resources
The link for the drought outlook map and some discussions that come with the map can be found by clicking HERE.
| I hope you found this article useful and interesting. |