This post examines the existence of noise in the Fed Funds Rate and CPI Inflation data 1951 and 2024.1

Photo by Serhii Tyaglovsky on Unsplash
Introduction
The 73 years from 1951 to 2024 are divided into three types of inflationary behavior:2
- Significant inflation increases;
- Significant inflation decreases;
- No significant inflation changes.
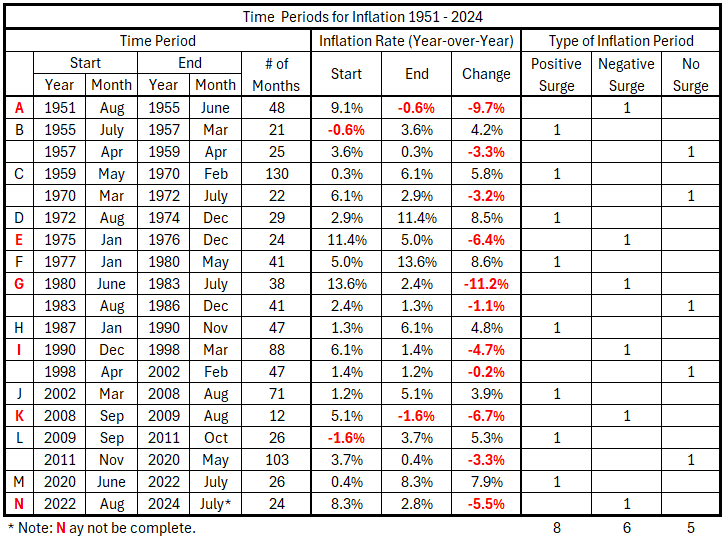
An inflation change is significant if it is ≥4.0% with no intervening countertrend change >1.5%. Previously, we defined the partitioning of inflation into the pattern in Table 1.
Table 1. Timeline of Inflation Data 1951-2024 (Previously Table 2.2)
Previously,1 a data set was found for which one of the variables (the Fed Funds Rate) had no meaningful change while a significant increase occurred in CPI Inflation. A strong correlation was measured between the two variables even though there was no meaningful change in one of them. The correlation was determined by “noise,” small fluctuations in about the unchanged value of one variable. We will examine this in detail in this post.
Data
The data is from tables prepared previously.3 There are 49 monthly timeline alignments:
- Fed Funds Rate and CPI Inflation months are coincident.
- Fed Funds Rate leads and lags CPI Inflation by one month (±1 month)
- Fed Funds Rate leads and lags CPI Inflation by two months (±2 months)
- …
- Fed Funds Rate leads and lags CPI Inflation by 24 months (±24 months)
The specific data for detailed examination is for the Fed Funds Rate (FFR) and CPI Inflation from June 2009 to July 2011.1
Analysis
Example of Noise Overwhelming Calculated Correlation
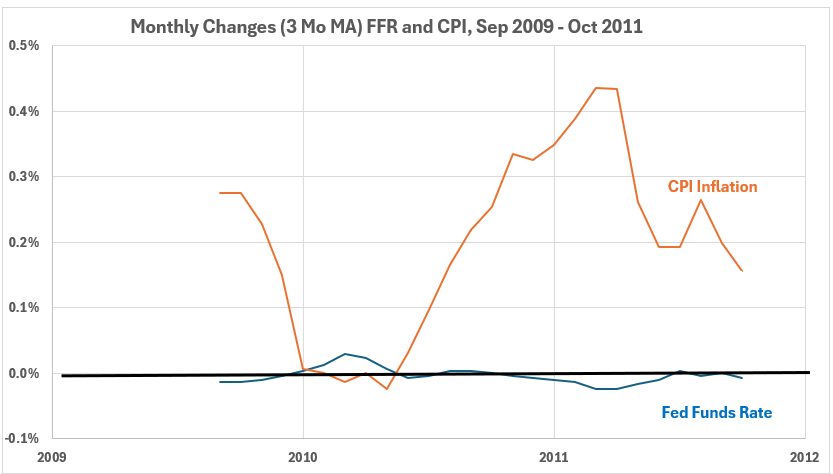
From September 2009 to October 2011, CPI inflation increased from -1.6% to +3.7%, a rise of 5.3%, or by a different calculation, from -2.3% to +5.6%, a rise of 5.7%.3 During these 26 months, the Fed made no change in interest rates. The Fed Funds Rate remained at 0-0.25% the entire time.4 However, there were minor variations within the range. The monthly values ranged from 0.07% to 0.20%. The monthly changes ranged from -0.02% to +0.04%. In Figure 1, the change for each month is the 3-month-moving average, and the range is -0.02% to +0.03%.
Figure 1. Fed Funds Rate and Inflation Sep 2009 – Oct 2011
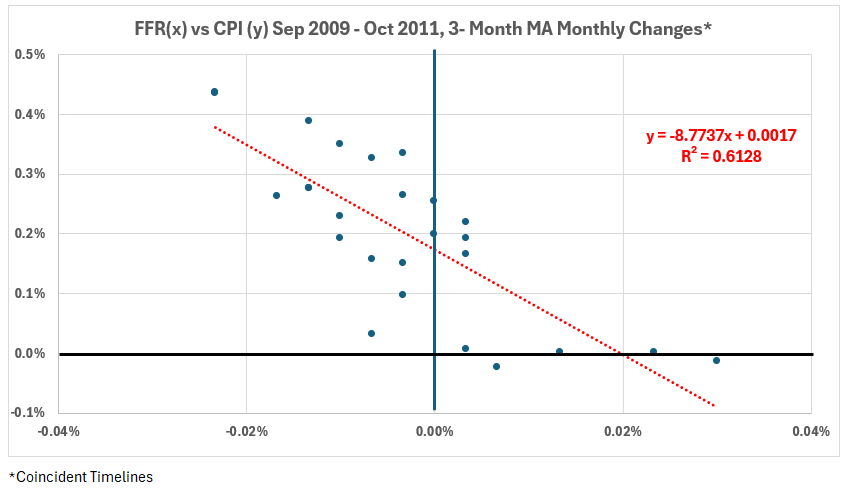
Despite the Fed Funds Rate remaining unchanged during the 26 months, there is a strong negative correlation between changes in the FFR and the CPI, as shown in Figure 2.
Figure 2. Monthly Changes in Fed Funds Rate (x) vs. CPI Inflation (y) Sep 2009 – Oct 2011
Let us disaggregate the correlation. See Figure 3.
Figure 3. Disaggregation of Fed Funds Rate and Inflation Sep 2009 – Oct 2011
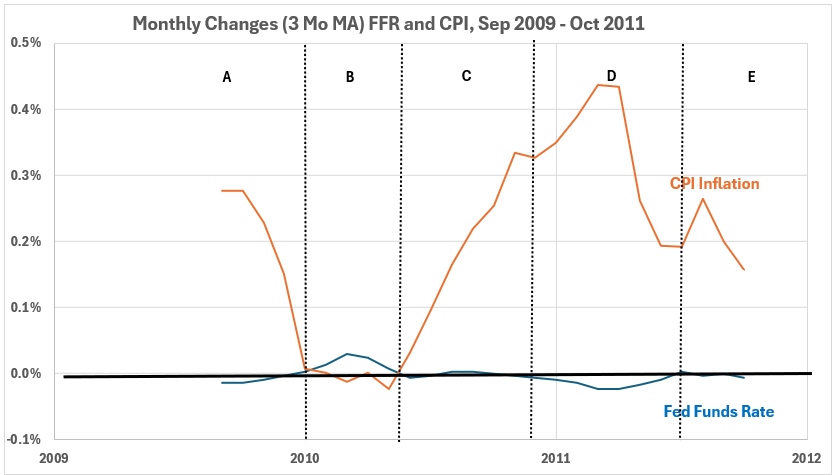
Separating the two periods (B and D) where the deviations occurred from the average for FFR over the 26 months defines five periods, A through E. The first period with minor FFR deviations, B, also has a series of CPI readings with negligible change. The second period, D, covers a time when significant changes occurred in CPI.
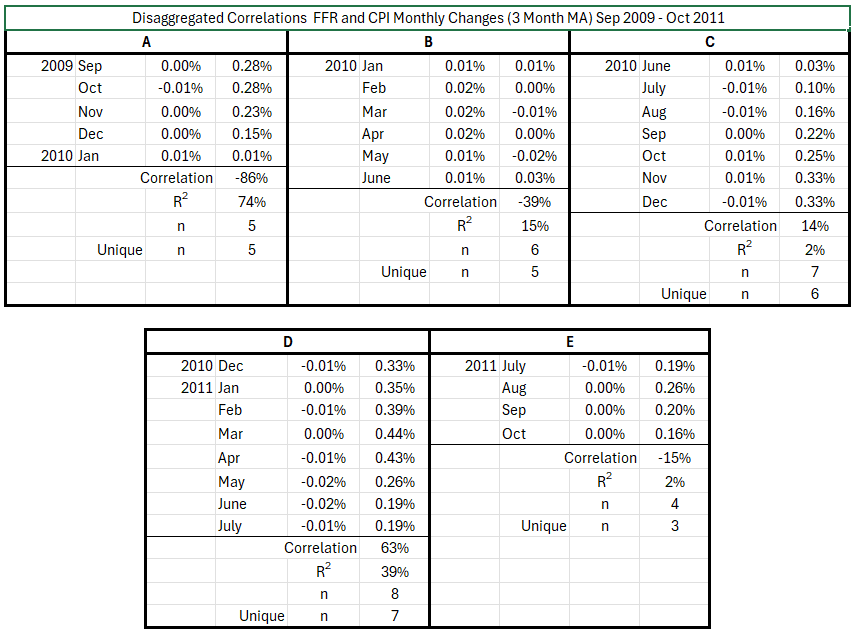
Table 2 shows the disaggregated correlations.
Table 2. Disaggregated Correlations between FFR and CPI Monthly Changes (3 Month MA) Sep 2009 – Oct 2011
This data shows one reason correlation does not necessarily represent cause and effect. Here, we see that correlation varies widely across subsets of the total data set. The strongest correlation occurs in period A. CPI showed a meaningful decline in that interval, but the FFR data only showed noise. Interval D shows a moderate correlation for meaningful changes in CPI but only noise in the FFR data. And, of course, Figure 2 shows a strong association between FFR and CPI for the entire 26 months when FFR is unchanged except for noise fluctuations the entire time: R = –78% and R2 = 61%.
Effective Noise Limitation
The observations of the spurious results obtained with monthly changes in variables such as FFR and CPI make it imperative to find a way to remove or minimize the effects of data noise from the calculations. Previously (formerly Figure 12), data was smoothed using 3-month moving averages for each month. This is shown in Figure 4.
Figure 4. Fed Funds and CPI Monthly Changes (3-Month Moving Averages) 1954 – 2024
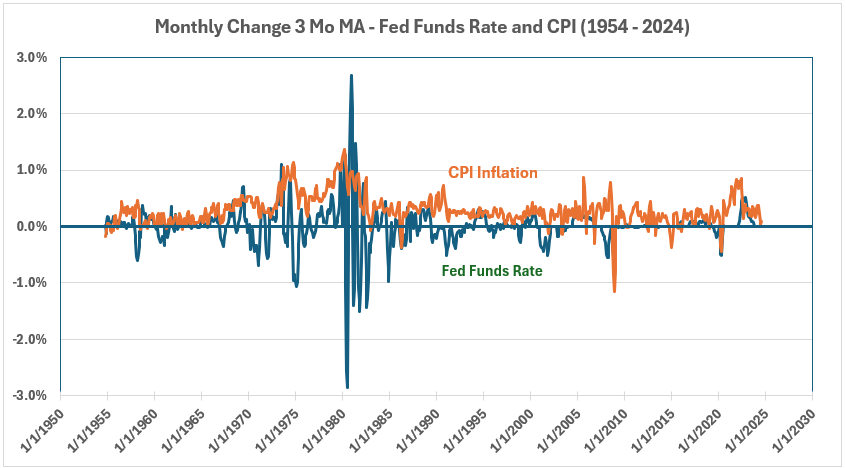
But is this the correct smoothing factor?
Figure 5. Data Smoothing Fed Funds Rate Monthly Changes Jan 1979 – Dec 1982
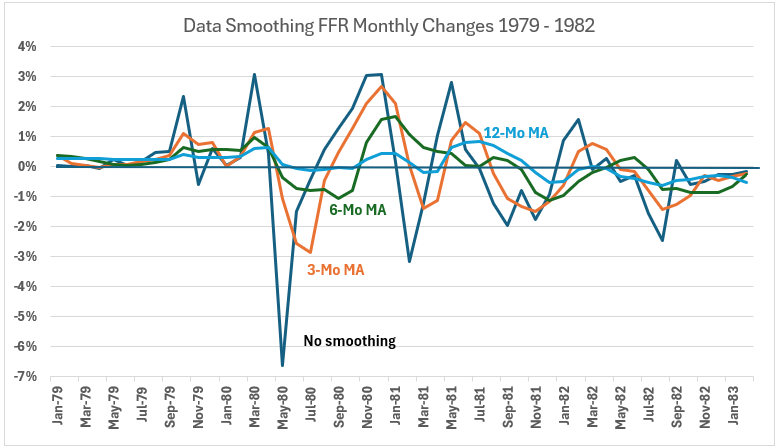
In Figure 5, the unsmoothed data has significant noise differences from the three smoothed data options. This suggests that smoothing the data is the correct decision. However, would smoothing more than a 3-month moving average lose useful information?
The method used to define the inflation surges used the monthly year-over-year changes in CPI with 3-month moving average data. That result (previously Figure 32) is in Figure 6.
Figure 6. Twelve-Month CPI Inflation Every Month (3-Mo MA), 1951 – 2024
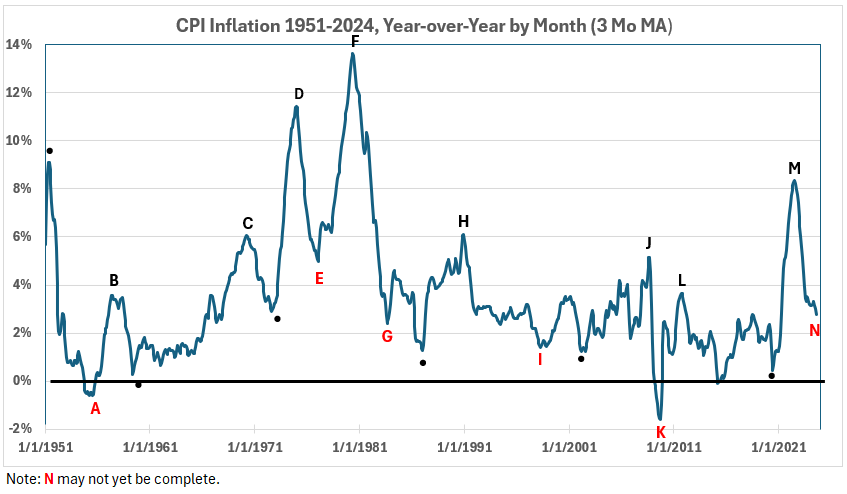
Figure 6 shows some fluctuation, but it mainly does not occur during significant moves in CPI. This indicates that using monthly year-over-year changes to study correlations might reduce the noise problem experienced using the monthly changes themselves.
Conclusion
Next week, we will look more closely at the process of using monthly year-over-year changes to evaluate associations between changes in the Fed Funds Rate and CPI inflation.
Footnotes
1. Lounsbury, John, “Fed Funds Rate and Inflation. Part6,” EconCurrents, November 24, 2024. https://econcurrents.com/2024/11/24/fed-funds-rate-and-inflation-part-6/.
2. Lounsbury, John, “Fed Funds Rate and Inflation. Part 1 – Corrected,” EconCurrents, October 13, 2024. https://econcurrents.com/2024/10/13/fed-funds-rate-and-inflation-part-1-corrected/.
3. Lounsbury, John, “Fed Funds Rate and Inflation. Part 2 – Corrected,” EconCurrents, October 20, 2024. https://econcurrents.com/2024/10/20/fed-funds-rate-and-inflation-part-2-corrected/.
4. Federal Reserve Economic Data, Federal Funds Effective Rate, Percent, Monthly, Not Seasonally Adjusted. Data downloaded September 18, 2024. https://fred.stlouisfed.org/series/FEDFUNDS.
