This post continues the analysis of the Fed Funds Rate’s behavior during the positive inflation surges between 1951 and 2024.2,3 Specifically, we look at the most recent inflation of the 21st century.
Marriner S. Eccles Federal Reserve Board Building, Wikipedia,
Creative Commons Attribution-Share Alike 3.0 Unported license.
Introduction
The 73 years from 1951 to 2024 are divided into three types of inflationary behavior:1
- Significant inflation increases;
- Significant inflation decreases;
- No significant inflation changes.
An inflation change is significant if it is ≥4.0% with no intervening countertrend change >1.5%.
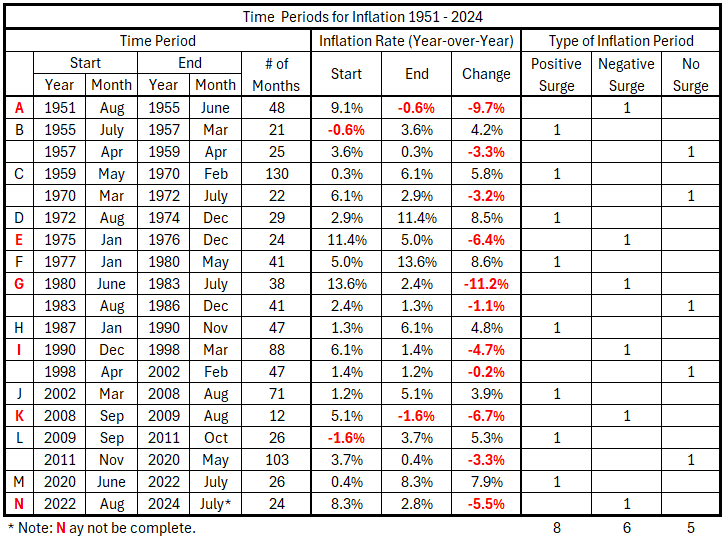
Previously, we defined the partitioning of inflation into the pattern in Table 1.
Table 1. Timeline of Inflation Data 1951-2024 (Previously Table 2.1)
Data
The data is from tables prepared previously.1
There are 49 monthly timeline alignments:
- Fed Funds Rate and CPI Inflation months are coincident.
- Fed Funds Rate leads and lags CPI Inflation by one month (±1 month)
- Fed Funds Rate leads and lags CPI Inflation by two months (±2 months)
- …
- Fed Funds Rate leads and lags CPI Inflation by 24 months (±24 months)
Analysis
Sep 2009 – Oct 2011
This period of rising inflation has a feature that no other inflation surge has had in the past 73 years: The Federal Reserve did not raise interest rates in response. The inflation surge started from a deflationary starting point: Y-o-Y inflation was –1.6% in September 2009. The peak inflation rate was 3.7% 26 months later.
Figure 1. Fed Funds Rate and Inflation Sep 2009 – Oct 2011
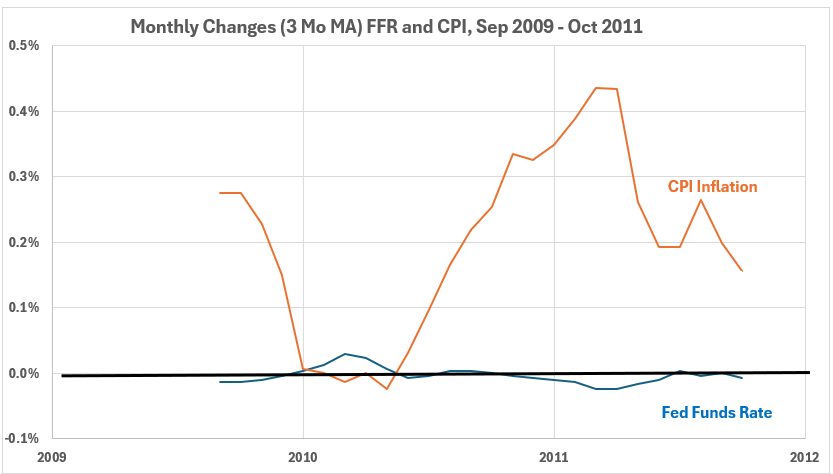
Figure 2. Monthly Changes in Fed Funds Rate (x) vs. CPI Inflation (y) Sep 2009 – Oct 2011
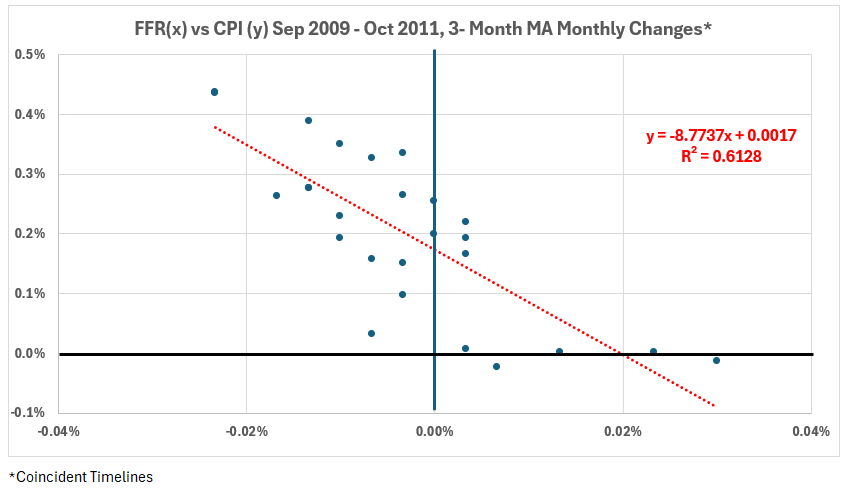
The scatter diagram in Figure 2 shows a strong negative correlation between Fed Funds Rate changes and CPI inflation changes. This would strongly indicate that raising the Fed Funds Rate might lower inflation. There is only one problem: The Fed did not raise rates. This is discussed in the Conclusion below.
Figure 3. Correlation Between Fed Funds Rate and CPI Inflation Sep 2009 – Oct 2011
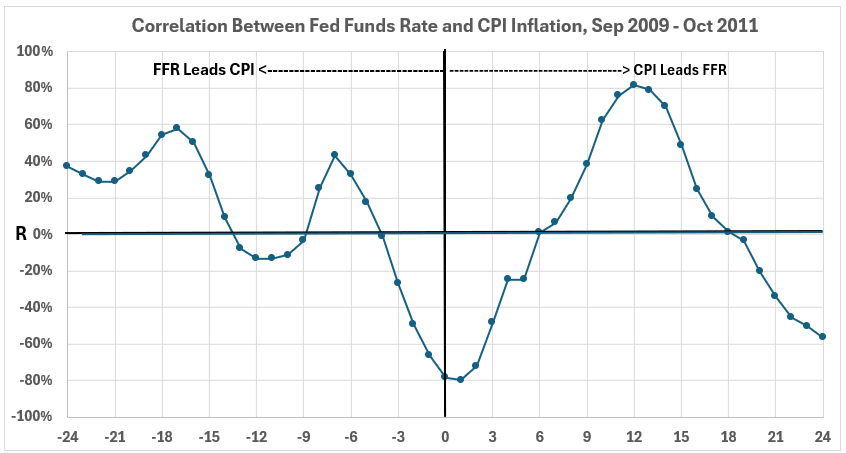
Figure 3 shows moderate and strong positive associations between FFR and CPI away from the coincident and near-coincident data, where there are strong negative correlations. What does this mean when the Fed did not change interest rates during this period? See the discussion in the Conclusion below.
Jun 2020 – Jul 2022
Figure 4. Fed Funds Rate and Inflation Jun 2020 – Jul 2022
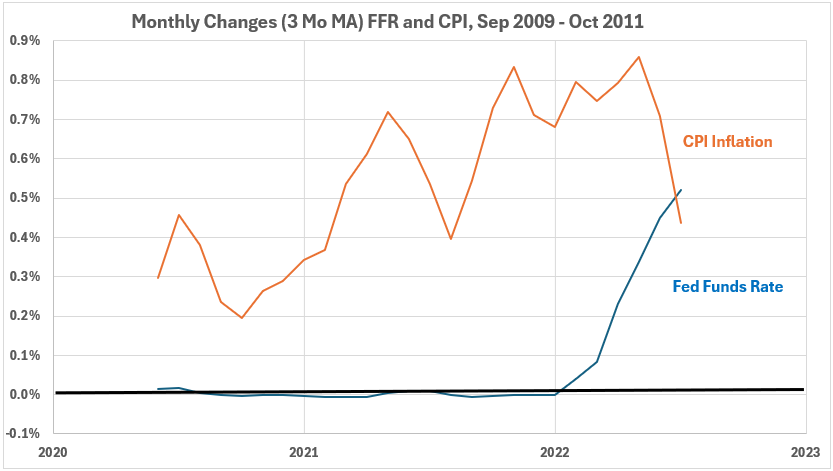
The Fed waited until CPI inflation had been underway for 20 months before raising interest rates. The rate increases starting in February preceded the top of the inflation surge in May.
In Figure 3, we see more volatility in CPI for 2003 than for the rest of the period. The FFR changes were essentially zero, with a few negative months until they became positive in the middle of 2004.
Figure 5. Monthly Changes in Fed Funds Rate (x) vs. CPI Inflation (y) Jun 2020 – Jul2022
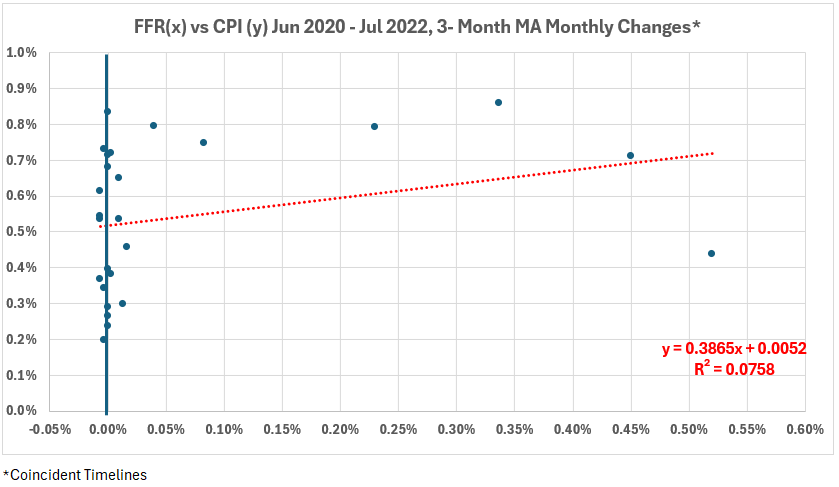
The scatter plot data in Figure 5 is not pretty, with a blob of points on the left side. R = 28% and R2 = 8%. The ugly distribution reflects the Fed’s delayed interest rate action until the CPI inflation was well underway.
Figure 6. Correlation Between Fed Funds Rate and CPI Inflation Jun 2020 – Jul 2022
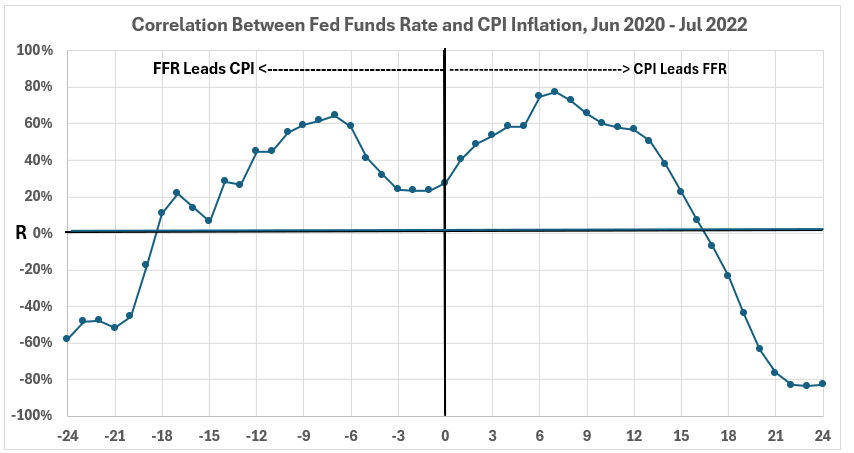
In Figure 6, there are several moderate positive correlation points for CPI changes 6, 7, 8, 9, and 10 months following FFR changes (left side of the graph). On the right are nine moderate or strong correlation points for FFR following CPI changes by 2 to 13 months. The three strong correlations occur at 6, 7, and 8 months.
Conclusion
Figure 4 shows a clear association between the Fed starting to raise interest rates in February 2022 and the peak of CPI inflation in May. This is the best example of possible cause-and-effect for any of the inflation surges in the last 73 years. However, such a result is not shown in Figure 6. For a discussion on why this could be, see the following paragraphs.
However, the period from Sep 2009 to Oct 2011 raises an important question. During that period, the Fed Funds Rate target was unchanged. The variations in the effective rate were within the range of –0.02% to +0.03%. This is noise on the scale of Fed Funds Rate target changes (usually 0.25% or 0.50%) and the CPI changes, often an order of magnitude higher than the noise. Yet, we have a significant negative correlation between FFR and CPI. The visually evident dominant contributions to this in Figure 1 are the two periods: Jan to May 2010 and Nov 2020 to May 2011. Let’s consider each of these individually:
- Jan to May 2010: The variations in FFR and CPI are in the noise range of a very few hundredths of a percent. Yes, a strong (significant) negative correlation is visually apparent, but what is the significance of noise correlation?
- Nov 2001 to May 2011: Here, the changes at the top of the CPI inflation cycle are much above the noise level, but the dip in the FFR rate is entirely just noise. This produces a visually apparent negative correlation. However, there is no basis for considering that noise in FFR can have a meaningful association with a change in CPI far greater than noise.
The observations above may send this entire study back to square one. How much of the correlations we have determined have been influenced by noise (both positively and negatively), and how much by changes that are significantly greater than noise? This question will be explored next week.
Footnotes
1. Lounsbury, John, “Fed Funds Rate and Inflation. Part 2 – Corrected,” EconCurrents, October 20, 2024. https://econcurrents.com/2024/10/20/fed-funds-rate-and-inflation-part-2-corrected/.
2. Lounsbury, John, “Fed Funds Rate and Inflation. Part 1 – Corrected,” EconCurrents, October 13, 2024. https://econcurrents.com/2024/10/13/fed-funds-rate-and-inflation-part-1-corrected/.
3. Lounsbury, John, “Fed Funds Rate and Inflation. Part 5,” EconCurrents, November 17, 2024. https://econcurrents.com/2024/11/17/fed-funds-rate-and-inflation-part-5/.
4. Lounsbury, John, “Quantity of Money and Inflation. Part 1. General Considerations,” EconCurrents, July 7, 2024. https://econcurrents.com/2024/07/07/quantity-of-money-and-inflation-part-1-general-considerations/.