This post continues the analysis of the Fed Funds Rate’s behavior during the positive inflation surges between 1951 and 2024.2 Specifically, we look at the inflation of the 1960s.
From a photo by Giorgio Trovato on Unsplash
Introduction
The 73 years from 1951 to 2024 are divided into three types of inflationary behavior:1
- Significant inflation increases;
- Significant inflation decreases;
- No significant inflation changes.
An inflation change is significant if it is ≥4.0% with no intervening countertrend change >1.5%.
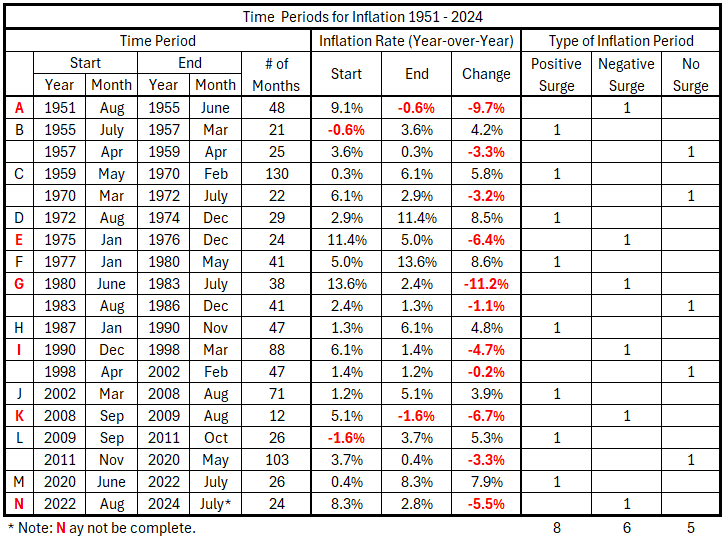
Previously, we defined the partitioning of inflation into the pattern in Table 1.
Table 1. Timeline of Inflation Data 1951-2024 (Previously Table 2.1)
Data
The data is from tables prepared previously.1
There are 49 monthly timeline alignments:
- Fed Funds Rate and CPI Inflation months are coincident.
- Fed Funds Rate leads and lags CPI Inflation by one month (±1 month)
- Fed Funds Rate leads and lags CPI Inflation by two months (±2 months)
- …
- Fed Funds Rate leads and lags CPI Inflation by 24 months (±24 months)
Analysis
May 1959 – Dec. 1964
The decade-long inflation rise of the 1960s has been divided into two analytical parts because the first part had a slower inflation increase than the second.
Figure 1. Fed Funds Rate and Inflation May 1959 – Dec. 1964
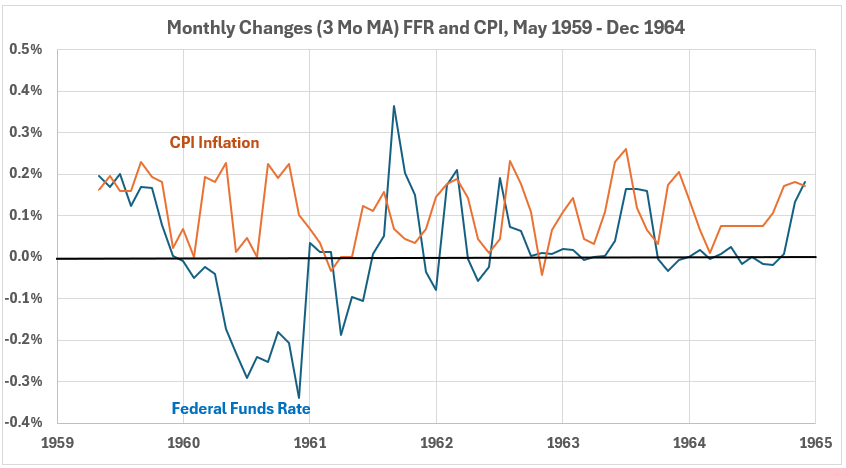
In 1960, the Fed Funds Rate was lowered quite aggressively, while the CPI varied from no change to as much as 0.2% monthly. For the next four years, both varied within nearly similar ranges. There was no consistent behavior of positive or negative associations. Examples of both can be found, as well as times when the associations appear small.
Figure 2. Monthly Changes in Fed Funds Rate (x) vs. CPI Inflation (y) May 1959 – Dec. 1964
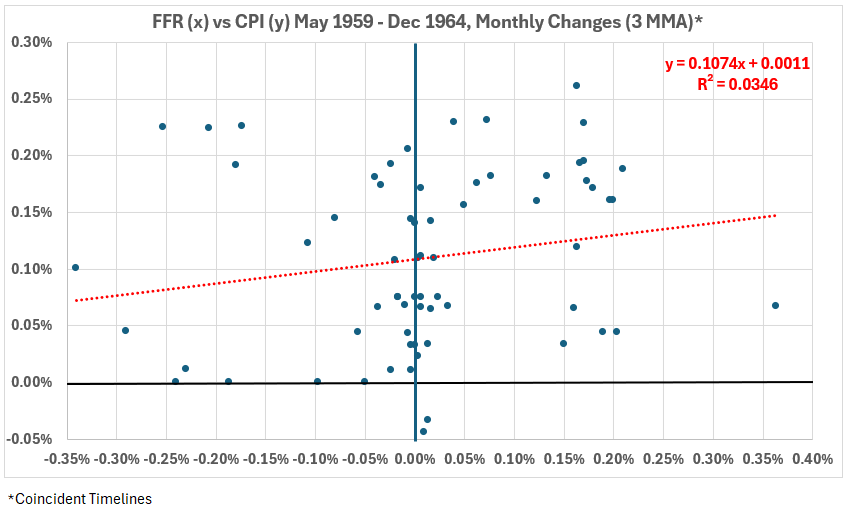
Figure 2 shows the coincident timeline data with somewhat random scattering. The trendline has a positive slope, with R = 18.6% and R2 = 3.5%. This is a very weak correlation.
Figure 3. Correlation Between Fed Funds Rate and CPI Inflation May 1959 – Dec. 1964
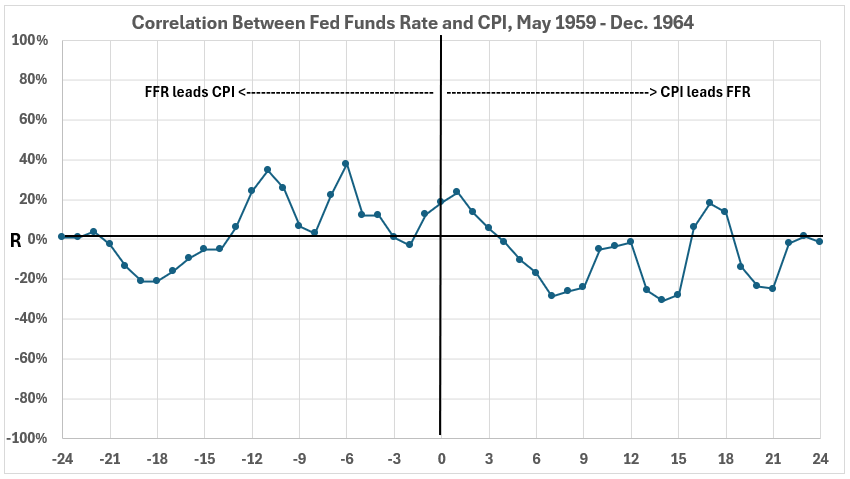
The correlations are weak or negligible across the entire 48-month timeline offset range. There is little association between changes in the Fed Funds Rate and CPI over these five plus years.
Jan. 1965 – Dec. 1969
Figure 4. Fed Funds Rate and Inflation Jan. 1965– Dec. 1969
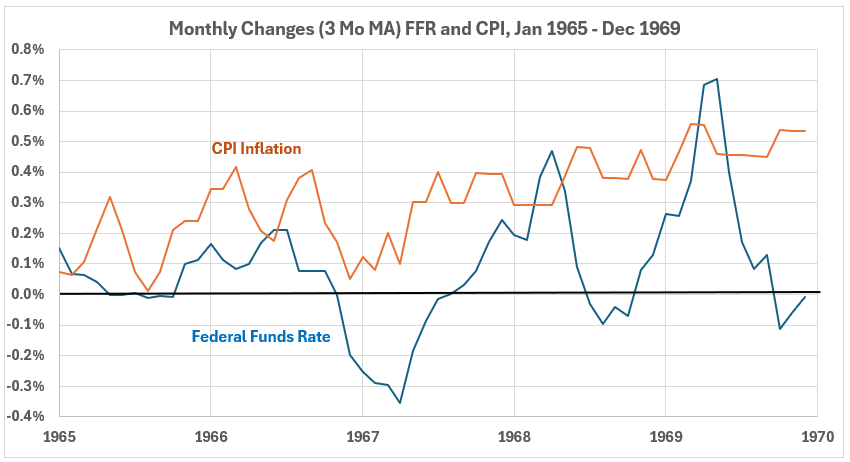
In Figure 4, the changes in the Fed Funds Rate trended down for 1965, 1966, and early 1967. Then, they trended up. Meanwhile, changes in CPI had a near-flat trend over the same early period of 1965-67, and then they trended up. Volatility is notable. CPI volatility was high for 1965-66 and then was noticeably less. The Fed Funds rate volatility patterns were just the opposite – lower 1965-66 and later much greater.
Figure 5. Monthly Changes in Fed Funds Rate (x) vs. CPI Inflation (y) Jan. 1965 – Dec. 1969
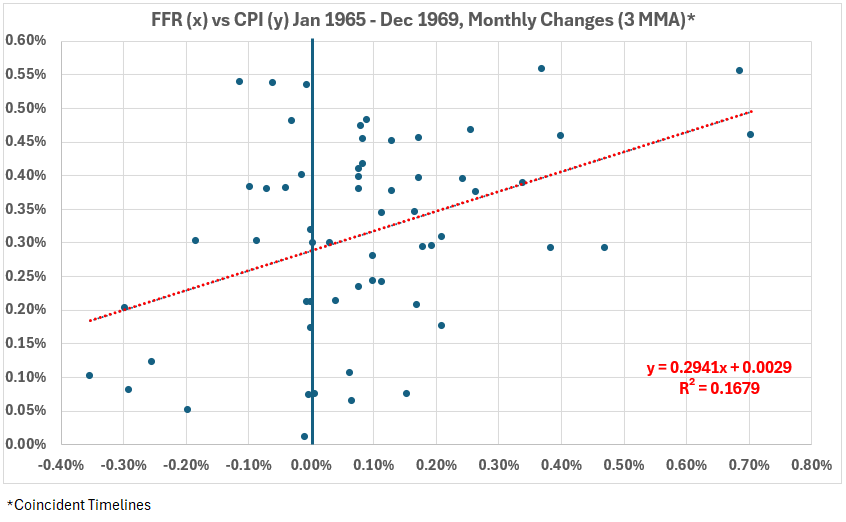
Figure 5 has the general appearance of a rather random scatter. However, in contrast to Figure 2, the correlation numbers are stronger: R = 41% and R2 = 17%. The correlation is still weak but approaches the boundary of moderate, which starts at R = 50%.
Figure 6. Correlation Between Fed Funds Rate and CPI Inflation Jan. 1965 – Dec 1969
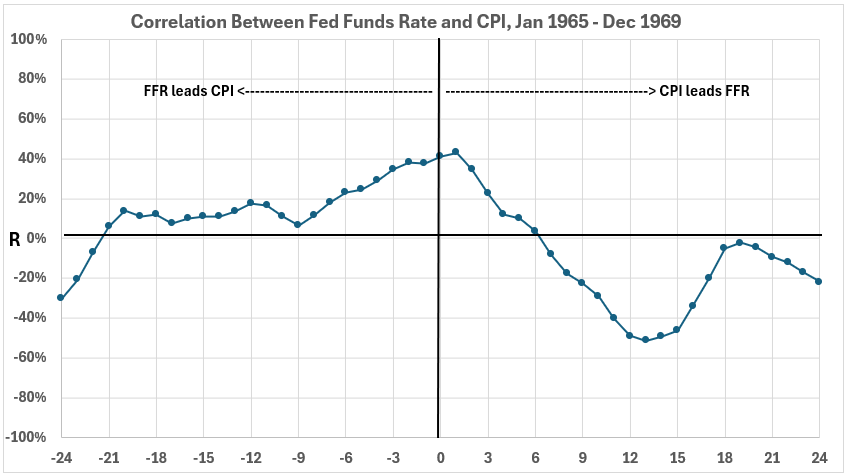
- The most positive correlation occurs from the Fed Fund Rate leading CPI by 4 months to CPI leading the Fed Funds Rate by 2 months. The correlations are weak, averaging R = 37% with the maximum R = 43%. This indicates that the Fed Funds Rate changes could have a maximum effect on subsequent or concurrent CPI would be 14% (R2 = 14%). The effect would be that modifications in CPI would be in the same direction as changes in the Fed Funds Rate. In other words, if changes in the Fed Funds caused changes in CPI, the effect would be that increases in FFR caused increases in CPI.
- The second feature noted is the first two data points after the coincident data (at 0). This indicates a possibility that changes in CPI might produce changes in the same direction in FFR. This is entirely credible, given the Federal Reserve’s practice of increasing the Fed Funds Rate to attempt to slow down inflation. However, if such an effect exists, it is active for only two months and has a weak association.
- The third feature of note is the weak to moderate negative association for CPI leading FFR by 10 to 16 months. That suggests the possibility that during this inflationary surge, the Fed cut rates 10-16 months after inflation rose. That is credible and could be tested with further analysis. However, the maximum association for this is barely moderate at best (the maximum R2 is approximately 25%). This does not give confidence that the Federal Reserve’s interest rate actions were strongly related to CPI changes.
Conclusion
The conclusion for inflation in the 1960s is that Federal Reserve interest rate actions had a limited effect on changing CPI inflation. We will continue analyzing more inflationary surges next week.
Footnotes
1. Lounsbury, John, “Fed Funds Rate and Inflation. Part 2 – Corrected,” EconCurrents, October 20, 2024. https://econcurrents.com/2024/10/20/fed-funds-rate-and-inflation-part-2-corrected/.
2. Lounsbury, John, “Fed Funds Rate and Inflation. Part 1 – Corrected,” EconCurrents, October 13, 2024. https://econcurrents.com/2024/10/13/fed-funds-rate-and-inflation-part-1-corrected/.
