Notice: This post has incorrect calculations for changes in the Fed Funds rate. See Fed Funds Rate and Inflation: Part 2 – Corrected.
This post develops 49 timeline offset tables to determine how CPI inflation varies as the Fed Funds rate changes. It examines the first application of these timeline tables.

Image by jairojehuel from Pi
Introduction
This post continues last week’s discussion on how changes in the Fed Funds Rate are associated with CPI.1 We continue to examine the linear association of CPI (I) changes with various parameters (S).
I = mS + b
Here, S is a change in the Federal Funds rate. See this2 for a more complete discussion.
Data
Long-term monthly data for both CPI3 and Fed Funds rates are available.4 In this study, the monthly rates will be used. Each month’s data will be a three-month moving average to reduce noise. The data tables are in the Appendix in Part 1.1
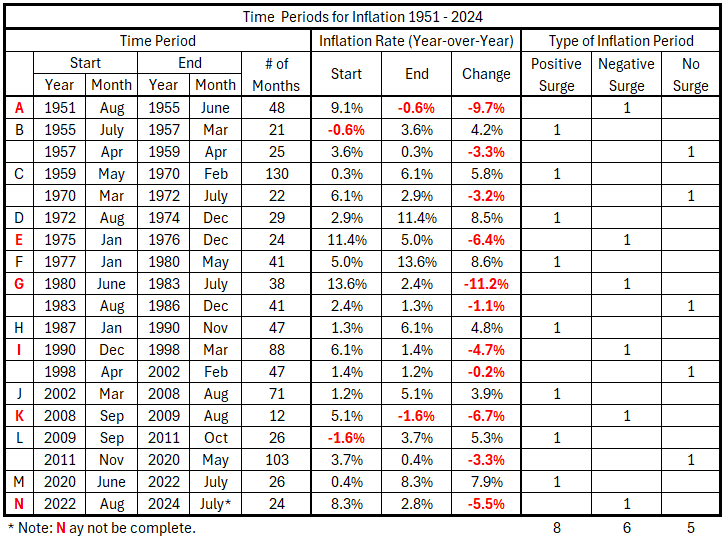
Table 1 shows the inflation timeline from 1951 to 2024. There were eight inflation surges (black letters), six deflation surges (red letters), and five periods without significant inflation changes. The determination of this timeline is found in Part 1.
Table 1. Timeline of Monthly Inflation Data 1951-2024
Analysis
The 49 timeline offset tables can be reviewed here: Fed Funds vs CPI Timelines.xlsx. They cover Fed Funds leading CPI by 1,2, …, 24 months and the same for CPI leading Fed Funds. The 49th table is for coincident timelines.
Inflation surge B, from July 1955 to March 1957
Figure 1 shows the monthly changes in the Fed Funds Rate and CPI inflation for the inflation surge from 1955 to 1957, with three-month moving average smoothing.
Figure 1. Monthly Changes for FFR and CPI, 1955 – 1957
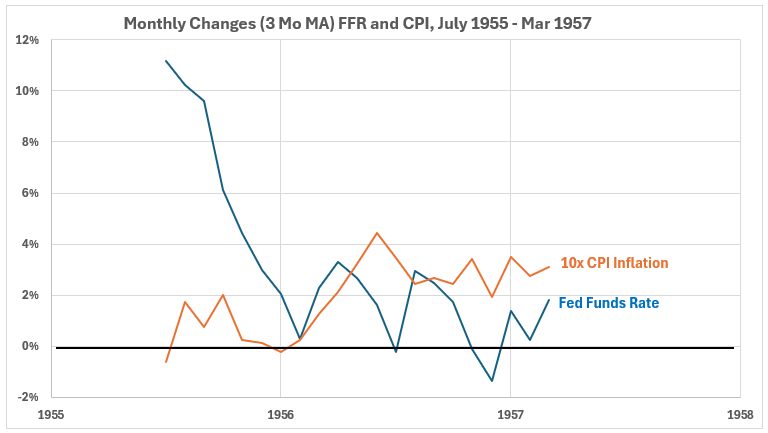
As the surge progressed, CPI changes increased, and FFR changes decreased. This seems odd.
Figure 2 shows a weak negative association between FFR and CPI, R = –47% and R2 = 22%. This indicates that raising the Fed Funds Rate might have decreased inflation growth.
Figure 2.
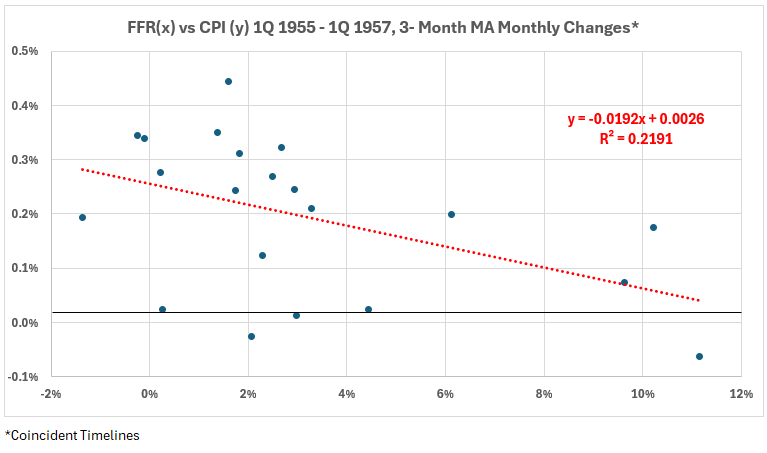
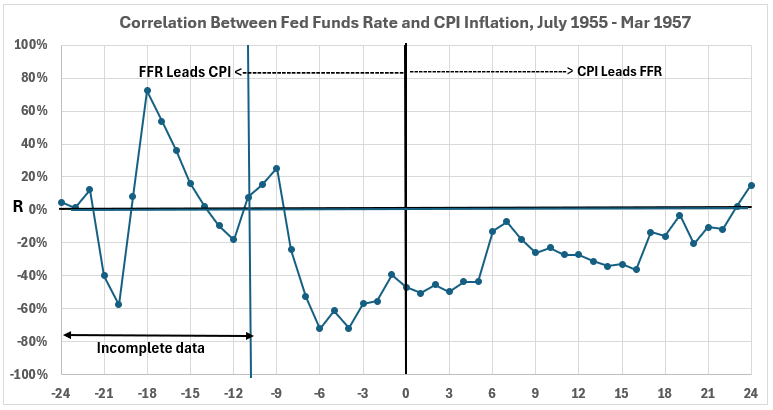
Figure 3 shows a weak, primarily negative correlation for the timeline offsets with complete data. Five moderate negative correlations occur for the Fed Funds Rate leading CPI by two to seven months.
Figure 3. Correlations Between FFR and CPI for Various Timeline Shifts, 1955 – 1957
Conclusion
No interpretation of the analysis will be given here. There may be a fundamental error in the data. We have calculated the changes in the Fed Funds Rate as percentage changes of percentages. That is, percent change = (% change monthn+1 – % change monthn)/% change monthn. It makes no sense to use a percentage of percentages. A correct calculation of change is % change monthn+1 – % change month. Next week, we will redo the work to this point with corrected changes for the Fed Funds Rate.
Footnotes
1. Lounsbury, John, “Fed Funds Rate and Inflation. Part 1,” EconCurrents, September 22, 2024. https://econcurrents.com/2024/09/22/fed-funds-rate-and-inflation-part-1/.
2. Lounsbury, John, “Government Spending and Inflation. Reprise and Summary,” EconCurrents, August 20, 2023. https://econcurrents.com/2023/08/20/government-spending-and-inflation-reprise-and-summary/.
3. Federal Reserve Economic Data, Consumer Price Index for All Urban Consumers: All Items in U.S. City Average, Index 1982-1984=100, Monthly, Not Seasonally Adjusted. Data updated as of August 11, 2024. https://fred.stlouisfed.org/graph/?id=CPIAUCNS.
4. Federal Reserve Economic Data, Federal Funds Effective Rate, Percent, Monthly, Not Seasonally Adjusted. Data downloaded September 18, 2024. https://fred.stlouisfed.org/series/FEDFUNDS.