On the third Thursday of the month right on schedule NOAA issued their updated Seasonal Outlook which I describe as their Four-Season Outlook because it extends a bit more than one year into the future. The information released also included the Mid-Month Outlook for the following month plus the weather and drought outlook for the next three months. I present the information issued by NOAA and try to add context to it. It is quite a challenge for NOAA to address the subsequent month, the subsequent three-month period as well as the twelve successive three-month periods for a year or a bit more.
With respect to the long-term part of the Outlook which I call the Four-Season Outlook, the timing of the transition from Neutral to LaNina is challenging to predict. We are now in ENSO Neutral. La Nina is the likely scenario soon, but the strength of the La Nina may be fairly weak..
From the NOAA discussion:
“The most recent International Research Institute (IRI) for Climate and Society plume forecast of the Niño-3.4 SST index predicts a weak and a short duration La Niña, as indicated by the Niño-3.4 index values less than -0.5°C. This month, the latest North American Multi-Model Ensemble (NMME) guidance was relied upon, which predicts La Niña to emerge in the next couple of months and continue through the Northern Hemisphere winter. The continuation of negative subsurface temperatures and enhanced low-level easterly wind anomalies supports the formation of a weak La Nina. In summary, La Niña is favored to emerge in SON (71% chance) and is expected to persist through JFM 2025.”
“However, chances of a moderate to strong La Niña are currently less than 50% through the Fall and Winter. ENSO-neutral conditions are favored to re-emerge by the February-April (FMA) 2025 season.”
I personally would not have total confidence in this outlook given the uncertainty about there actually being a La Nina and its strength if it does happen. I do not have the JAMSTEC outlook yet but for sure they will lean towards a weak La Nina with Modoki characteristics. I do not have a lot of confidence that NOAA knows how to deal with a La Nina Modoki. But they may have it exactly correct.
Let’s Take a Look at the (mid-month) Outlook for October
It will be updated on the last day of August.
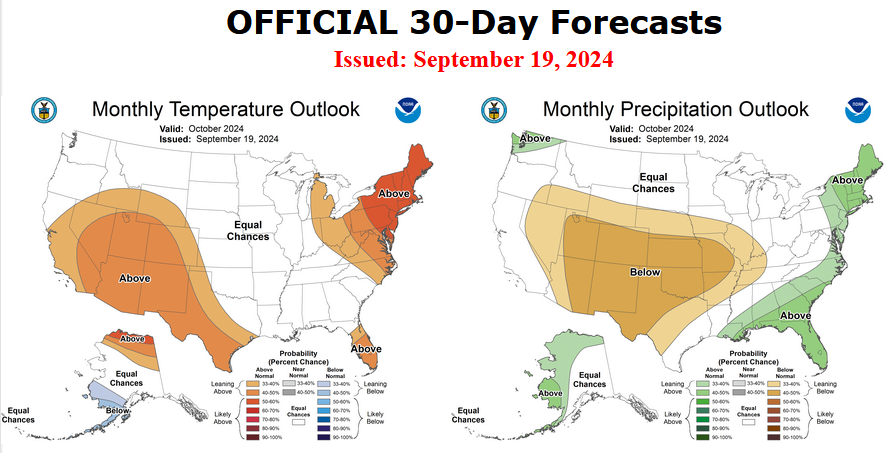
Then we look at a graphic that shows both the next month and the next three months.
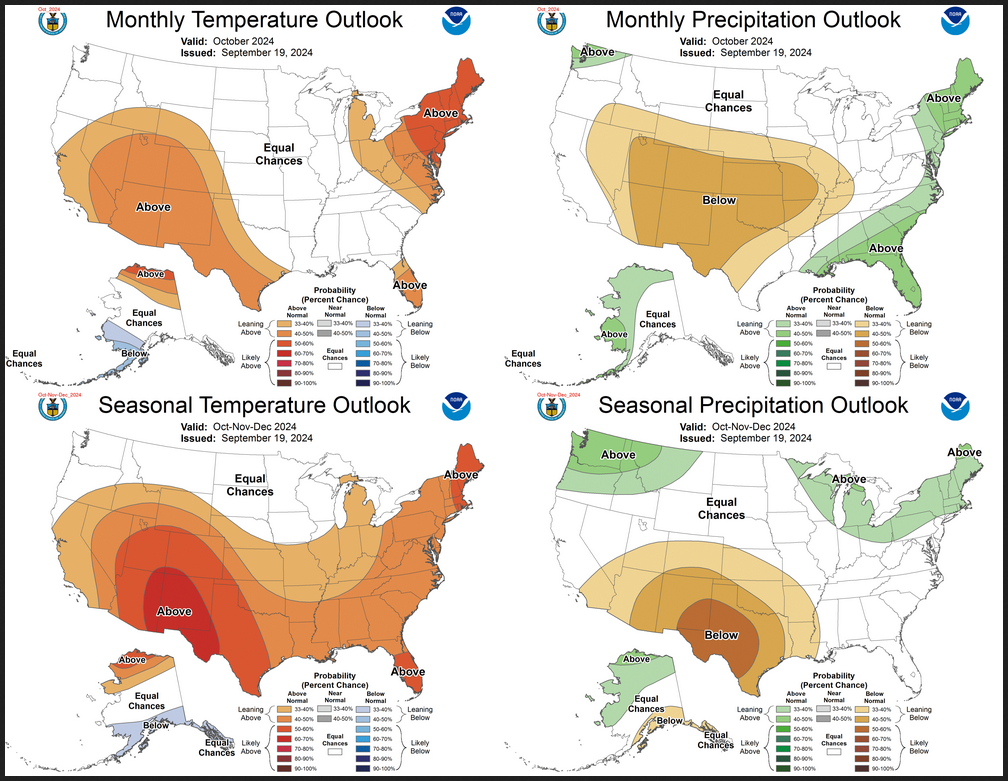
The top row is what is now called the Mid-Month Outlook for next month which will be updated at the end of this month. There is a temperature map and a precipitation map. The second row is a three-month outlook that includes next month. I think the outlook maps are self-explanatory. What is important to remember is that they show deviations from the current definition of normal which is the period 1991 through 2020. So this is not a forecast of the absolute value of temperature or precipitation but the change from what is defined as normal or to use the technical term “climatology”.
| Notice that the Outlook for next month and the three-month Outlook are dissimilar. This tells us that November and December will be substantially different than October. |
–

The full NOAA Seasonal Outlook extends through October/November/December of 2025 (yes that is more than a year out). All of these maps are in the body of the article. Large maps are provided for October and the three-month period October/November/December Small maps are provided beyond that through October/November/December of 2025 with a link to get larger versions of these maps.
NOAA provides a discussion to support the maps. It is included in the body of this article. In some cases, one will need to click on “read more” to read the full article. For those on my email list where I have sent the url of the article, that will not be necessary.
Here are larger versions of the Temperature and Precipitation Outlook maps for next month.
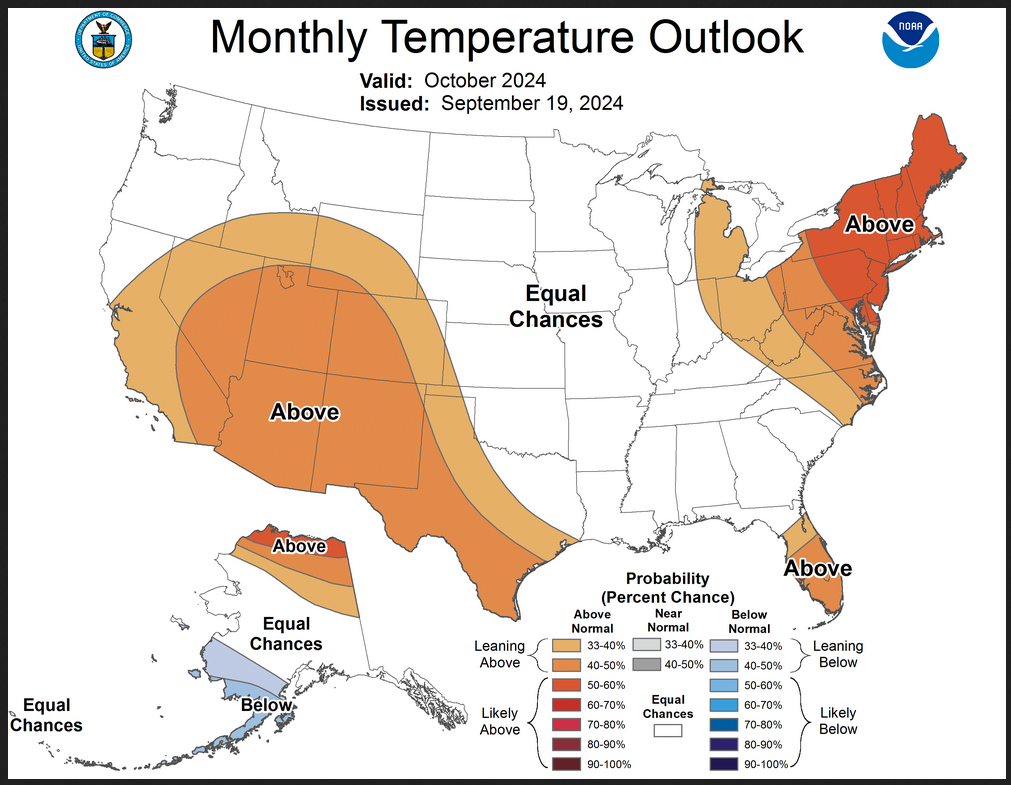
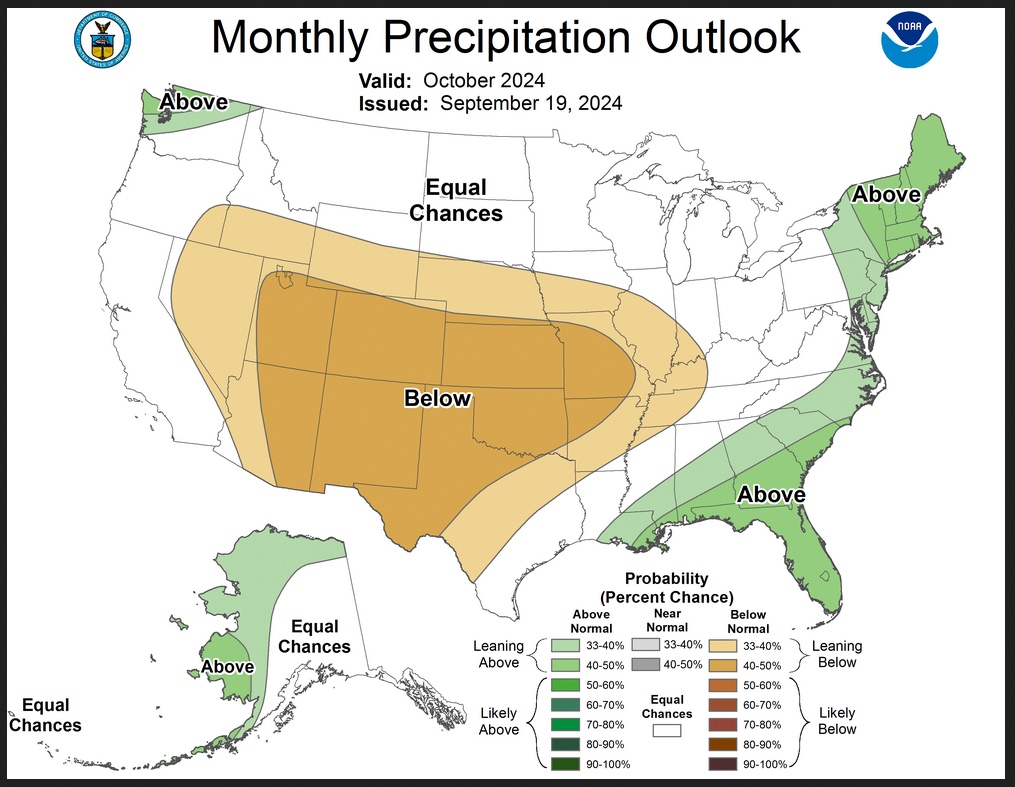
The maps are pretty clear in terms of the outlook.
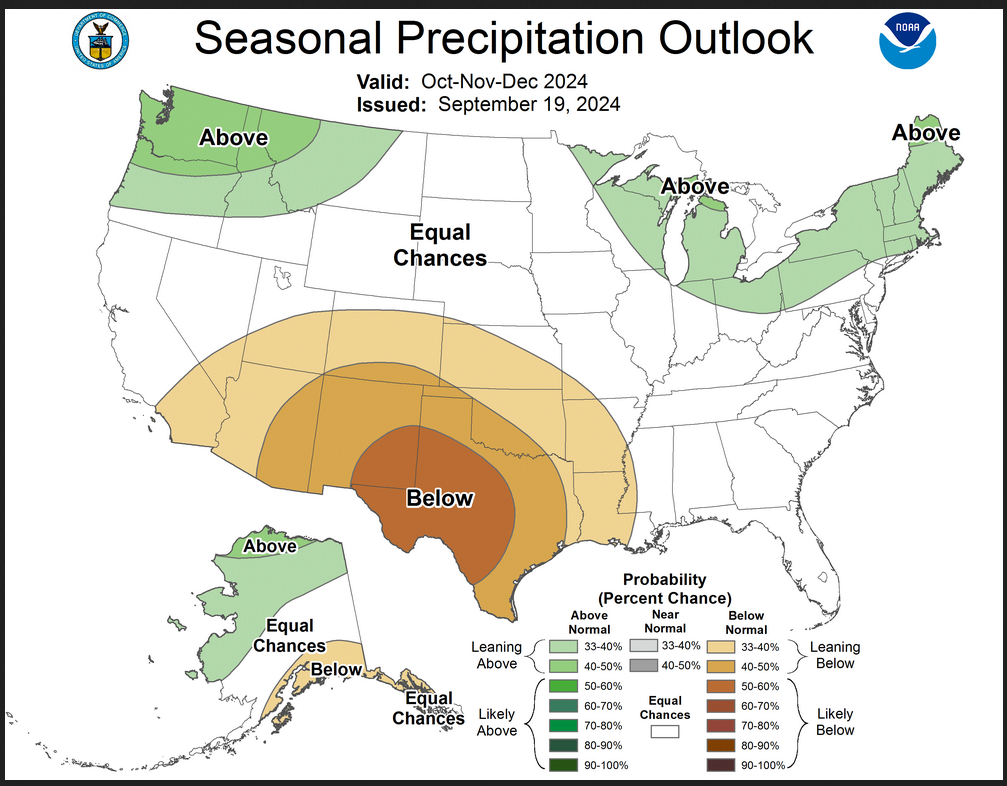
And here are large versions of the three-month SON 2024 Outlooks
First temperature followed by precipitation.
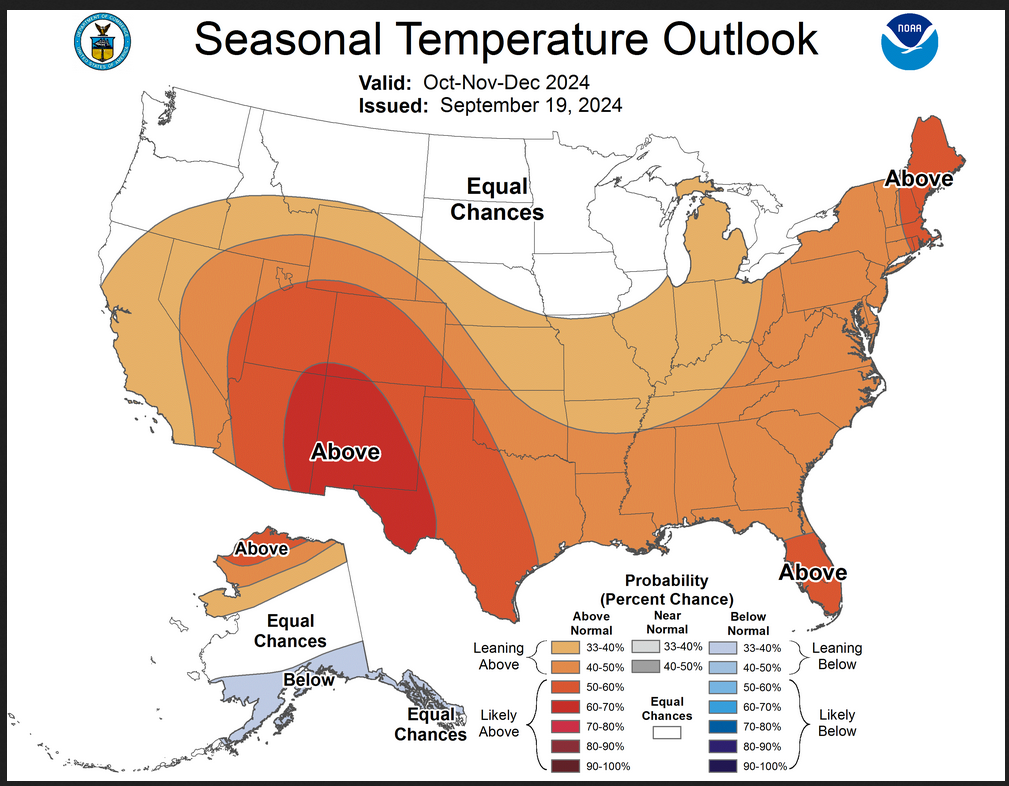
| These maps are larger versions of what was shown earlier. This is a pretty definitive pattern. |
NOAA Discussion
Maps tell a story but to really understand what is going you need to read the discussion. I combine the 30-day discussion with the long-term discussion and rearrange it a bit and add a few additional titles (where they are not all caps the titles are my additions). Readers may also wish to take a look at the article we published last week on the NOAA ENSO forecast. That can be accessed HERE.
I will use bold type to highlight some especially important things. All section headings are in bold type; my comments, if any, are enclosed in brackets [ ].
CURRENT ATMOSPHERIC AND OCEANIC CONDITIONS
ENSO-neutral continued during August 2024, with near-average sea surface temperatures (SSTs) observed across most of the equatorial Pacific Ocean. The weekly Niño indices did not change substantially during the month, with the latest weekly index values varying between +0.1°C (Niño-4) and -0.2°C (Niño-3.4, 3, and 1+2). Below-average subsurface temperatures were also similar to those in early August. Negative temperature anomalies continued to dominate across most of the subsurface equatorial Pacific Ocean. Low-level wind anomalies were easterly over most of the equatorial Pacific, and upper-level wind anomalies were easterly over the east-central Pacific. Convection was slightly enhanced over parts of Indonesia and was near average near the Date Line. Both the Southern Oscillation index and the equatorial Southern Oscillation indices were positive. Collectively, the coupled ocean-atmosphere system reflected ENSO-neutral.
Since late August, the Real-time Multivariate Madden Julian Oscillation (RMM) index observations show the Madden Julian Oscillation (MJO) signal has struggled to fully propagate out of the Maritime Continent. The signal has regained amplitude in the past week, but still has shown little sign of eastward propagation. Dynamical models have come into better agreement favoring an eastward propagating Western Pacific MJO event during the next few weeks, with several ensemble members maintaining the signal with a moderate to high amplitude as it enters the Western Hemisphere. Upper-level velocity potential forecasts from the models remain somewhat mixed in regards to the evolution and strength of the MJO, with the European Centre for Medium-Range Weather Forecasts (ECMWF) favoring more robust activity heading into October. Despite some uncertainties, conditions are expected to become more conducive for tropical cyclone development over the tropical Americas.
PROGNOSTIC DISCUSSION OF SST FORECASTS
The most recent International Research Institute (IRI) for Climate and Society plume forecast of the Niño-3.4 SST index predicts a weak and a short duration La Niña, as indicated by the Niño-3.4 index values less than -0.5°C. This month, the latest North American Multi-Model Ensemble (NMME) guidance was relied upon, which predicts La Niña to emerge in the next couple of months and continue through the Northern Hemisphere winter. The continuation of negative subsurface temperatures and enhanced low-level easterly wind anomalies supports the formation of a weak La Nina. In summary, La Niña is favored to emerge in SON (71% chance) and is expected to persist through JFM 2025.
PROGNOSTIC TOOLS USED FOR U.S. TEMPERATURE AND PRECIPITATION OUTLOOKS
Dynamical model forecasts from the NMME, the Coupled Forecast System Model Version 2 (CFSv2) , the Copernicus (C3S) multi-model ensemble system were used extensively for the first six leads when they are available, as was the objective, historical skill weighted consolidation and Calibration, Bridging, and Merging (CBaM) guidance, that combines both dynamical and statistical forecast information.
Additionally, the official ENSO forecast depicts probabilities of La Niña that are higher than climatological probabilities through the upcoming winter. This anticipated La Niña signal played a role in the construction of these outlooks. However, the anticipated La Niña is likely to be weak, which may temper some of its impacts. At later leads, decadal trends in temperature and precipitation were increasingly relied upon in creating the seasonal outlooks.
30-DAY OUTLOOK DISCUSSION FOR OCTOBER 2024
The October temperature and precipitation outlooks are characterized by low forecast probabilities and outlook coverage – not atypical for an October monthly outlook. Ongoing climate conditions in mid-September indicate a continued slow trend toward potential La Nina conditions later this autumn, a better organizing MJO as well as anomalous coastal sea surface temperatures (SSTs) – primarily for waters in proximity to Alaska. Although not impactful in a predictability context this late in the year, soil moisture continues to decrease in many areas across the CONUS, with the ongoing impactful drought in parts of the Ohio Valley and western mid-Atlantic continuing to worsen.
Preparation of the October temperature and precipitation outlooks primarily utilized subseasonal dynamical and statistical model guidance, potential teleconnection associated with an active MJO, long term trends as well as in some places coastal SSTs. Any potential impacts from slowly developing La Nina conditions are not considered in the October outlook to any large degree.
Temperature
The temperature outlook favors above-normal temperatures for the southwestern CONUS, the central and southern Rockies, and southern Texas, consistent with the majority of subseasonal dynamical model guidance and most of the NMME and C3S participant models. Strong warmer-than-normal temperature trends and forecast model guidance elevates chances for above-normal monthly mean temperatures for the Northeast, mid-Atlantic and parts of the eastern Great Lakes.
There is a large area of “Equal Chances” or EC forecast from the Pacific Northwest eastward to include the northern and central Plains, Mississippi Valley and Southeast. The above average coverage of EC in the outlook in these areas is associated with highly varying dynamical model guidance on the subseasonal time scale. This includes the latest ECMWF extended range forecast which depicts weak signals in this region over the course of the month of October.
Although associated impacts from anomalous tropical convection are less likely in autumn then during winter and early spring, that potential still exists and is at odds with much of the dynamical model guidance. Uncertainty in any mid-latitude teleconnection from the MJO further complicates the forecast in this area as MJO lagged composites of 200-hPa height and 850-hPa temperature for MJO RMM phases 6 and 7 support troughing and favored below-normal temperatures for parts of the western and central CONUS during the first half of October. A Multiple Linear Regression (MLR) forecast tool utilizing the MJO, ENSO and long-term trends targeting the first two weeks of October indicates elevated odds for below-normal temperatures in parts of the north-central CONUS.
For Alaska, anomalous SSTs and some forecast guidance supports favored above-normal (below-normal) temperatures for the northern Alaska (Southwest Alaska) portions of the state.
Precipitation
The October precipitation outlook favors below-normal precipitation for an area from the Southwest U.S. and central Rockies eastward to include much of the central Plains and parts of the central Mississippi Valley. This forecast is primarily based on a high degree of agreement in bias-corrected and calibrated dynamical model guidance from the NMME and C3S model suites as well as the ECMWF extended range forecast.
Elevated odds for above-normal precipitation is forecast for the central and eastern Gulf coast, parts of the Southeast, mid-Atlantic coast and much of the Northeast. Long term wetter-than-normal precipitation trends (i.e., OCN) and some subseasonal dynamical model guidance support the forecast in the Northeast and mid-Atlantic areas. For the Southeast and Gulf coast areas, the outlook is driven by potential tropical moisture entering this region of the CONUS associated with the MJO entering RMM phases 8 and 1 during early October. Dynamical model guidance from some sources also supports this forecast, mainly for Florida and extreme Southeast coastal areas. In addition, a small area of enhanced odds for wetter-than-normal conditions is forecast for northern Washington state indicated in some forecast tools.
For Alaska, model guidance is generally consistent with wet conditions for areas in western and northern Alaska, so above-normal precipitation slightly favored in those portions of the state. Large uncertainty associated with highly conflicting forecast tools any potential MJO impacts made EC the prudent forecast for most of the Ohio Valley and much of the Midwest at this time.
SUMMARY OF THE OUTLOOK FOR NON-TECHNICAL USERS (Focus on October through December)
El Niño Southern Oscillation (ENSO)-neutral conditions are present, as equatorial sea surface temperatures (SSTs) are near-to-below average in the central and eastern Pacific Ocean. During the last four weeks, negative SST anomaly changes prevailed across the western and central equatorial Pacific Ocean. As such, a La Niña Watch is in effect, with La Niña favored to emerge in September-November (SON) (71% chance) and is expected to persist through January-March (JFM) 2025. However, chances of a moderate to strong La Niña are currently less than 50% through the Fall and Winter. ENSO-neutral conditions are favored to re-emerge by the February-April (FMA) 2025 season.
Temperature
The October-December (OND) 2024 temperature outlook favors above normal temperatures for the southern two-thirds of the Contiguous United States (CONUS), the eastern third of the CONUS, and northwestern Alaska. The largest probabilities (greater than 60 percent) of above normal temperatures are forecast across much of the Southwest and parts of the Rio Grande Valley and southern High Plains. Conversely, a weak tilt toward below normal temperatures is indicated for Southeast Alaska, parts of the southern Mainland, and parts of the Alaska Peninsula. T
Precipitation
he OND 2024 precipitation outlook depicts enhanced probabilities of below-normal precipitation amounts across much of the south-central and southwestern CONUS as well as most of Southeast Alaska and parts of the southern Mainland. The greatest chances (greater than 50 percent) of below-normal precipitation are forecast for much of the Rio Grande Valley and much of the Southern High Plains, where probabilities of below exceed 50 percent. Above-normal precipitation is more likely for the northwestern CONUS, the Great Lakes and Northeast, and much of northwestern Mainland Alaska. Equal chances (EC) are forecast for areas where probabilities for each category of seasonal mean temperatures and seasonal accumulated precipitation amounts are expected to be similar to climatological probabilities.
BASIS AND SUMMARY OF THE CURRENT LONG-LEAD OUTLOOKS
PROGNOSTIC DISCUSSION OF OUTLOOKS – OND 2024 TO OND 2025
TEMPERATURE
Above-normal temperatures are favored throughout a majority of the southern and eastern CONUS and northwestern Alaska during OND. Conversely, below normal temperatures are more likely for much of southern Alaska. EC of below, near, or above normal temperatures are forecast for the northwestern and north-central CONUS. This EC area is due to weak or conflicting signals among temperature tools. Probabilities of above-normal temperatures are reduced slightly relative to last month across parts of the north-central CONUS to the Southeast due to a trend toward a colder solution in the temperature consolidation coupled with a low confidence EC forecast for the month of October across many of these areas. Above normal temperatures remain likely (greater than 60 percent) across the Southwest, due to good agreement among both dynamical and statistical guidance. The area of favored above-normal temperatures are expanded to include much of California due to a stronger signal in this month’s consolidation. Guidance is similar across much of Alaska relative to last month. Increased probabilities of below-normal temperatures are indicated for southern parts of the state, aided in part due to an anticipated cooler than normal October and the potential impacts of La Niña, especially later in the season. Above-normal temperatures remain favored for northwestern Alaska due to recent trends and observed below normal sea ice extent.
From November-December-January (NDJ) through JFM, impacts from the predicted La Niña continue as above normal temperatures are favored across the Southern CONUS and the Eastern Seaboard while enhanced below normal temperature probabilities persist across southeastern Alaska and expand northwestward toward the central Mainland and southeastward to the northwestern and north-central CONUS by December-January-February (DJF). By FMA, the potential impacts of La Niña begin to wane as ENSO-neutral conditions become increasingly likely. Below-normal temperatures favored for much of Alaska disappear by April-May-June (AMJ) and from all of the CONUS by May-June-July (MJJ). Thereafter, the forecast pattern increasingly reflects trends with above-normal temperatures generally favored across most of the southern and eastern CONUS next spring, expanding to most of the West Coast by the Summer and to the remainder of the CONUS next fall. Across Alaska, a quick transition toward milder than normal conditions is predicted with above-normal temperatures favored for almost the entire state by late Spring and through the Summer and much of next Fall.
PRECIPITATION
Model and statistical guidance remains generally consistent from previous months depicting elevated probabilities of below normal precipitation for much of the southern CONUS, and increased chances of above normal precipitation for the Pacific Northwest, Great Lakes, and parts of the Northeast during OND. However, despite dynamical models favoring below-normal precipitation in the Southeast, EC is indicated due to the potential for tropical activity early in the season and increased probabilities for a wet October. Precipitation consolidation guidance has trended wetter across the northern tier of the CONUS, resulting in an expansion of elevated above-normal precipitation probabilities across parts of the northern High Plains and Great Lakes relative to last month. However, due to a lack of dynamical model support, EC remains forecast across most of the north-central CONUS. A slight tilt toward below-normal precipitation is indicated for parts of southeastern Alaska, based primarily on dynamical model guidance from the CFSv2 and a dry signal derived from natural analogs to the current ENSO state. Conversely, above-normal precipitation is favored for northern and western Alaska due to trends with support from C3S and CBaM output. EC is indicated for most of the rest of the forecast domain as signals for the various dynamical and statistical tools are too weak or conflicting to issue a forecast with a sufficient degree of confidence.
As we progress further into late fall and through the winter, dynamical and statistical guidance persist with a dry signal across the southern CONUS and southeastern Alaska, consistent with a La Niña signature. An expansion of enhanced above normal precipitation probabilities is noted across the northern CONUS, peaking in coverage during the winter months. A wet signal is also favored to persist across northwestern Alaska and expand southward from the Great Lakes across much of the east-central CONUS later in the winter through the Spring, consistent with dynamical model guidance and trends . Thereafter, trends become the dominant factor with increased chances of above normal precipitation generally indicated across parts of the Northeast and parts of the Mid-Atlantic in the Summer and shifting southward along the Mid-Atlantic Coast by early Fall. Conversely, trends favor a dry pattern for much of the Southwest during early spring shifting northward to the Northern Rockies by late Spring, with increased chances of dryness for parts of the Northern and Central Plains next summer as well. As dryness potentially expands into the northern and central Plains next summer, a corresponding weak tilt toward above normal precipitation makes a brief appearance for parts of the Southwest Monsoon Region during June-July-August (JJA) and July-August-September (JAS). Thereafter, the area of enhanced probabilities of below-normal precipitation begins to recede over the west-central CONUS, based primarily on combined statistical guidance from trends and ENSO. By next Fall, a small area of favored above-normal precipitation appears in the northwestern CONUS due to combined statistical guidance from trends and ENSO. Above-normal precipitation is also favored for much of northern Alaska late Spring and early Summer and shifting to southeastern Alaska by the Fall, consistent with trends .
Drought Outlook
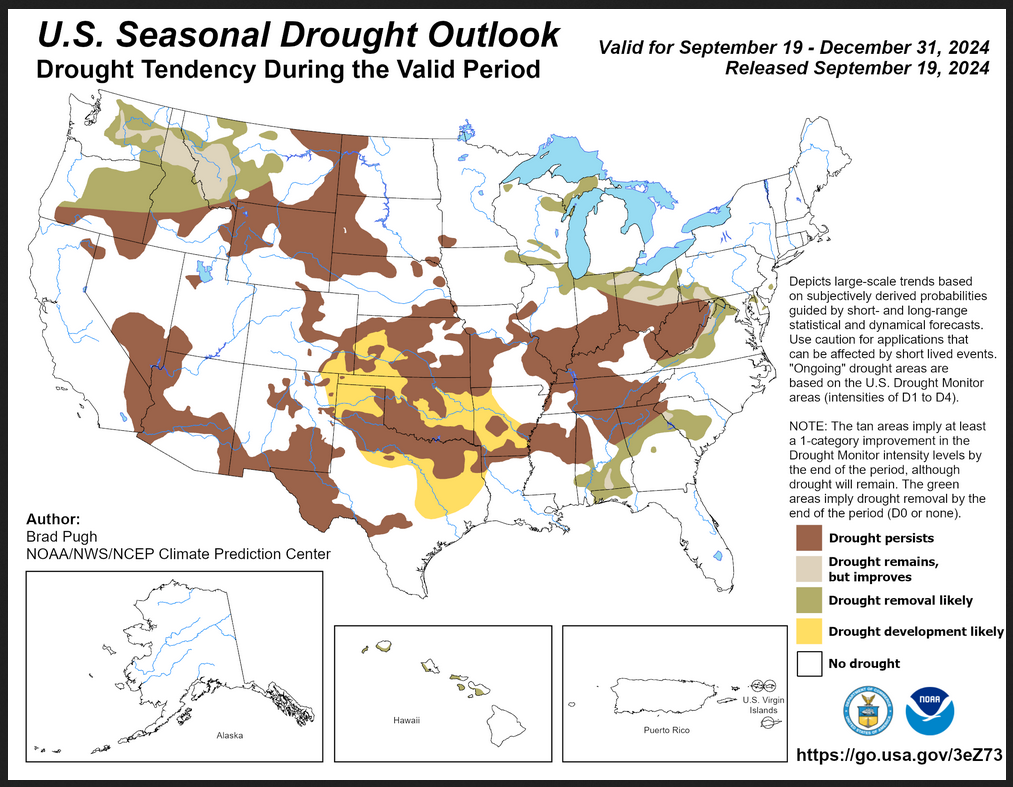
| The yellow is the bad news and there is a lot of it. And there is a large area where drought is expected to persist. Overall the level of drought is expected to remain about the same. And with a La Nina winter ahead, it is likely to go higher in parts of the Great Plains. |
Short CPC Drought Discussion
Latest Seasonal Assessment – Drought coverage expanded and intensified across much of the Great Plains, Middle to Lower Mississippi Valley, Southeast, and Ohio Valley this past summer. Drought persistence is forecast for much of the Ohio Valley and Central Appalachians where large precipitation deficits exist dating back 6 to 12 months. Drought improvement or removal is more likely to the north across northern Ohio and northeastern Indiana which have smaller long-term precipitation deficits and the October-November-December (OND) outlook favors above-normal precipitation. Improvement and removal is also forecast to the east of the spine of the Appalachians, including western parts of Maryland and Virginia.
Persistence is the most likely outcome for inland areas of the Southeast along with the Tennessee Valley and Lower Mississippi Valley. However, based on the October outlook tilting wet farther to the south and east, drought improvement or removal is forecast for parts of Georgia, Alabama, South Carolina, and the Florida Panhandle. Forecast confidence for the Southeast is low due to large uncertainty on future tracks of any tropical cyclones that emerge from the Gulf of Mexico during late September and October.
A drier climatology supports persistence across the Northern to Central Great Plains, while persistence and development are forecast from Kansas south to Oklahoma and parts of Texas. Development is most likely where antecedent dryness coincides with where the OND outlook favors below-normal precipitation. Persistence is also favored for ongoing drought areas of the Southwest. If La Niña becomes established this fall, then a larger area of the southern tier of the country would be vulnerable to drought development later during the 2024-2025 winter.
The fall and early winter are a wetter time of year from the Pacific Northwest east to the Northern Rockies. Based on this increasingly wet climatology and also the OND outlook tilting wet, drought improvement or removal is forecast for those areas. Alaska, Hawaii, Puerto Rico, and the U.S. Virgin Islands are likely to be nearly or completely drought-free by the end of December.
Looking out Four Seasons.
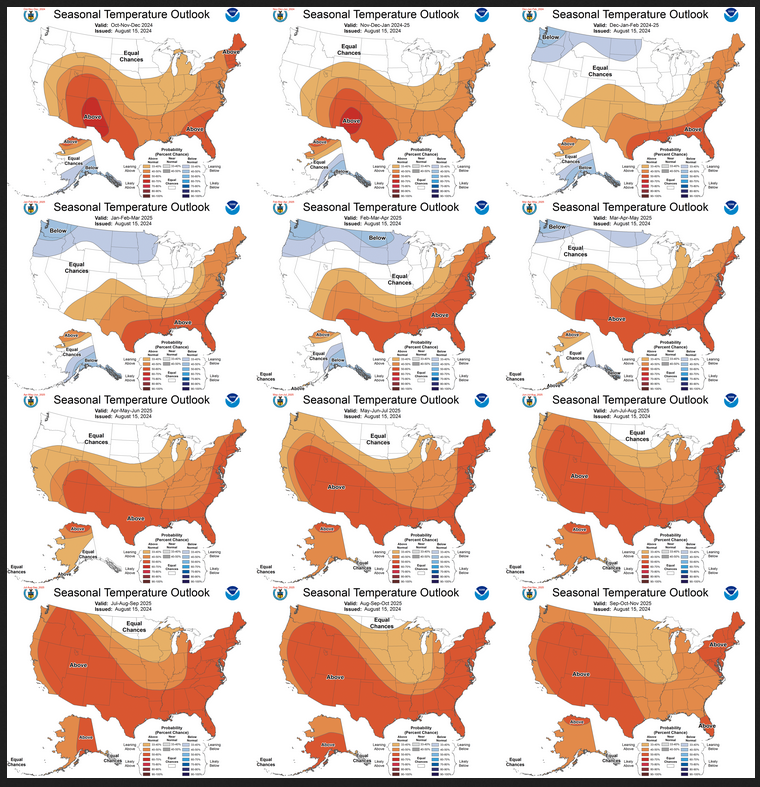
Twelve Temperature Maps. These are overlapping three-month maps (larger versions of these and other maps can be accessed HERE)
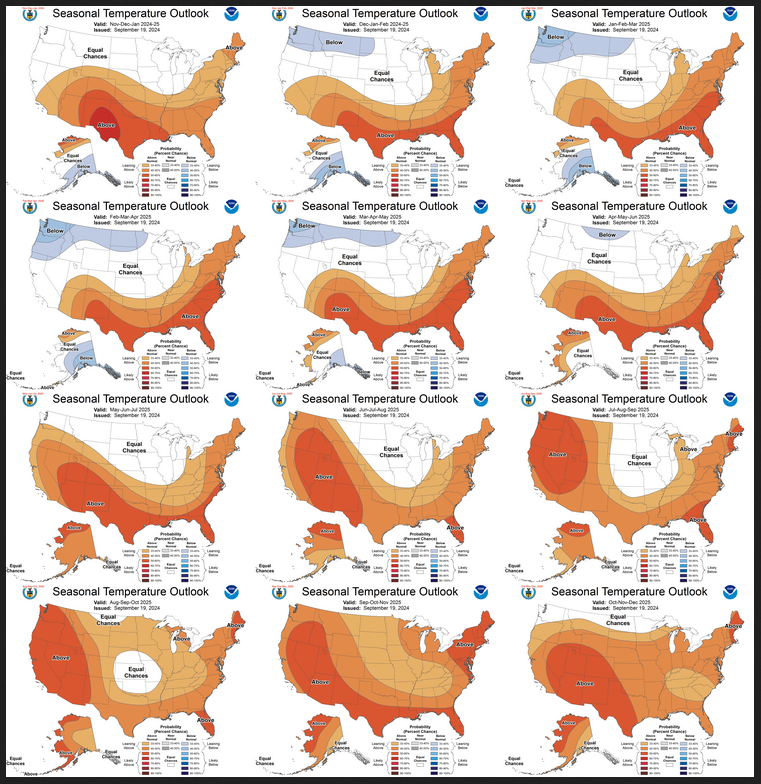
Notice that this presentation starts with Oct/Nov/Dec (OND) since SON is considered the near-term and is covered earlier in the presentation. The changes over time are generally discussed in the discussion but you can see the changes easier in the maps.
Comparing the new outlook with the prior Outlook,
The easiest way to do the comparison is to print out both maps. If you have a color printer that is great but not needed. What I do is number the images from last month 1 – 12 starting with “1” and going left to right and then dropping down one row. Then for the new set of images, I number them 2 – 13. That is because one image from last month in the upper left is now discarded and a new image on the lower right is added. Once you get used to it, it is not difficult. In theory, the changes are discussed in the NOAA discussion but I usually find more changes. It is not necessarily important. I try to identify the changes but believe it would make this article overly long to enumerate them. The information is here for anyone who wishes to examine the changes. I comment below on some of the changes from the prior report by NOAA and important changes over time in the pattern.
| There has not been much of a change since last month. The La Nina impacts begin a month later than in last month’s Seasonal Outlook. But the overall pattern has not changed until beyond JFM 2025 when the pattern returns to ENSO Neutral. |
Now the Twelve New Precipitation Maps
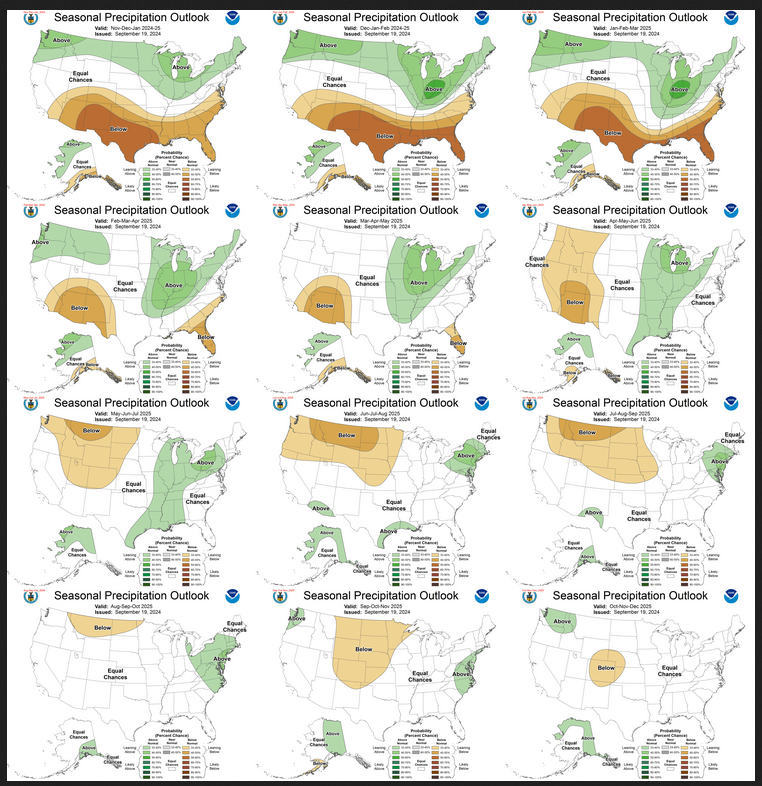
Similar to Temperature in terms of the organization of the twelve overlapping three-month outlooks.
Comparing the new outlook with the prior Outlook,
The maps that were released last month.
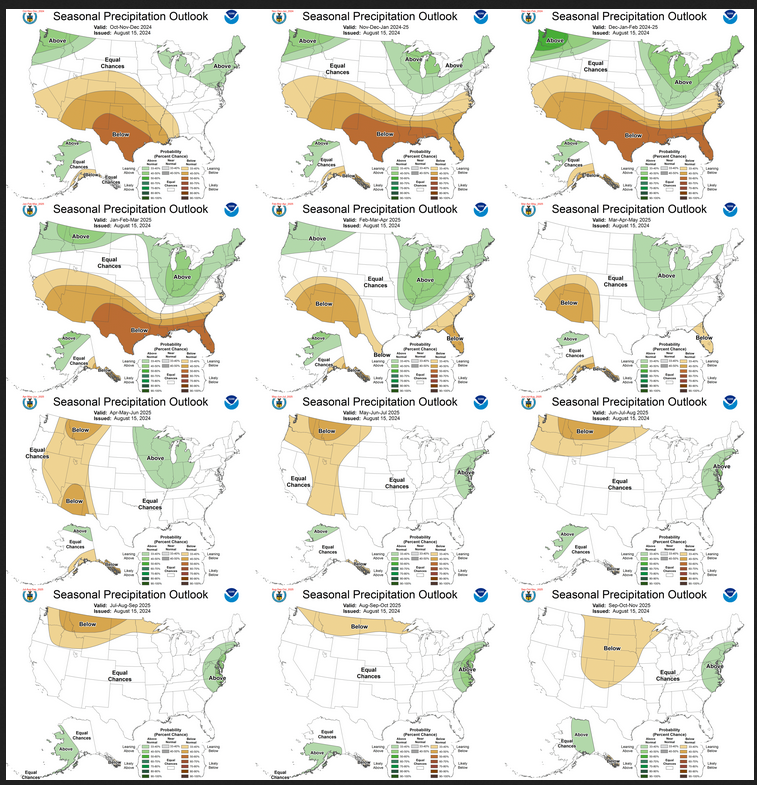
A good approach for doing this comparison is provided with the temperature discussion.
| The overall outlook is the same as last month. That is a bit surprising since La Nina is expected to be delayed by about a month. Beyond JFM 2025 the pattern changes as it returns to ENSO Neutral. |
The key piece of information used by NOAA follows.
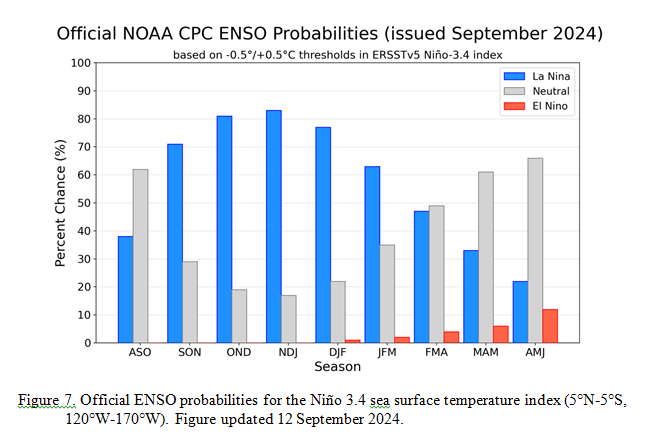
| It looks like ENSO is Neutral now and by Fall we should be in La Nina which continues through the forecast period shown here but the full forecast in this article goes beyond next winter. This type of graphic does not show how strong an El Nino or a La Nina is likely to be. What is forecast is a La Nina most likely will not be stronger than a marginal La Nina. |
Resources
Other Reports and Information
The Wildfire Report can be accessed HERE
–
| I hope you found this article interesting and useful. |
–