Home » Declining Reservoir Reliability and Increasing Reservoir Vulnerability: Long-Term Observations Reveal Longer and More Severe Periods of Low Reservoir Storage for Major United States Reservoirs – Published on September 8, 2024
Declining Reservoir Reliability and Increasing Reservoir Vulnerability: Long-Term Observations Reveal Longer and More Severe Periods of Low Reservoir Storage for Major United States Reservoirs – Published on September 8, 2024
I am republishing this Open Access article as I think this will be new information for EconCurrents.com readers. I have published related articles recently which can be accessed HERE and HERE.
I have provided the below article in full but HERE is the link. I have highlighted some statements and my comments are either surrounded by brackets [] or in a text box
Citation: Simeone, C. E., Hammond, J. C., Archfield, S. A., Broman, D., Condon, L. E., Eldardiry, H., Olson, C. G., & Steyaert, J. C.(2024).Declining Reservoir Reliability and Increasing Reservoir Vulnerability: Long-Term Observations Reveal Longer and More Severe Periods of Low Reservoir Storage for Major United States Reservoirs.Geophysical Research Letters, 51(16), e2024GL109476.https://doi.org/10.1029/2024GL109476
Abstract
Hydrological drought is a pervasive and reoccurring challenge in managing water resources. Reservoirs are critical for lessening the impacts of drought on water available for many uses. We use a novel and generalized approach to identify periods of unusually low reservoir storage—via comparisons to operational rule curves and historical patterns—to investigate how droughts affect storage in 250 reservoirs across the conterminous U.S. (CONUS). We find that the maximum amount of water stored in reservoirs is decreasing, and that periods of unusually low storage are becoming longer, more severe, and more variable in (a) western and central CONUS reservoirs, and (b) reservoirs with primarily over-year storage. Results suggest that reservoir storage has become less reliable and more vulnerable to larger deviations from desired storage patterns. These changes have coincided with ongoing shifts to the hydroclimate of CONUS, and with sedimentation further reducing available reservoir storage. [Editor’s Note: Drought is natural. It is an error to asume that a period of drought is due to a changing hydroclimate. It may be or may not be. It just as well be the combination of the phases of the Ocean Cycles. To the extent that drought is caused by warmer temperatures we have a a better basis for attributing it to Global Warming. Same goes for increased evaporation from reservoirs.]
Key Points
Low-storage periods are longer, more severe, and more variable in over-year storage reservoirs and in the western and central CONUS
Longer periods of low storage for some regions in recent years suggests decreased reservoir reliability in a changing hydroclimate
Maximum annual storage is also declining across CONUS, furthered by storage losses from sedimentation
Plain Language Summary
Drought in water systems is a major challenge in managing water resources. Reservoirs are important as they can lessen the impacts of drought on water availability for many users. However, they are impacted by drought as well. We use a novel and generally applicable method to identify when reservoir storage is unusually low, potentially from drought, at 250 reservoirs across the conterminous U.S. We find that the maximum amount of water stored in reservoirs is decreasing across the U.S. We also find that periods of unusually low storage are becoming longer and more severe in western and central U.S. regions as well as for certain types of reservoirs. This suggests that reservoir storage may be less reliable and more vulnerable to extreme conditions and may be further impacted by changing climate and hydrology across the U.S. and by sediment building up behind reservoirs.
Some may need to click on “Read More” to read the rest of the article.
1 Introduction
There has recently been increasing interest in contextualizing ongoing drought in the conterminous United States (CONUS) in relation to historical variability and future projections (Bishop et al., 2021). Drought along with heatwaves represent nearly 25% of all long-term weather and climate disaster costs of over 1 billion dollars per event (NOAA-NCEI, 2021; Smith & Katz, 2013). Reservoirs help limit downstream propagation of drought (Van Loon et al., 2022; Van Oel et al., 2018; J. Wu et al., 2018) by controlling downstream flows (Carlisle et al., 2011, 2019), yet abnormally low storage in reservoirs resulting from changes in water supply and demand have substantial impacts across water use sectors (e.g., Ao et al., 2023; Wlostowski et al., 2022). Understanding reservoir storage dynamics during drought is essential for a comprehensive understanding of hydrological drought impacts across a basin as reservoirs integrate a multitude of basin signals from upstream (including meteorology, soils, snow, groundwater, streamflow, and water use) as well as downstream (e.g., water use). Two of CONUS’s largest reservoirs, Lake Mead and Lake Powell, recently reached unprecedented low storage during the region’s driest 22-year period in 1200 years (2000–2021; Williams et al., 2022), triggering considerable water use restrictions across southwestern CONUS (H.R. 2030, 2019; U.S. Bureau of Reclamation, 2022a, 2022b).
Changes to reservoir storage are not unique to southwestern CONUS as declines in many global lakes and reservoirs have been documented over recent decades (Steyaert & Condon, 2023; Yao et al., 2023). Sedimentation is a major driver of global declines in available reservoir storage (Podolak & Doyle, 2014; Yao et al., 2023) which, when paired with climate change (Chalise et al., 2021), has major implications for future reservoir management during periods of drought (Vogel et al., 2007). Water storage in snowpack is predicted to become less reliable (Hale et al., 2023; Ikeda et al., 2021; Mote et al., 2018; Nolin & Daly, 2006), placing more reliance on man-made reservoirs for water storage and release timing (Barnett et al., 2005). Continued improvements in understanding reservoir storage during drought across CONUS will be required to address these challenges (Steyaert & Condon, 2023).
Reservoirs can function as buffers or exacerbate propagation of hydrologic drought from upstream to downstream (Ao et al., 2023; J. Wu et al., 2018; Xing et al., 2021). Many reservoirs were built to ensure water supply for various purposes during periods of drought and expected interannual variability. Therefore, studying reservoir drawdown and refilling in response to drought has been a substantial focus of hydrologic engineering in the United States since the early 1950s (Hurst, 1951; Langbein, 1959). Common in hydrologic engineering, reservoirs are classified as having over-year or within-year storage capacities. Within-year storage reservoirs generally refill every year and fully replenish net drafts, while over-year storage reservoirs often take more than a year to fill (Adeloye & Montaseri, 1999; McMahon, 1993; Vogel et al., 1999). This behavior is inherent in reservoir design, and, for this reason, drawdown of reservoir storage is an expected behavior. However, as our hydroclimate changes and assumptions of stationarity are violated (Milly et al., 2008), it’s uncertain if reservoirs will continue to function as expected and desired under future drought conditions (Patterson et al., 2019). Colorado River Basin reservoirs, for example, store four times the river’s annual flow (Udall & Overpeck, 2017) but have still been substantially stressed during the region’s ongoing drought.
Quantifying drought manifestation in reservoirs can be difficult due to the complexity of these systems. This includes often-unique management goals and infrastructure, and the combination of patterns in storage resulting from reservoir water supply and water extracted from and/or released downstream. Hydrological drought, a lack of water in hydrologic systems, can manifest as abnormally low levels in reservoir storage compared to expected long-term seasonal patterns (van Langen et al., 2021; Van Loon, 2015). Given each reservoir’s unique management it’s important to note that periods of unusual drawdowns or abnormally low reservoir storage can be caused by drought but also by shifts in reservoir management due to external factors. For example, changing Endangered Species Act (ESA) requirements resulted in modified reservoir management in Oregon’s Willamette Valley and other locations (Patterson & Doyle, 2018). Identifying and quantifying periods of abnormally low reservoir storage, defined here as low-storage anomalies, is the unique focus of this work as we examine how changing hydroclimatic factors (e.g., drought) and management practices impact reservoirs across CONUS.
Reliability and vulnerability are two commonly used metrics to evaluate reservoir performance in response to drought, growing water use, or other system stresses (Hashimoto et al., 1982). Progressive shifts in basin properties through time, including climate change, land cover change, and water use change, challenge reservoir system’s reliability and vulnerability (Schewe et al., 2014; Srinivasan et al., 2012). Reliability, which reflects how often a system deviates from desired operations, is defined as the fraction of time operational reservoir storage targets are met, and vulnerability, which reflects the relative significance and consequences of these deviations, is defined as the maximum departure from storage targets when an anomaly occurs. Both can be used to evaluate how water management systems, and specifically reservoirs, have adjusted to multi-decade trends in water supply and demand (Jones & Hammond, 2020). As a reservoir’s ability to meet storage targets declines, the maximum departure from desired conditions typically increases (Moy et al., 1986).
Reservoir dynamics during periods of low storage, like drought, have been studied in detail at individual reservoirs and within individual basin systems (Christensen et al., 2004; Turner et al., 2020; Van Oel et al., 2018). Generalized studies at CONUS scale have been lacking (e.g., Patterson & Doyle, 2018), especially compared to research conducted on meteorological drought, agricultural drought (Liu et al., 2016), and other hydrological droughts such as streamflow (Hammond et al., 2022). There may be several reasons for this, including a lack of available unified reservoir data sets across CONUS (Steyaert et al., 2021; Wada et al., 2017) and that complex management decisions and different management objectives can make intercomparison and generalization across reservoirs difficult. Recent studies (Turner et al., 2022) using the reservoir operations data set (ResOpsUS) from Steyaert et al. (2022) have made advances linking US Drought Monitor categories (Svoboda et al., 2002) with declines in hydroelectricity generation at reservoirs.
We developed novel, generalized metrics of unusually low reservoir storage to identify and characterize the magnitude and duration of low reservoir storage across a range of reservoirs in CONUS. While there have been regional assessments of declining reservoir storage (Richter et al., 2024), we look to characterize and generalize CONUS-wide trends and patterns where reservoir storage appears to operate outside of expected conditions.
2 Experimental Setup
We used a reservoir operations data set (ResOpsUS; Steyaert et al., 2021) with daily timeseries of storage to identify and analyze periods of abnormally low storage for 250 large (storage ≥ 0.1 km3) reservoirs in CONUS meeting our auditing criteria (Text S1 in Supporting Information S1). To account for complex drivers and hydrological responses, we leveraged prior studies investigating streamflow drought that used multiple approaches (Sarailidis et al., 2019) and thresholds (Hao et al., 2018) to quantify low-storage anomalies, as no single method universally captures anomalous deviations below normal hydrological conditions (Hammond et al., 2022; Stahl et al., 2020). We identified low-storage anomalies below fixed (a single fixed threshold across the entire period of storage record) and variable (unique thresholds for each day of the year using only the record for that day of the year) thresholds like Hammond et al. (2022) and using an operating curve-based method (Turner et al., 2021; Text S2, Figure S1 in Supporting Information S1). We evaluated the annual duration and severity of low-storage anomalies calculated using a seasonally variable 20th-percentile threshold in all maps, and maximum and minimum annual storages. We tested for monotonic trends in annual low-storage anomaly duration and severity as well as maximum and minimum annual storage using the Mann-Kendall test with two different assumptions regarding the serial structure of the timeseries data used to calculate trend significance: independence and short-term persistence.
Low-storage anomalies can have differing characteristics across reservoirs depending on relative capacity and management objectives, so we classified reservoirs as within-year, over-year, or highly variable. We used a modified subsequent peak algorithm methodology presented by Adeloye and Montaseri (1999) to estimate the average fraction of the net draft from each year’s annual maximum that is within-year storage (storage replenished by next year’s maximum annual storage; McMahon, 1993; McMahon et al., 2007; Vogel et al., 1999). Reservoirs with a lower fraction of within-year storage were classified as over-year storage reservoirs (these reservoirs can often take more than a year to fill). Certain reservoirs, principally those used primarily for flood control, did not fit neatly into either within-year or over-year storage categories. These reservoirs were classified as highly variable if the standard deviations in their year-to-year maximum storages were greater than twice the standard deviations in their year-to-year minimum. Additional methodological details are described in Text S1 of Supporting Information S1.
3 Results and Discussion
3.1 Characterizing Low-Storage Anomalies
We found low-storage anomalies in reservoirs are generally longer, more severe, and more variable in more arid western and central CONUS reservoirs, and for reservoirs with primarily over-year storage, compared to eastern and coastal western reservoirs and within-year reservoirs (Figure S2 in Supporting Information S1). Considerable differences in low-storage anomaly duration and coefficient of variation were observed for neighboring sites in some regions suggesting anthropogenic or location-specific factors are driving these differences (e.g., management objectives, reservoir capacity, policy or law changes). Larger and longer duration low storage anomalies in drier western regions were expected as reservoirs in these regions must handle more variable annual runoff and drought conditions (Hammond et al., 2022; Vogel et al., 1998). Central and parts of southwestern CONUS tend to have larger degrees of regulation (Figure 1; Figure S3 in Supporting Information S1). Long-term reservoir data was unavailable for northeastern CONUS.
Figure 1
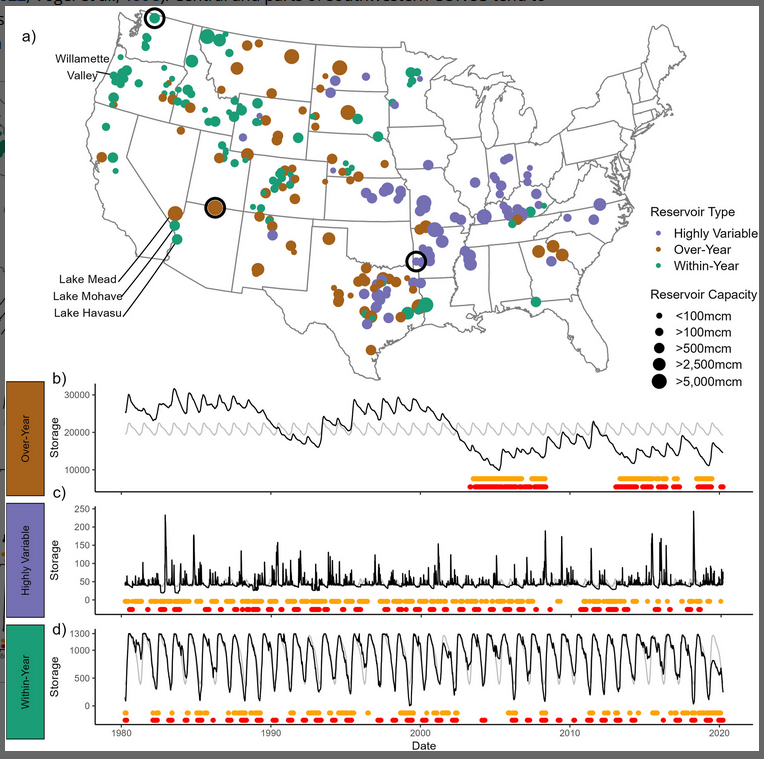
Panel (a) maps the 250 ResOpsUS study reservoirs (Steyaert et al., 2021). Reservoirs are classified into over-year storage (brown; panel b), highly variable storage (purple; panel c), and within-year storage (green; panel d). Point sizes reflect reservoir capacity in million cubic meters (mcm) and color signifies reservoir storage behavior. Black circles show locations of three example reservoirs in Panels b–d. Panels b–d show example timeseries for reservoirs with over-year storage (mcm) (Lake Powell), highly variable storage (Gillham Lake), and within-year storage (Ross Lake). The black line is daily observed storage, and the gray line is average storage for each day of the year. Orange and red lines underlying the timeseries represent periods of identified low-storage anomalies using variable and fixed methods, respectively. [Editor’s Note: This is a good graph but one needs to study the legend fully to benefit from the graph]
We also observed differences in reservoir anomalies based on reservoir management goals (Lehner et al., 2011; Figure S4 in Supporting Information S1). For example, reservoirs primarily managed for recreation and irrigation tend to have longer maximum low-storage anomaly lengths than reservoirs managed for hydroelectricity or flood control.
We observed different characteristics in low-storage anomalies between reservoirs with primarily within-year, over-year, and highly variable storage (Figure 1).
Over-year storage reservoirs are common throughout interior western and southwestern CONUS. Over-year reservoirs (Figure 1b) have longer maximum anomaly lengths, which are potentially reflective of drought. These reservoirs tend to experience distinct and extended periods of low-storage anomalies, often coinciding clearly with basin drought events (Figure S5 in Supporting Information S1). Both fixed and variable methods of identifying low-storage anomalies tend to agree on when storage is below normal. More notable periods of low-flow anomalies are expected, as reservoirs with over-year storage are designed to not refill each year, especially during dry periods. Lake Powell, for example, took 17 years to fill after dam construction (Ferrari, 1988).
Within-year storage reservoirs are the most common reservoir type in northwestern CONUS and are common throughout western CONUS. Within-year reservoirs (Figure 1d) often have cyclical sub-annual storage patterns and low-storage anomalies are often frequent but short. Connecting periods of low-storage anomalies with droughts may be more difficult at these reservoirs than at over-year storage reservoirs. These reservoirs often display differences between fixed and variable methods of anomaly identification. Using a fixed threshold for identifying low-storage anomalies in these reservoirs often identifies regularly occurring low-storage periods as anomalous. In these reservoirs, the variable method of anomaly identification is likely more useful as it identifies periods when reservoir storage deviates from its typical cyclical pattern. The normal operating curve-based method was closest to the variable percentile methods (Figure S6 in Supporting Information S1) but shows fewer reservoirs with multiyear droughts and more year-to-year variability (Figure S2 in Supporting Information S1).
Highly variable storage reservoirs are the most common type of reservoir in eastern CONUS. Highly variable reservoirs (Figure 1c) often have frequent and short periods of low-storage anomalies. However, they typically are not cyclical and regular from year-to-year, instead varying dramatically with many different peaks and low-storage events in any given year. Many of these are flood control reservoirs. They may have typical cyclical operations throughout the year, but these cycles are disrupted due to high peaks in storage from floods. It may be difficult to assess impacts of drought in these reservoirs. A lack of high flood flows into the reservoir, rather than decreased inflows associated with drought propagation may drive periods of anomalously low storage in these reservoirs. Within-year (92%) and over-year (81%) storage reservoirs tended to be consistently classified during each decade, while highly variable reservoirs were often (51%) classified as other reservoir types in different decades, perhaps due to changes in operation priorities, differences in the decadal hydroclimate, or from the classification methods being imprecise over shorter periods of record (Figure S7 in Supporting Information S1).
3.2 Trends in Low-Storage Anomalies
Low-storage anomaly duration and severity are increasing for reservoirs in central, southcentral, southwestern, and coastal northwestern CONUS suggesting the specifications to which these reservoirs were built may no longer be satisfying supply and demand variability under a changing hydroclimate, and with continuing storage loss due to sedimentation, reservoir storage is becoming less reliable and more vulnerable (Figure 2; Figure S8 in Supporting Information S1). Increasing low-storage anomaly durations in southwestern and coastal northwestern CONUS align with previous studies finding increasing streamflow drought durations and deficits over the same period (Hammond et al., 2022). Increases in low-storage anomaly durations in Missouri River tributaries (in South Dakota, Nebraska, and Kansas) were less expected as Hammond et al. (2022) found streamflow drought duration was generally decreasing in these regions. Trends toward increasing low-storage anomaly duration in two main Colorado River Basin reservoirs, Lake Powell and Lake Mead, are consistent with the region’s major drought. Trends in the two reservoirs below Lake Mead (Lake Havasu and Lake Mohave) are juxtaposed with the larger upstream reservoirs, with trends toward decreasing low-storage anomaly durations. This is likely due to differences in size, function, and management priorities between Lake Mead and the two lower reservoirs (Booker, 1995; Booker & Colby, 1995; Harding et al., 1995; U.S. National Park Service, 2017). This different response of these neighboring reservoirs highlights the difficulty of understanding reservoir low-storage anomaly response to extreme hydroclimatic conditions.
Figure 2
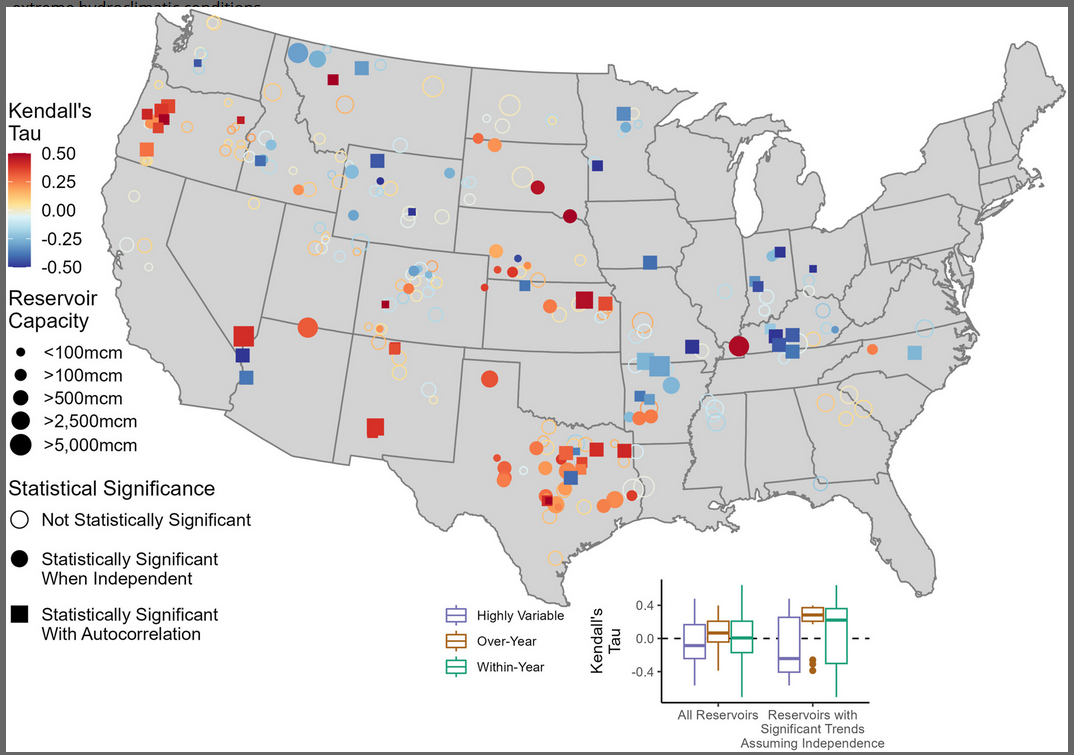
Trends in annual low-storage anomaly duration. Colors show Kendall’s Tau, with red indicating stronger relationships between time and decreasing storage (increasing low-storage anomalies and, therefore, less water available in available storage) and blue indicating stronger relationships between time and increasing storage (decreasing low-storage anomalies and, therefore, more water in available storage). Statistical significance is when p < 0.05. Point sizes reflect reservoir capacity in million cubic meters (mcm). Box plots of Kendall’s Tau are for all reservoirs, separated by reservoir category. [Editor’s note: the explanation is not great but this LINK may be helpful]
Trends toward increasing low-storage anomalies in Oregon align with increasing regional streamflow drought (Hammond et al., 2022) and recent regional drought. However, reservoir management in this region, specifically the Willamette Valley where many reservoirs are located has also changed in recent years. A 2008 ESA biological opinion for salmon (U.S. Fish and Wildlife Services and Oregon Fish and Wildlife Department, 2008) and subsequent operational changes (U.S. Army Corps of Engineers, 2022) had several reservoirs increase reservoir drawdowns in late summer and autumn. This change in reservoir management may cause low-storage anomalies that are mostly independent of climate and basin drivers. Changes in reservoir operation may have signals in low-storage anomalies similar to drought and the driver of any given anomaly may be hard to disentangle when both changes occur. We also found decreases in anomalously low storage in interior northwestern and eastern CONUS (Figure 2). Part of this signal could be from trends toward increasing precipitation in both regions (S. Y. Wu, 2015) and decreasing streamflow drought in eastern CONUS (Hammond et al., 2022). Trends in low-storage anomaly duration vary somewhat by reservoir type, where reservoirs with primarily over-year storage were more likely to see increasing low-storage anomalies. Reservoirs across CONUS are impacted by both changes in management and a changing hydroclimate, and while it may be difficult to disentangle the relative importance of these influences, tracking low-storage anomalies can improve understanding of the combined impact of both changes on reservoir reliability in meeting regional water needs and assessing future vulnerability to continued changes. Qualitative evaluation comparing trends in low-storage anomalies to trends in inflows, runoff, outflows, and water use (Figures S9 and S10 in Supporting Information S1) suggests that declines in upstream runoff and reservoir inflows may have contributed to some low-storage anomalies increases, which mediated or accentuated by changes in water use depending on the region.
Locations with increasing trends in duration of low-storage anomalies indicate that reservoir storage reliability has declined, while reservoirs where departure severity had increased, indicate potential vulnerability to substantial deviations from desired operations. For many reservoir locations, declining reliability (Figure 2) has been concurrent with increasing vulnerability (Figure S8 in Supporting Information S1), corroborating Moy et al. (1986) results that as a reservoir’s ability to meet operational targets declines, the maximum departure from operational targets also increases. These results suggest these systems are becoming increasingly impacted by drought and that it may become increasingly challenging to meet all reservoir operation goals (e.g., irrigation, recreation, hydroelectric generation, water supply, and water quality control) as climatic and water use changes continue to stray from the specifications reservoirs were designed to operate within (Vogel et al., 1999).
3.3 Trends in Maximum and Minimum 7-Day Annual Storage
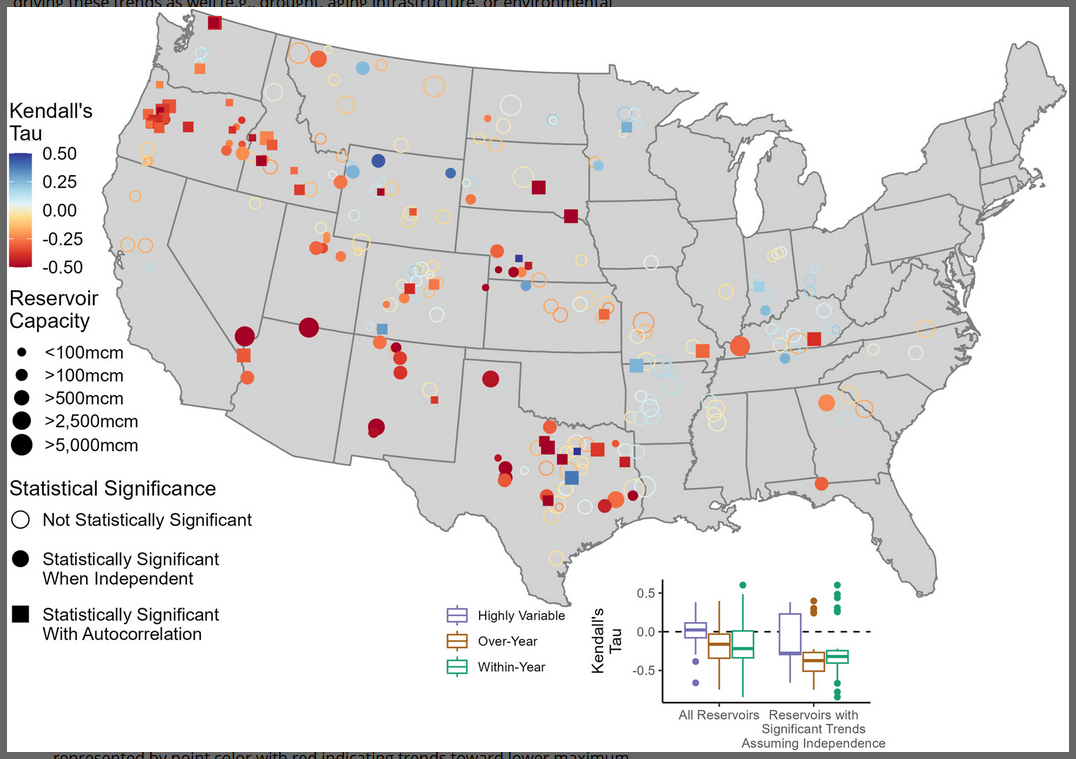
The annual maximum 7-day average reservoir storage is declining for most reservoirs across CONUS (Figure 3). Trends toward lower maximum storages are strong across much of southwestern and northwestern CONUS and Texas. Trends are often more mixed in eastern CONUS and parts of northcentral CONUS where there were more insignificant trends. Trends in maximum annual elevation of reservoirs (Figures S11 and S12 in Supporting Information S1) also suggest declining elevations in many reservoirs, but in fewer than for reservoir storage. This suggests decreasing maximum storage may be associated with reservoir sedimentation (e.g., Gonzalez Rodriguez et al., 2023) reducing the maximum available storage in these reservoirs (Yao et al., 2023), but there are likely other factors driving these trends as well (e.g., drought, aging infrastructure, or environmental regulations), especially in reservoirs with declining maximum elevation. Declines in maximum reservoir storage, while sedimentation continues (and potentially increases in some western regions; Sankey et al., 2017), have implications for drought and low-storage anomalies as reservoirs have less total water capacity to buffer from low inflow periods. It’s important to note that not all reservoir storage timeseries are updated to account for sedimentation so declines in maximum storage and increases in low-storage anomalies are likely stronger than captured here (Figure S13 in Supporting Information S1).
Figure 3
Trends in maximum annual storage. Kendall’s Tau measuring trend strength is represented by point color with red indicating trends toward lower maximum storage and blue indicating trends toward higher maximum storage. Statistical significance is when p < 0.05. Point sizes reflect reservoir capacity in million cubic meters (mcm). Box plots of Kendall’s Tau are for all reservoirs, separated by reservoir category.
Trends in minimum annual storage, and in the timing of both maximum and minimum storage, displayed more spatial variability than trends in maximum annual storage (Figure S14 in Supporting Information S1).
3.4 Regional Low-Storage Anomalies
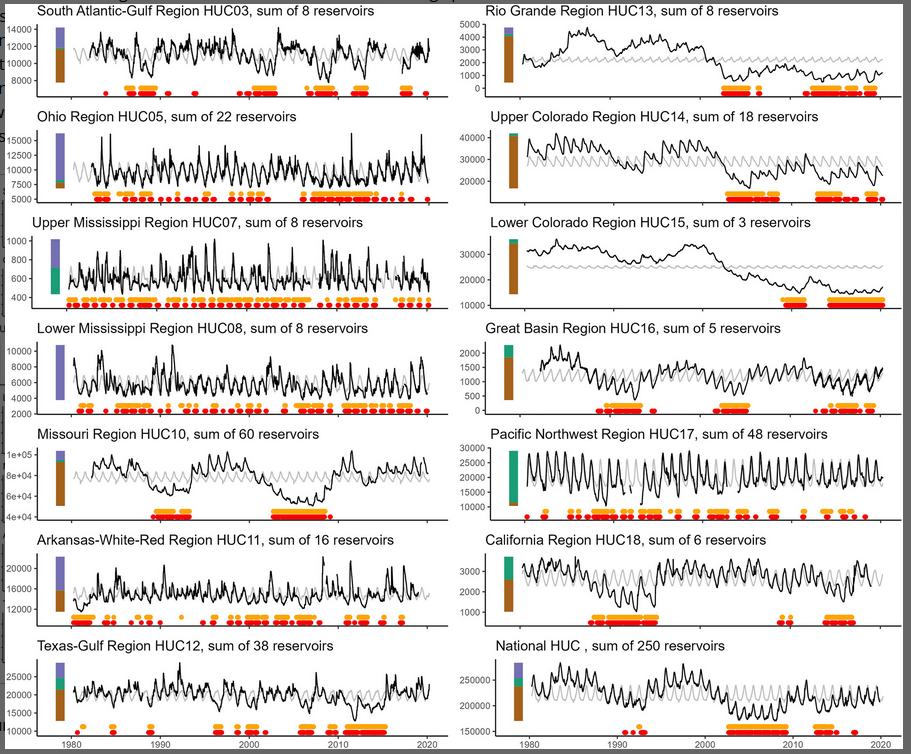
Differences in seasonal patterns and long-term trends in low-storage anomalies seen at individual reservoirs are also evident when we combine reservoirs in HUC02 regions (Figure 4; Figure S15 in Supporting Information S1) across CONUS. Low-storage anomalies in reservoirs vary by region across CONUS (Figure 4). Some regions (e.g., HUC 05, 07, and 08) have uniform patterns year-to-year with regular but short periods of anomalously low storage at regional levels. Other regions (e.g., HUC 10, 13–16, 18), primarily those in central and western CONUS, have distinct periods of extended low-storage anomalies. We observed some notable low-storage anomalies in the 2000s for many of these regions with more extended low-storage periods, with similar patterns for HUCs 13–15. These regions show a strong trend toward drought conditions because of these low-storage periods, similar to trends in southwestern CONUS found by Li et al. (2023). We also observed notable low-storage anomalies in the 1990s for HUCs 10, 16, and 18. Summarized national results closely match national-level hydrologic droughts identified by McCabe et al. (2023). Consistent low-storage anomalies across the 2000s, especially the early 2000s, were evident along with minor low-storage anomalies in the 1990s. This suggests our metrics of low-storage anomalies identify drought influences at a coarse spatial scale.
Figure 4
Timeseries of total reservoir storage for HUC02 regions and all of CONUS for 1981–2020 (Figure S15 in Supporting Information S1). Black lines are storage values. Gray lines are average storage for each day of the year. Yellow and red demarcations along the x-axis represent periods of variable method low-storage anomalies. Storage values are omitted when reservoirs accounting for 5% or more of total basin storage don’t have data. The bar on the figure’s left shows relative storage capacity from over-year (brown), within-year (purple), and highly variable (green) reservoirs. [Editor’s note: This might be the most interesting graph]
Analyzing each region, we can see certain overarching themes about how low-storage anomalies, and subsequently drought, may manifest in reservoirs. For HUC17, we see low-storage anomalies might be declining. We see a period of low-storage anomalies in the 1990s. This contrasts with many Oregon reservoirs which have trended toward increased anomalies. Perhaps they are outweighed by changes in larger reservoirs in the HUC17 basin (Figure 2). Mississippi regions have very cyclical patterns of storage with minimal longer duration periods of anomalously low storage. HUC11 is generally similar but has a noticeable period of more anomalies in the early 2000s which may suggest differences in reservoir vulnerability even between regions with mostly short-term variability in reservoir storage.
4 Conclusion
We developed a generalized approach for exploring low-storage anomalies in reservoirs as an avenue to understand drought manifestation. We found low-storage anomalies in reservoirs are longer, more severe, and more variable in more arid western and central CONUS reservoirs, and for reservoirs with primarily over-year storage. Low-storage anomaly duration and severity have increased for reservoirs in central, southcentral, southwestern, and coastal northwestern CONUS, suggesting the specifications to which these reservoirs were built may not support a changing hydroclimate and sedimentation. This will potentially make these reservoirs less reliable and more vulnerable. Maximum annual storage is declining across most of CONUS, possibly due to sedimentation reducing available storage. Low-storage anomalies have more distinct periods in western and central CONUS regions (minus coastal northwestern CONUS), with major periods of low-flow anomalies in these regions occurring during periods of major observed historical droughts in the early 1990s and from 2000 to 2020.
Many reservoir locations in central and western CONUS indicated simultaneous declining reliability and increasing vulnerability. This suggests that these systems are becoming increasingly impacted by drought and increased water demand and it may become increasingly challenging to meet all reservoir operation goals. Projections of continued population growth (Brown et al., 2019), and intensifying drought conditions (Cook et al., 2020) for much of western CONUS suggest that water management in these regions will become increasingly complex, and new strategies for storing and using water may be needed (Garcia et al., 2020).
These findings help set a baseline for understanding low-storage anomalies and drought manifestation in reservoirs across CONUS but do not replace the value of regional-scale assessments. Improved monitoring of reservoirs and more consistent databases of reservoir properties and timeseries of reservoir states and fluxes, would allow for improved future studies. These improvements, paired with continued large-scale analyses of how reservoirs are changing across CONUS with nonstationarity in climate drivers, water use, and sedimentation, are essential to improve our understanding of reservoirs and impacts from drought.
Acknowledgments
Thank you to the anonymous reviewers for their suggestions and edits that improved this article. Any use of trade, firm, or product names is for descriptive purposes only and does not imply endorsement by the U.S. Government. This research was funded by the U.S. Geological Survey Water Mission Area Drought Program.
–
I hope you found this article interesting and useful.
Mr. Silber is a mathematician and an economist with many years of experience in a variety of technologies. He started his career at Bell Telephone Laboratories and has worked in and provided consulting to many participants in the computer and communications industries. He has also been very involved with Natural Resources having been a V.P. of Planning and Financial Analysis for Kennecott Minerals. Mr. Silber has also taught a graduate course in Information Economics at Polytechnic University which is now part of New York University. Mr. Silber has served as an elected Supervisor and Secretary Treasurer of the Santa Fe - Pojoaque Soil and Water Conservation District. In addition to his consulting practice, Mr. Silber is working on a book that will address the economic issues related to Global Warming.