On the third Thursday of the month right on schedule NOAA issued their updated Seasonal Outlook which I describe as their Four-Season Outlook because it extends a bit more than one year into the future. The information released also included the Mid-Month Outlook for the following month plus the weather and drought outlook for the next three months. I present the information issued by NOAA and try to add context to it. It is quite a challenge for NOAA to address the subsequent month, the subsequent three-month period as well as the twelve successive three-month periods for a year or a bit more.
With respect to the long-term part of the Outlook which I call the Four-Season Outlook, the timing of the transition from Neutral to LaNina is challenging to predict. We are now in ENSO Neutral. La Nina is the likely scenario soon through winter and into Spring next year.
From the NOAA discussion:
“The major climate driver during the winter and early spring 2024-2025 is expected to be La Niña and the outlooks from DJF 2024-2025 through FMA 2025 reflect this with above-normal temperatures favored for the Southern Great Plains, Lower Mississippi Valley, and Southeast.”
“Later in the fall and into the 2024-2025 winter, the three-month precipitation outlooks are based largely on La Niña composites. The spatial coverage for below-normal precipitation probabilities exceeding 50 percent is largest during DJF and JFM across southeastern New Mexico, Texas, and parts of the Southeast where the dry signal is the strongest and occurs most frequently according to La Niña composites. Based on the same reasoning, above-normal precipitation probabilities are at their largest during DJF for the Pacific Northwest. Typically during La Niña, a tight gradient of dry to wet from the Gulf Coast to the Tennessee and Ohio Valleys becomes established during the winter and early spring.”
I personally would not have total confidence in this outlook given the uncertainty about there actually being a La Nina and its strength if it does happen. I do not have the JAMSTEC outlook yet but for sure they will lean towards a weak La Nina with Modoki characteristics. I do not have a lot of confidence that NOAA knows how to deal with a La Nina Modoki. But they may have it exactly correct.
Let’s Take a Look at the (mid-month) Outlook for September
It will be updated on the last day of August.
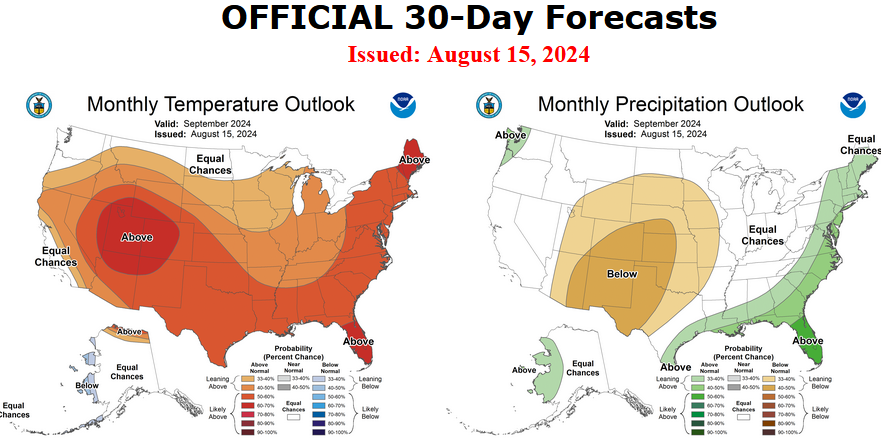
Then we look at a graphic that shows both the next month and the next three months.
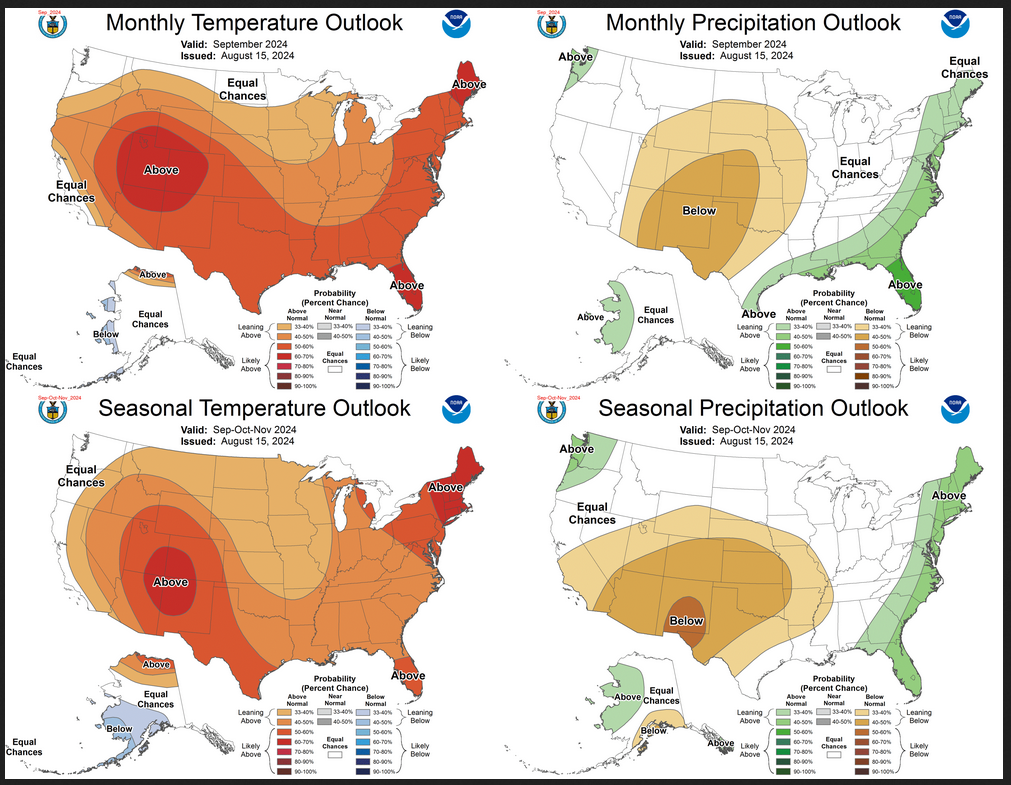
The top row is what is now called the Mid-Month Outlook for next month which will be updated at the end of this month. There is a temperature map and a precipitation map. The second row is a three-month outlook that includes next month. I think the outlook maps are self-explanatory. What is important to remember is that they show deviations from the current definition of normal which is the period 1991 through 2020. So this is not a forecast of the absolute value of temperature or precipitation but the change from what is defined as normal or to use the technical term “climatology”.
| Notice that the Outlook for next month and the three-month Outlook are fairly similar. This tells us that October and November will be fairly similar to September. |
–

The full NOAA Seasonal Outlook extends through September/October/November of 2025 (yes that is more than a year out). All of these maps are in the body of the article. Large maps are provided for September and the three-month period September/October/November. Small maps are provided beyond that through September/October/November of 2025 with a link to get larger versions of these maps.
NOAA provides a discussion to support the maps. It is included in the body of this article. In some cases, one will need to click on “read more” to read the full article. For those on my email list where I have sent the url of the article, that will not be necessary.
Here are larger versions of the Temperature and Precipitation Outlook maps for next month.
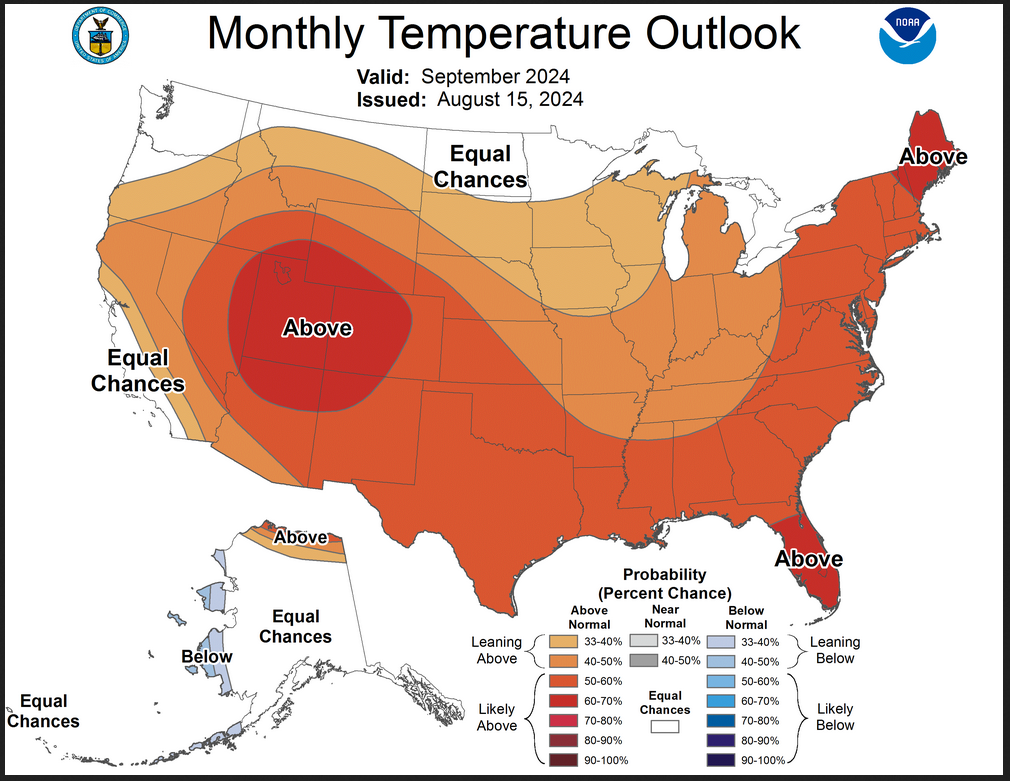
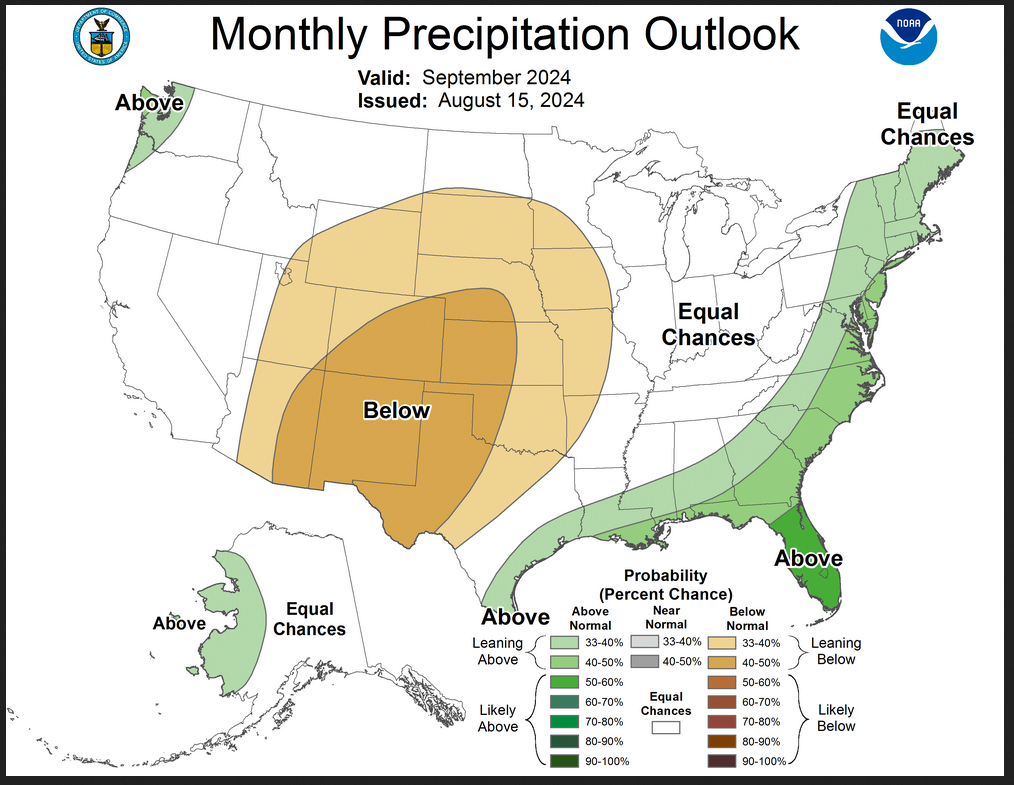
The maps are pretty clear in terms of the outlook.
And here are large versions of the three-month SON 2024 Outlooks
First temperature followed by precipitation.
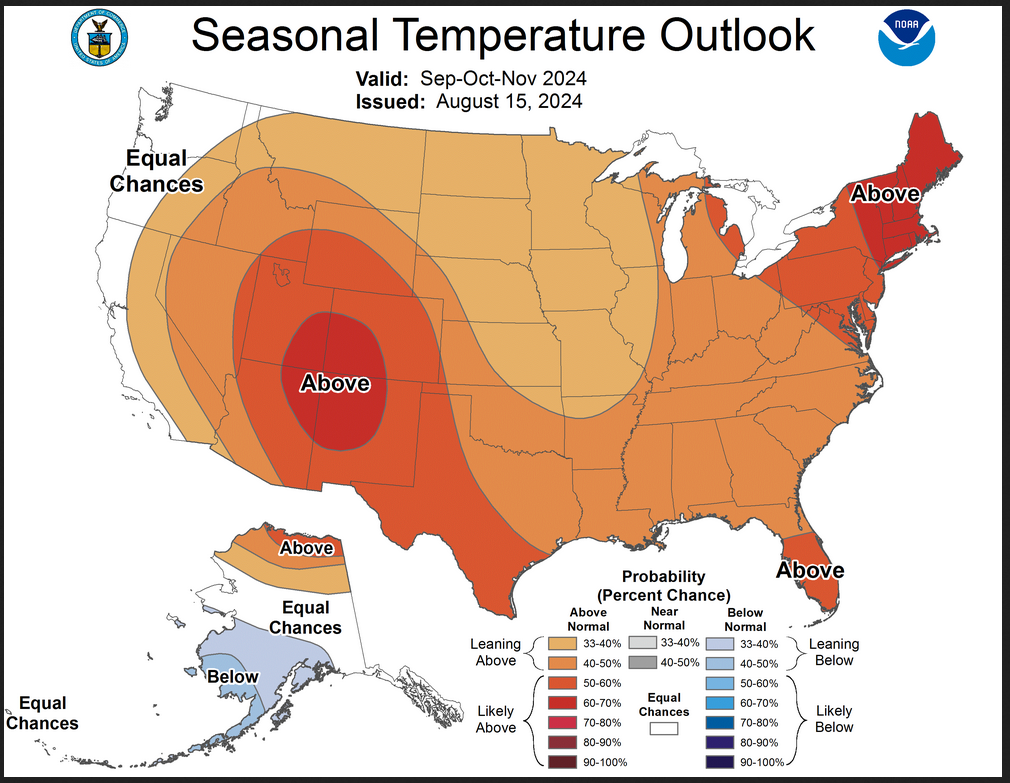
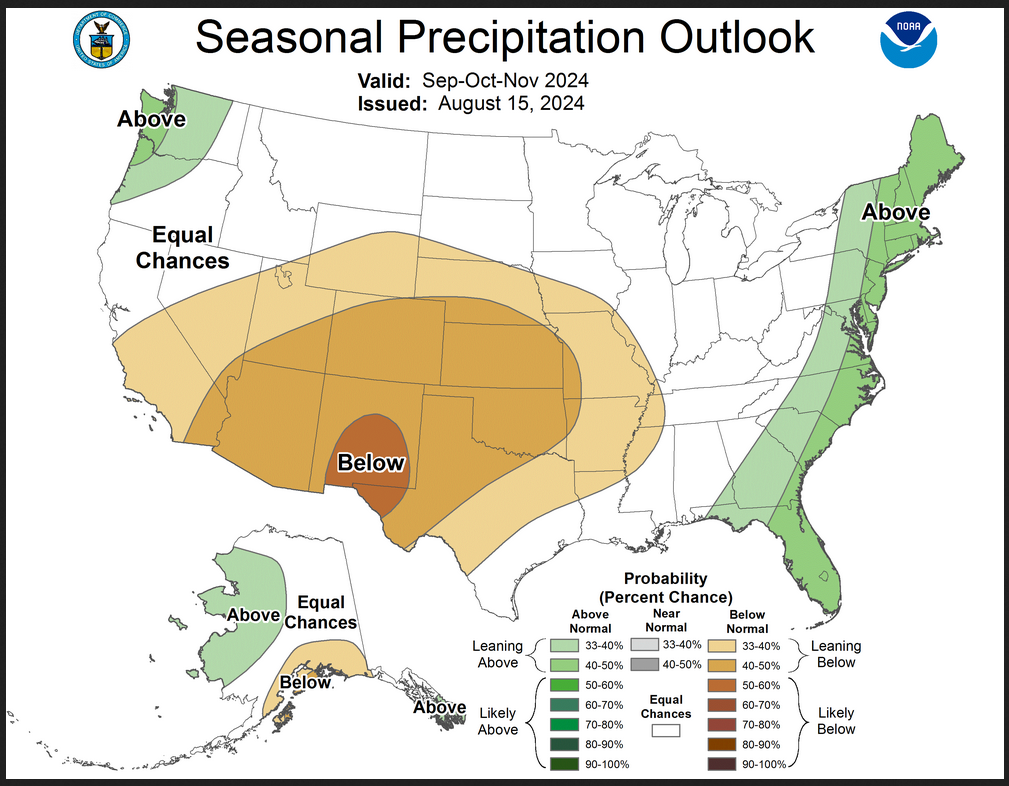
| These maps are larger versions of what was shown earlier. This is a pretty definitive pattern. |
Drought Outlook
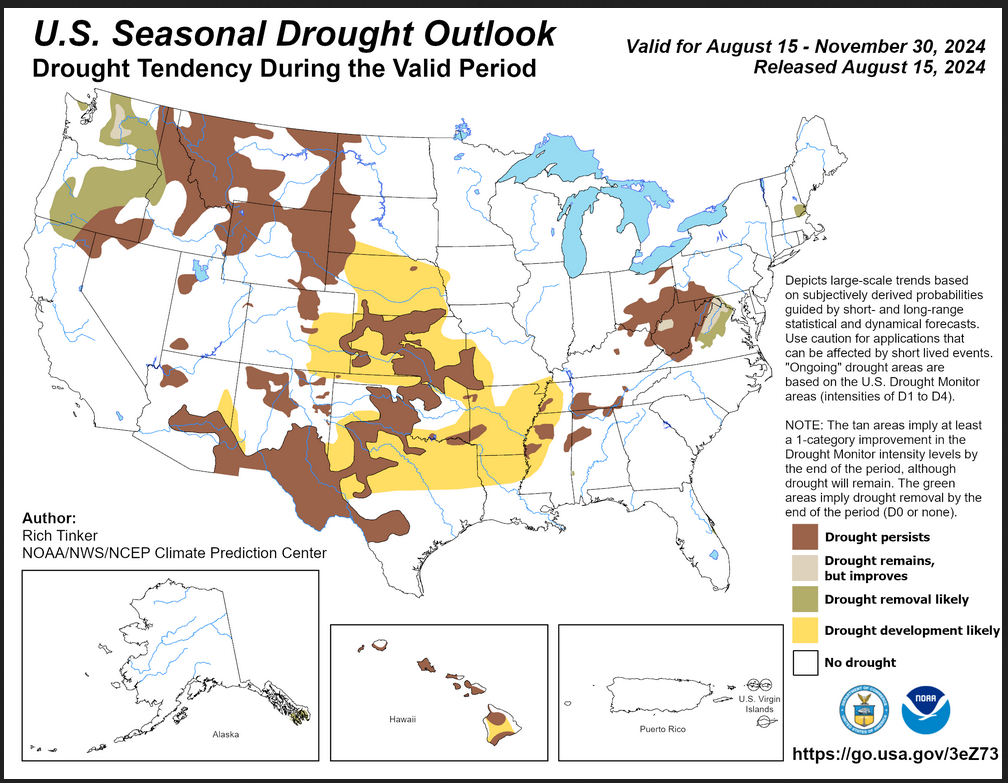
| The yellow is the bad news and there is a lot of it. And there is a large area where drought is expected to persist. Overall the level of drought is expected to increase significantly And with a La Nina winter ahead, it is likely to go higher along the Southern Tier. |
Short CPC Drought Discussion
Latest Seasonal Assessment – Overall, broad improvement in drought conditions covered the Southeast during the past four weeks, with Tropical Storm Debby removing almost all of any residual drought last week. Debby also helped remove drought from most of the Northeast, limiting a broad area of drought to portions of the mid-Atlantic Piedmont, the central Appalachians, and the adjacent Ohio Valley. Farther west, conditions were highly variable across the southeastern Rockies and much of the southern Plains, but improvement from localized heavy rain was more common than deterioration. In contrast, drought intensified or developed in much of the Far West, the Intermountain West, central and northern sections of the Rockies and High Plains, and the central Great Plains. Across Hawaii, sizable areas of drought developed or intensified over southern Kauai, most of Oahu, western Molokai, central and eastern Maui, western Molokai, most of Lanai and Kahoolawe, and the northern Big Island. Meanwhile, moderate drought was unchanged in far southeastern Alaska.
The remaining areas of drought along the Atlantic Seaboard are expected to be removed, with improvement expected in the mid-Atlantic Piedmont. To the west, however, drought is forecast to persist across the central Appalachians and adjacent Ohio Valley. Persistence is also expected in existing areas of drought in small parts of the upper Southeast and from the Mississippi Valley through the Great Basin and Intermountain West. With subnormal precipitation and above-normal temperatures favored during September-October-November in some areas of antecedent dryness over part of the Lower Mississippi Valley and much of the central and southern Plains and parts of the southern Rockies, drought development is forecast for a large part of these regions. The seasonal increase in precipitation is expected to bring drought relief to the Pacific Northwest and Alaska while conditions are expected to persist unchanged across most of Hawaii, though some development is possible in central areas of the Big Island.
Looking out Four Seasons.
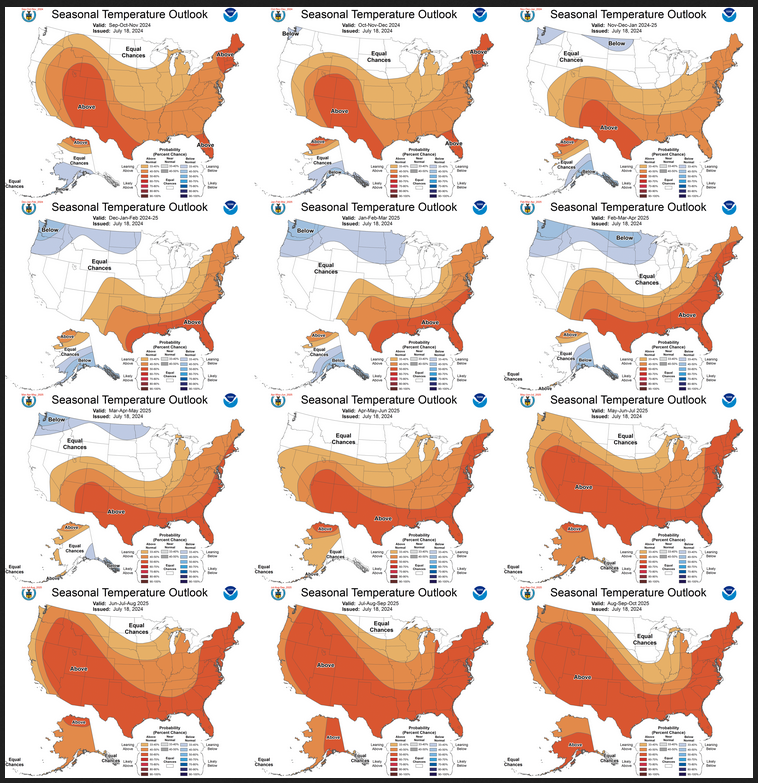
Twelve Temperature Maps. These are overlapping three-month maps (larger versions of these and other maps can be accessed HERE)
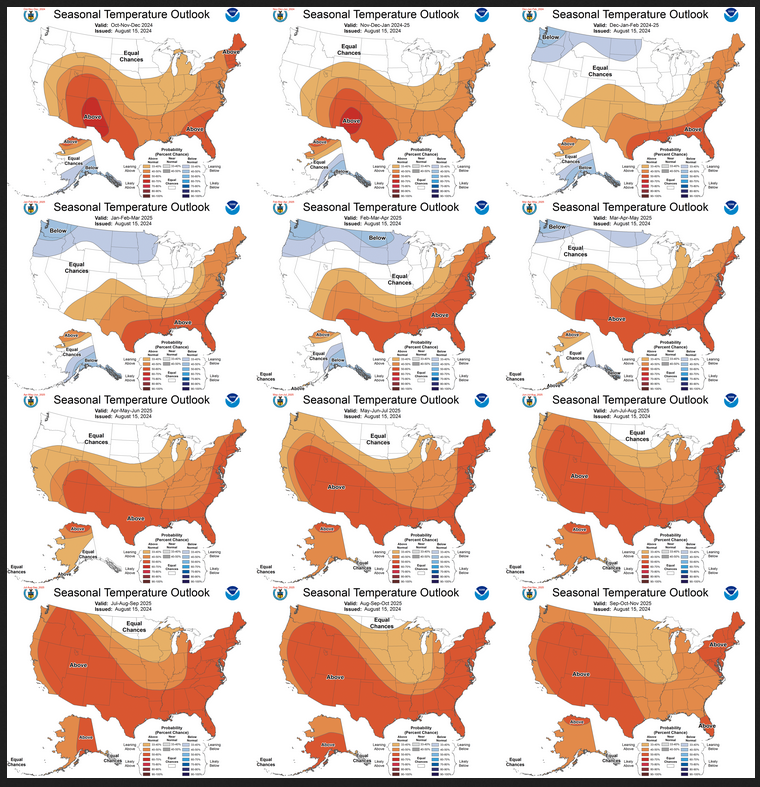
Notice that this presentation starts with Oct/Nov/Dec (OND) since SON is considered the near-term and is covered earlier in the presentation. The changes over time are generally discussed in the discussion but you can see the changes easier in the maps.
Comparing the new outlook with the prior Outlook,
The easiest way to do the comparison is to print out both maps. If you have a color printer that is great but not needed. What I do is number the images from last month 1 – 12 starting with “1” and going left to right and then dropping down one row. Then for the new set of images, I number them 2 – 13. That is because one image from last month in the upper left is now discarded and a new image on the lower right is added. Once you get used to it, it is not difficult. In theory, the changes are discussed in the NOAA discussion but I usually find more changes. It is not necessarily important. I try to identify the changes but believe it would make this article overly long to enumerate them. The information is here for anyone who wishes to examine the changes. I comment below on some of the changes from the prior report by NOAA and important changes over time in the pattern.
| There has not been much of a change since last month. The La Nina impacts begin a month later than in last month’s Seasonal Outlook. But the overall pattern has not changed. |
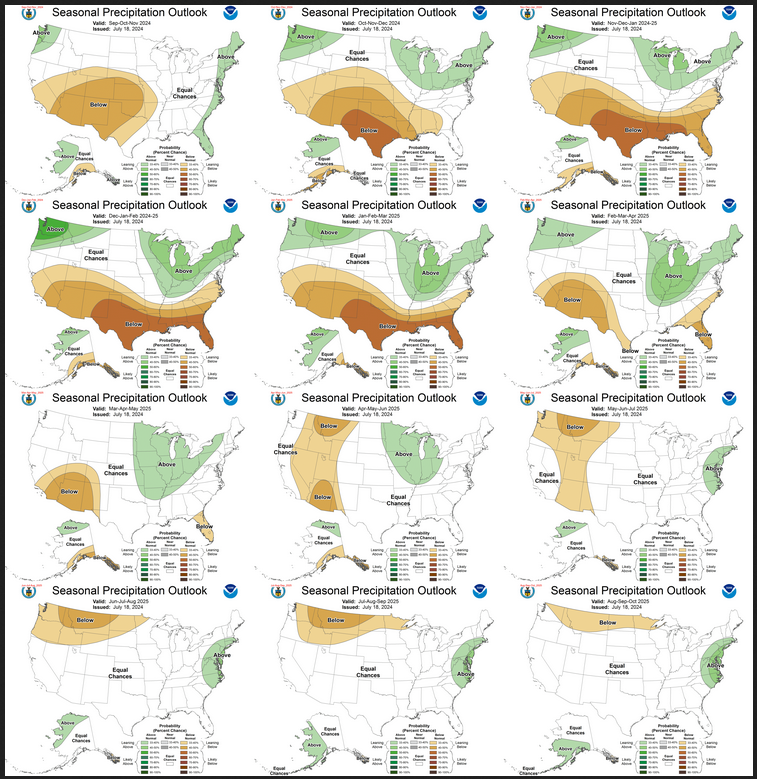
Now the Twelve New Precipitation Maps
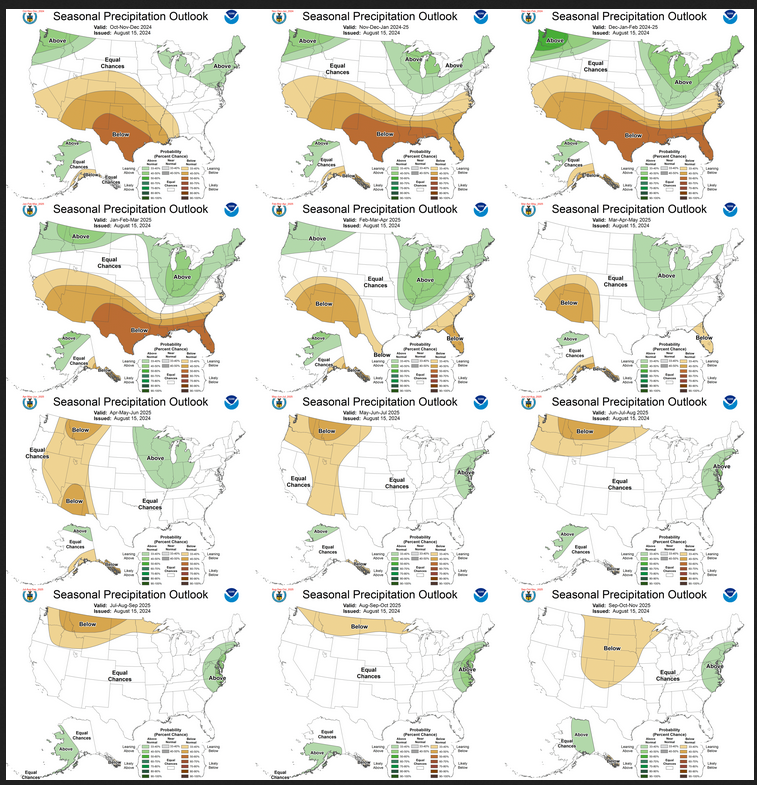
Similar to Temperature in terms of the organization of the twelve overlapping three-month outlooks.
Comparing the new outlook with the prior Outlook,
The maps that were released last month.
A good approach for doing this comparison is provided with the temperature discussion.
| The overall outlook is the same as last month. That is a bit surprising since La Nina is expected to be delayed by about a month. |
NOAA Discussion
Maps tell a story but to really understand what is going you need to read the discussion. I combine the 30-day discussion with the long-term discussion and rearrange it a bit and add a few additional titles (where they are not all caps the titles are my additions). Readers may also wish to take a look at the article we published last week on the NOAA ENSO forecast. That can be accessed HERE.
I will use bold type to highlight some especially important things. All section headings are in bold type; my comments, if any, are enclosed in brackets [ ].
CURRENT ATMOSPHERIC AND OCEANIC CONDITIONS
Equatorial SSTs are above average in the western Pacific, near average in the east-central Pacific, and below average in the eastern Pacific. Weekly observed SST anomalies in the Niño 3.4 region are at 0.0 degrees Celsius. Subsurface temperature anomalies (averaged from 180-100W and 0-300 meters) are near -1.0 degrees Celsius which is a decrease from early July. From July 14 to August 8, OLR anomalies were near average for much of the equatorial Pacific and Maritime Continent. Low-level (850-hPa) wind anomalies were easterly over the east-central and eastern equatorial Pacific. Upper-level (200-hPa) wind anomalies were highly variable east of the Date Line, with easterly anomalies from 160W to 140W and westerly anomalies around 100W. These atmospheric and oceanic conditions reflect a continuation of ENSO-neutral conditions. The Madden-Julian Oscillation (MJO) strengthened during early August with a more coherent wave-1 pattern developing over the global tropics. During the remainder of August, the MJO with anomalous upper-level divergence is forecast to propagate east from Africa to the Indian Ocean and Maritime Continent. This would likely provide a favorable large-scale environment for tropical cyclone development across the main development region of the Atlantic basin through the beginning of September. The MJO is also forecast to result in enhanced trade winds across the equatorial central Pacific which may contribute to negative SST anomalies becoming better established and a transition to La Niña.
PROGNOSTIC DISCUSSION OF SST FORECASTS
The CPC SST consolidation forecast for Niño 3.4 depicts decreasing negative anomalies during the fall with a -0.6 degree C anomaly persisting from October-November-December 2024 to January-February-March 2025 [Author’s Note: that would be a marginal La Nina]. The CFSv2 has the most negative anomaly (below -1.0 degree C) among the model inputs to the NMME and C3S. The CPC ENSO outlook indicates a likely transition to La Niña during September-October-November with probabilities at or above 70 percent for La Niña conditions to persist during the late fall and early winter 2024-2025. By the spring 2025, ENSO-neutral conditions become more favored.
30-DAY OUTLOOK DISCUSSION FOR SEPTEMBER 2024
The September 2024 monthly temperature and precipitation outlooks are made under neutral El Niño Southern Oscillation (ENSO) climate conditions. The most recent weekly Niño 3.4 sea surface temperature (SST) anomaly is at 0.0 degrees Celsius. SST anomalies for the Niño 3.4 region of the east-central equatorial Pacific Ocean have remained steady over the last two-to-three months. In recent weeks, lower level wind anomalies at 850 hPa were easterly over the east-central and eastern equatorial Pacific Ocean, while upper level wind anomalies at 200 hPa were easterly over the east-central equatorial Pacific Ocean and westerly over the eastern equatorial Pacific Ocean. Outgoing longwave radiation (OLR) anomalies are weak across the equatorial Pacific Ocean, indicating near-average convection. These ocean and atmosphere conditions indicate neutral ENSO conditions have persisted. A potential transition to La Niña conditions is forecast and may be a driver of temperature and precipitation patterns over North America in the near future and in the September temperature and precipitation outlooks.
On subseasonal timescales, the Madden Julian Oscillation (MJO) is active in phase 1 near the threshold of phase 2 with enhanced convection over Africa. Dynamical model forecasts indicate that the MJO will propagate eastward into the Indian Ocean and Maritime Continent in the next couple weeks. Lagged composites indicate that this active MJO would increase temperatures over the western United States in early September, with potentially cooler temperatures over parts of the eastern contiguous U.S. (CONUS). Impacts of the MJO were generally considered in the September monthly outlook through dynamical model forecasts for the week 3-4 period that overlap with the first half of September. In addition to the teleconnections over North America, more favorable conditions for tropical cyclone activity over the Atlantic at the start of September are predicted.
The September temperature and precipitation outlooks were based primarily on dynamical model forecasts and a combined consolidation of the statistical and dynamical model forecasts. Dynamical model forecasts for the month of September are from the North America Multimodel Ensemble (NMME). In addition, the full consolidation includes a consolidation of the statistical models: the Canonical Correlation Analysis (CCA), the Constructed Analog (CA), and an ENSO OCN tool, that combines the impact of ENSO, based on the CPC SST consolidation predicted median Niño 3.4 SST anomaly, with the Optimum Climate Normal (OCN) representing decadal trends . Daily initialized forecasts from the NCEP CFSv2 dynamical model and the most recent ECMWF and GEFS dynamical model forecasts for the week 3-4 period that overlaps the beginning of the month of September were also considered. Recent boundary conditions, including coastal SSTs, and soil moisture anomalies, were additional factors considered.
Temperature
The September temperature outlook favors below-normal temperatures along the west coast of Mainland Alaska, consistent with dynamical model guidance from the NMME including the CFSv2, plus ECMWF and GEFS forecasts for the week 3-4 period ending September 10th, as well as well below average SSTs along the coast. Above-normal temperatures are likely along the coast of the North Slope, consistent with well below average sea ice extent and above average SSTs. Above-normal temperatures are likely across most of the CONUS, supported primarily by the consolidation of statistical and dynamical forecast tools. The probability of above-normal temperatures exceeds 60 percent for a large area of the West from the Four Corners region to the eastern Great Basin and central Rockies, where dynamical models , statistical models, and decadal trends all indicate a strong temperature signal. The probability of above-normal temperatures exceeds 60 percent for parts of northern New England, where adjacent SSTs are above average, ECMWF week 3-4 forecasts favor above-normal, and decadal temperature trends are strong. Above average adjacent SSTs lead to a 60 percent probability of above-normal temperatures for the Florida Peninsula. Equal chances (EC) of below-, near- and above-normal temperatures are indicated along the central and southern California coast, where temperatures are moderated by near-to-below average SSTs. EC is also indicated for parts of the Pacific Northwest along the northern tier into the Northern Plains and Upper Mississippi Valley, where the PAC-calibrated NMME temperature forecast shows moderation of probabilities due to lower skill and/or weaker signals, while the full consolidation forecast predicts near-normal is favored in some of the same areas.
Precipitation
The September precipitation outlook slightly favors above-normal precipitation for parts of western Mainland Alaska, supported primarily by dynamical model forecasts from the NMME. Above-normal precipitation is favored for a small coastal area of the Pacific Northwest, consistent with the CFSv2 forecast and possible early impacts of La Niña. Below-normal precipitation is favored over a large area of the western CONUS from eastern areas of the Desert Southwest northward to the High Plains of Montana and eastward into much of the Great Plains and the Central Mississippi Valley, consistent with negative precipitation anomaly forecasts from the NMME multi-model ensemble mean and impacts from potential La Niña conditions. Above-normal precipitation is favored for the entirety of the Gulf Coast and northward along the Atlantic Coast to Maine, consistent with the peak month of a predicted active Atlantic tropical cyclone season in addition to favorable conditions for Atlantic tropical activity at the start of September related to the predicted propagation of the MJO. The probability of above-normal precipitation exceeds 50 percent for parts of the Florida Peninsula, supported by NMME forecasts for September.
SUMMARY OF THE OUTLOOK FOR NON-TECHNICAL USERS (Focus on September, October, November)
El Niño Southern Oscillation (ENSO) conditions are neutral with equatorial sea surface temperatures (SSTs) above average in the western Pacific, near average in the east-central Pacific, and below average in the eastern Pacific. La Niña is favored to develop during September-October-November (66% chance) and persist through the winter 2024-2025 (near 70% chance).
Temperature
The September-October-November (SON) 2024 temperature outlook favors above-normal temperatures across a majority of the contiguous U.S. with the largest probabilities (exceeding 60%) forecast for New England and parts of the Southwest. Increased below-normal temperature probabilities are forecast for southwestern Alaska, while above-normal temperatures are more likely across northern Alaska.
Precipitation
The SON 2024 precipitation outlook depicts elevated probabilities for above-normal precipitation along the East Coast, parts of the Pacific Northwest, and western Alaska. Below-normal precipitation is favored for the Central to Southern Great Plains, Central Rockies, Southwest, southern California, and southern Alaska.
Areas depicted in white and labeled “Equal-Chances” or “EC” are regions where climate signals are weak, and so there are equal chances for either above-, near- or below-normal seasonal mean temperatures or total precipitation amounts.
BASIS AND SUMMARY OF THE CURRENT LONG-LEAD OUTLOOKS
PROGNOSTIC TOOLS USED FOR U.S. TEMPERATURE AND PRECIPITATION OUTLOOKS
The temperature and precipitation outlooks for SON 2024 were based on dynamical model guidance such as the North American Multi-Model Ensemble (NMME) and Copernicus (C3S) along with statistical tools including the global SST-based Constructed Analog and ENSO-OCN. The Calibration, Bridging and Merging (CBaM) tool anchored to the NMME forecasts and “bridged” to the Niño3.4 index was also utilized. The objective, historical skill-weighted consolidation, that combines dynamical and statistical tools, was relied upon in many of the outlooks. La Niña composites were considered for the SON temperature and precipitation outlooks but were used more extensively from OND 2024 to JFM 2025 as its influence on the mid-latitude circulation pattern is expected to increase later this fall and into the winter. Long-term climate trends were considered for all leads, but were relied upon most from the spring 2025 through SON 2025.
PROGNOSTIC DISCUSSION OF OUTLOOKS – SON 2024 TO SON 2025
TEMPERATURE
Above-normal temperatures are favored across a majority of the contiguous U.S. (CONUS) during SON 2024 which is supported by the NMME, C3S, consolidation tool, and decadal trends . Based on the dynamical models and statistical tools, the largest probabilities (above 60 percent) for above-normal temperatures are forecast for New England and parts of the Southwest. Most guidance features a decreasing warm signal closer to the West Coast where equal chances (EC) of below, near, or above-normal temperatures are forecast. The previous seasonal outlook for SON featured EC across the Northern Great Plains and Upper Mississippi Valley. This was shifted to a slight lean for above-normal temperatures due to good agreement among the dynamical models including relatively large probabilities (above 50 percent) in the CBAM + Trend along with the C3S. Although above-normal temperatures are the most likely outcome on the seasonal time scale for the eastern and central CONUS, northward tracking tropical cyclones could alter the mid-latitude circulation pattern and result in periods of cooler-than-normal temperatures for these areas this fall. Above-normal temperatures are favored along the North Slope of Alaska due to low sea ice and decadal trends . Below-normal temperatures are more likely for southwestern Alaska and the Aleutians due to below-normal SSTs along with consistency from the previous month.
Minor changes were made to the previous outlooks for OND and NDJ. The slight lean towards below-normal temperatures in parts of the Pacific Northwest (OND and NDJ) and Northern Great Plains (NDJ) was adjusted to EC due to the lack of support from dynamical models and any La Niña cooling influence may be delayed. Also, La Niña cooling is typically most pronounced, beginning in DJF. During OND and NDJ, the latest NMME supports an increase in above-normal temperature probabilities across the Southwest and Central to Southern Great Plains. The major climate driver during the winter and early spring 2024-2025 is expected to be La Niña and the outlooks from DJF 2024-2025 through FMA 2025 reflect this with above-normal temperatures favored for the Southern Great Plains, Lower Mississippi Valley, and Southeast. Elevated below-normal temperature probabilities are forecast for southeastern Alaska and also extend east from the Pacific Northwest to the Northern Great Plains and Upper Mississippi Valley. Later in the spring 2025 and continuing through the summer and fall 2025, decadal trends became the major factor in the temperature outlook.
PRECIPITATION
The SON precipitation outlook favors below-normal precipitation across the Central to Southern Great Plains, Southwest, and southern California based on the NMME, C3S, and consolidation tool. Given the excellent model agreement and consistency, below-normal precipitation probabilities exceed 50 percent for southern New Mexico and parts of western Texas. Based on the NMME and C3S, elevated below-normal precipitation probabilities extend east to inland areas of the Lower Mississippi Valley. EC were necessary closer to the Gulf Coast due to the potential for heavy precipitation associated with any landfalling tropical cyclones. The likelihood of an active Atlantic hurricane season was the primary factor in favoring above-normal precipitation along the East Coast. In addition, the NMME and C3S support above-normal precipitation for the Southeast and the consolidation tool features a wet signal for both the Southeast and New England. Above-normal precipitation is also favored for the Pacific Northwest and western Alaska based on the NMME and consistent with La Niña composites, while those tools support elevated below-normal precipitation probabilities for southern Alaska. Later in the fall and into the 2024-2025 winter, the three-month precipitation outlooks are based largely on La Niña composites. The spatial coverage for below-normal precipitation probabilities exceeding 50 percent is largest during DJF and JFM across southeastern New Mexico, Texas, and parts of the Southeast where the dry signal is the strongest and occurs most frequently according to La Niña composites. Based on the same reasoning, above-normal precipitation probabilities are at their largest during DJF for the Pacific Northwest. Typically during La Niña, a tight gradient of dry to wet from the Gulf Coast to the Tennessee and Ohio Valleys becomes established during the winter and early spring. The consolidation tool and La Niña composites were relied upon for the Alaska precipitation outlook from OND 2024 to FMA 2025. Similar to the temperature outlook at later lead times, the precipitation outlook during the late spring, summer, and fall 2025 was based largely on decadal trends .
The key piece of information used by NOAA follows.
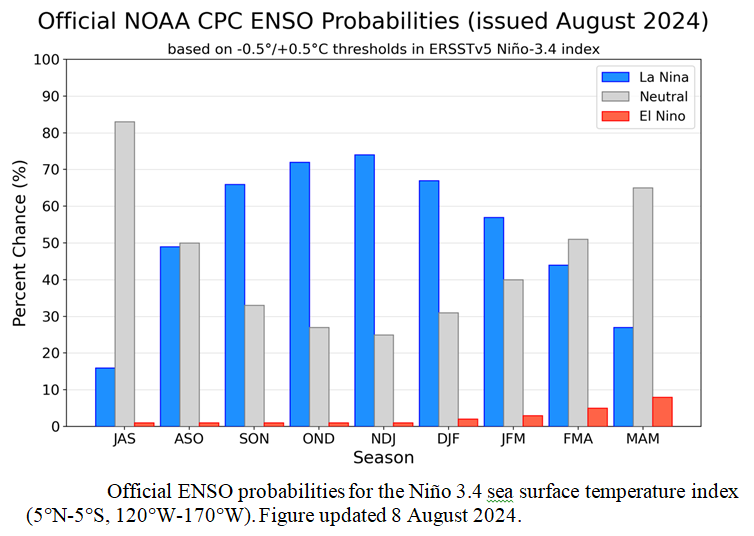
| It looks like ENSO is Neutral now and by Fall we should be in La Nina which continues through the forecast period shown here but the full forecast in this article goes beyond next winter. This type of graphic does not show how strong an El Nino or a La Nina is likely to be. What is forecast is a La Nina may not be stronger than a marginal La Nina. |
Resources
Other Reports and Information
The Wildfire Report can be accessed HERE
–
| I hope you found this article interesting and useful. |
–